Market Snapshot
Middle bar: base-year value × (1 + CAGR), rounded to two decimals. This is a calculated illustration, not a separately researched annual estimate.
The US replacement tire market is valued at USD 57.69 billion in 2025 and is projected to reach USD 66.86 billion by 2030, registering a CAGR of 2.99% over 2026–2030. The market covers new passenger, light truck and truck and bus tires sold to replace worn or damaged tires on the 298.561 million vehicles in operation across the United States. Shipments of 284.3 million replacement tires in 2025 anchor the value, and passenger tires lead with 66.37% of market value, while light truck tires grow fastest at a 4.52% CAGR.
Market size and forecast figures are generated using Marqstats' proprietary estimation framework, updated as of October 2026.
Coverage spans three tire classes, seven distribution channels and the five Traffic Volume Trends regions defined by the Federal Highway Administration (FHWA), from the Northeast to the West. Replacement demand is sized at the retail value of the tire, and the analysis tracks the leading replacement size codes in each class, from 225/65R17 in passenger tires to 295/75R22.5 and 11R22.5 in truck and bus tires.
Key Takeaways
Market Overview & Analysis
Report Summary
The US replacement tire market comprises new passenger, light truck and truck and bus tires purchased to replace tires on vehicles already in service, valued at USD 57.69 billion in 2025. Original equipment fitments, 52.1 million of the 336.3 million tires shipped in 2025, and retreaded truck tires sit outside the market perimeter, although original equipment sizes act as a forward indicator of replacement demand as vehicles age. The USTMA reports 2025 replacement shipments of 221.9 million passenger, 37.7 million light truck and 24.7 million truck tires, a total of 284.3 million units. Value equals USD 193.23 per vehicle in operation, a figure that frames the market as a maintenance expense tied to the 298.561 million vehicles in operation rather than to new vehicle sales.
Demand is driven by distance traveled and tire wear, and the vehicle mix decides what each replacement event is worth. Vehicle miles traveled reached 3,323.786 billion in 2025, up 0.9%, according to the FHWA Traffic Volume Trends series. Light trucks, which include pickups, SUVs and crossovers, account for 65.7% of the 288.727 million light vehicles in operation, and they carry larger, higher-value fitments such as 275/60R20 and 235/60R18. The average value of a passenger replacement tire stands at an estimated USD 172.56 in 2025, against USD 248.87 for a light truck tire and USD 405.56 for a truck and bus tire, so a shift of one replacement event from a sedan to a pickup lifts market value even when unit demand is flat.
Trade policy and producer prices set the pricing frame for 2026–2030. The Section 232 tariff on automobile parts applied a 25% duty to imported tires from 3 May 2025, and the US Bureau of Labor Statistics (BLS) Producer Price Index for passenger car pneumatic tires averaged 202.94 in January to June 2026, 2.57% above its 2025 average of 197.85. The Goodyear Tire & Rubber Company reported a USD 100 million global tariff and other cost headwind in the second quarter of 2026. Replacement prices therefore rise faster than volumes through the forecast period, and the market grows at 2.99% in value against 0.35% in units, from 284.3 million tires to an estimated 289.32 million.
Supply is led by global manufacturers selling through a consolidating dealer channel. Compagnie Générale des Établissements Michelin SCA, Bridgestone Corporation, The Goodyear Tire & Rubber Company and Continental AG generated estimated 2025 tire revenue of USD 76.23 billion worldwide, and manufacturer brands account for 77% of passenger and 82% of light truck replacement shipments in the United States. Retail ownership is concentrating, with Mavis Tire Express Services Corp. completing its USD 700 million purchase of Pep Boys in August 2026 and Big Brand Tire & Service agreeing in July 2026 to acquire Belle Tire Distributors Inc. Coverage of the full tire-industry cycle continues in the Marqstats analysis of the Top 10 Tire Industry Trends Shaping 2026 and Beyond.
Market Dynamics
Key Drivers
Five conditions sustain replacement demand in the United States, and each is anchored in the size and use of the vehicle parc.
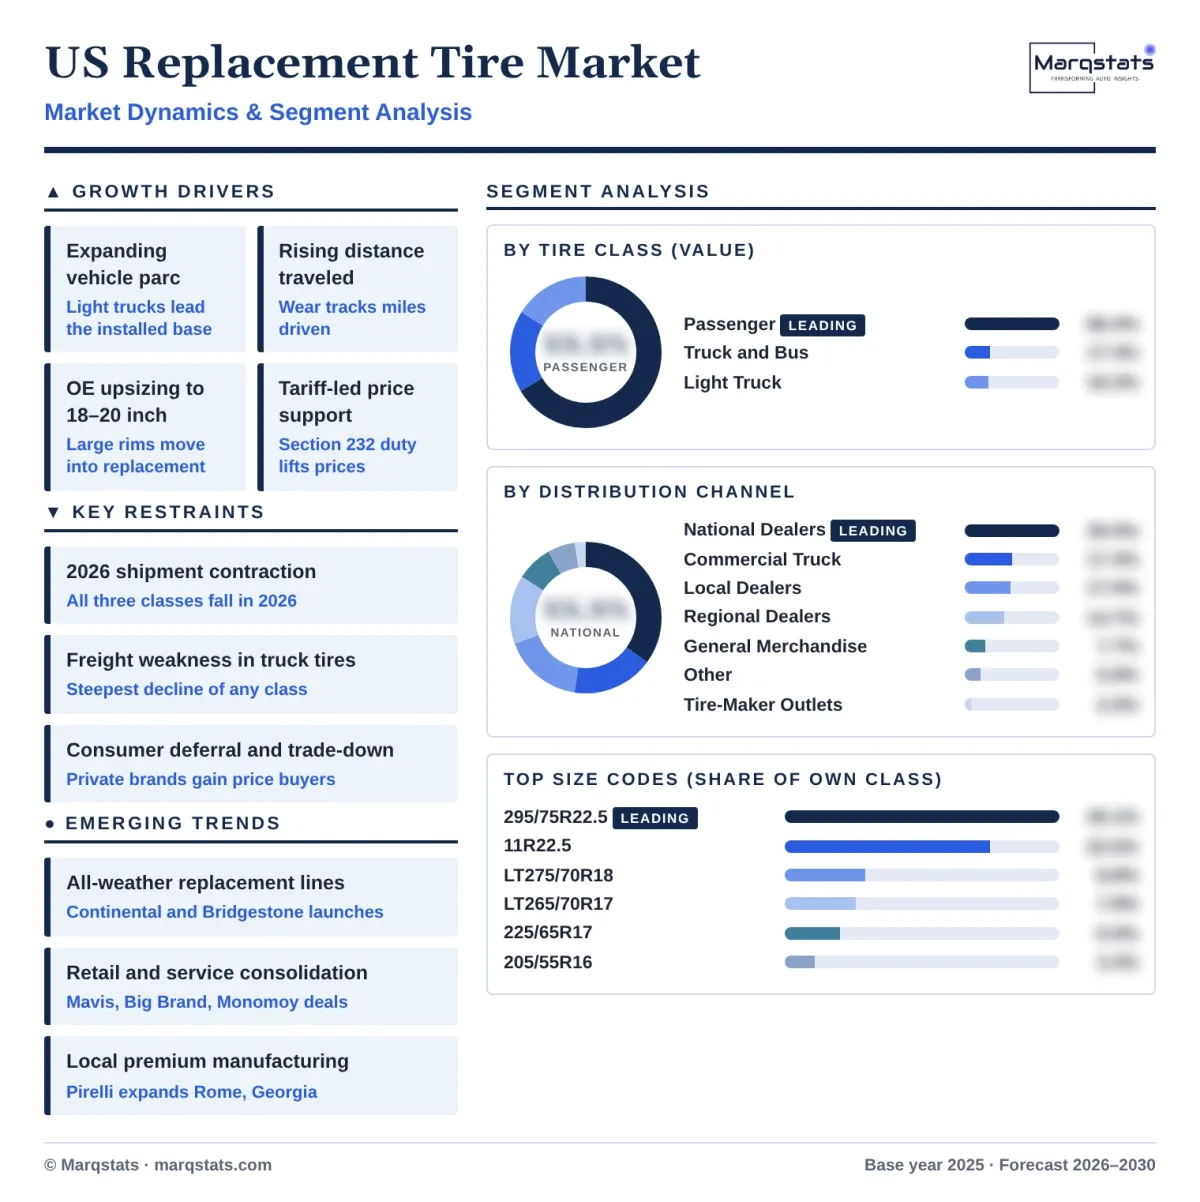
- Expanding vehicle parc. The US vehicle parc reached 298.561 million units in 2025, including 189.616 million light trucks and 9.834 million medium and heavy vehicles, which sets the installed base for every replacement event. Light truck numbers grow at 2.82% a year on the 2020–2025 record, supporting demand for larger sizes such as LT275/70R18 and LT265/70R17.
- Rising distance traveled. Vehicle miles traveled reached 3,323.786 billion in 2025, up 0.9% or 29.8 billion miles, according to the FHWA. Tread wear accumulates with distance, so higher travel converts directly into replacement volume, and the 2025 gain supports the recovery in passenger and light truck shipments forecast after 2026.
- Upsizing of original equipment fitments. Original equipment sizes move into the replacement pool as vehicles age, and the 2025 passenger original equipment ranking is led by 275/60R20 at 7.8% and 235/60R18 at 6.0%. The replacement share of 235/60R18 reached 3.3% in 2025, showing the transfer of large-rim sizes into dealer inventories and lifting the average value per tire.
- Light truck and commercial van mix. Light truck replacement shipments reached 37.7 million units in 2025, with LT275/70R18 at 8.8% and the commercial-van size 235/65R16C at 5.3% of the segment. Pickup, SUV and delivery-van demand carries an estimated USD 248.87 average value per tire, 44.2% above the passenger average, which raises market value faster than units.
- Price support from tariffs and input costs. The 25% Section 232 duty on imported tires from May 2025 and higher producer prices lift replacement prices across the forecast period. The BLS Producer Price Index for tires averaged 195.76 in January to August 2026, 2.20% above the 2025 average, and Marqstats projects average replacement values to rise 2.64% a year from 2027.
Key Restraints
Four constraints hold unit growth below the rate of price growth through 2030.
- Shipment contraction in 2026. The USTMA July 2026 forecast, published on 6 August 2026, projects replacement passenger shipments of 218.3 million units and light truck shipments of 37.1 million, each down 1.6%. Total replacement shipments fall to 278.3 million units, and market value eases to an estimated USD 57.57 billion in 2026 before growth resumes in 2027.
- Freight weakness in truck and bus tires. Replacement truck tire shipments are forecast at 22.9 million units in 2026, down 7.1% from 24.7 million in 2025, the steepest decline of any replacement class. The fall removes an estimated USD 0.53 billion of truck and bus value in 2026, and segment units return only to 24.59 million by 2030.
- Consumer deferral and trade-down. Goodyear reported a 13% decline in Americas replacement unit volume in the second quarter of 2026, following a 23.2% decline in the first quarter, citing lower industry sell-in in North America. Private brands hold 14% of passenger and 12% of light truck replacement shipments, and price-sensitive buyers shift toward this tier when replacement is deferred.
- Domestic capacity rationalization. Goodyear is taking steps to close its Fayetteville, North Carolina tire plant by the end of 2027, reducing domestic tire output while the 25% tariff raises the landed cost of imports. The combination tightens supply options for dealers and lifts shelf prices, which restrains unit demand among cost-conscious owners of older vehicles.
Key Trends
Four shifts are changing how replacement tires are designed, sold and sourced in the United States.
- All-weather replacement lines. Continental Tire the Americas, LLC added the SecureContact AW in January 2026 in 46 sizes from 15 to 20 inches, and Bridgestone Americas, Inc. launched UltraWeather in June 2026 with an eventual 61 sizes from 16 to 22 inches. Both carry a 60,000-mile limited warranty and the Three-Peak Mountain Snowflake (3PMSF) marking, targeting year-round replacement spend in snowbelt states.
- Retail and service consolidation. Mavis Tire Express Services Corp. passed 4,400 locations after completing the USD 700 million Pep Boys acquisition in August 2026, and Big Brand Tire & Service, owned by Percheron Capital, will operate more than 530 locations after acquiring Belle Tire. National dealers already receive 41% of passenger and 46% of light truck replacement shipments in 2025.
- Localized premium manufacturing. Pirelli & C. S.p.A. announced a USD 1.2 billion expansion of its Rome, Georgia plant in September 2026, adding 1,000 jobs and reaching full operations in 2033. High Value products generate 79% of Pirelli revenue, and local production of these large-rim tires reduces tariff exposure in the premium segment.
- Size proliferation in passenger tires. Recognized passenger tire dimensions rose from 394 in 2025 to 411 in 2026, including 46 sizes at 20 inches and 16 at 22 inches. The ten largest passenger replacement sizes account for only 28.6% of 2025 shipments, against 56.6% for light truck tires, which increases inventory depth requirements for dealers and favors distributors with broad size coverage.
Market Segmentation
Passenger tires account for USD 38.29 billion, or 66.37% of the US replacement tire market, in 2025 and are projected to reach USD 43.85 billion by 2030 at a 2.75% CAGR. Shipments of 221.9 million units in 2025 dip to 218.3 million in 2026 before rising to an estimated 223.27 million in 2030, in line with light-vehicle parc growth of 0.56% a year. Demand is spread across a wide size range, with 225/65R17 leading at 6.0% of passenger replacement shipments, an estimated 13.31 million tires worth about USD 2.30 billion, followed by 205/55R16, 215/55R17 and 235/60R18 at 3.3% each, and the ten largest sizes together account for 28.6% of the segment. Passenger value rises to an estimated USD 38.64 billion in 2026 despite lower units, as the 2.57% producer price increase offsets the 1.6% decline in shipments.
Truck and bus tires account for USD 10.02 billion, or 17.37% of 2025 value, from only 8.69% of replacement units, and are projected to reach USD 11.31 billion by 2030 at a 2.45% CAGR. The segment is the most concentrated by size, as 295/75R22.5 accounts for 30.1% of truck replacement shipments and 11R22.5 for 22.5%, an estimated 7.43 million and 5.56 million tires respectively in 2025. Fleet replacement demand contracts in 2026, with shipments falling 7.1% to 22.9 million units, and the medium and heavy parc of 9.834 million vehicles supports a return to 24.59 million units by 2030. Truck and bus value eases to an estimated USD 9.49 billion in 2026, making it the only tire class to lose value in the year, as fleets defer replacement and extend casing life through retreading.
Light truck tires account for USD 9.38 billion, or 16.26% of 2025 value, and are the fastest-growing class at a 4.52% CAGR, reaching USD 11.70 billion and 17.50% of the market by 2030. Shipments of 37.7 million units in 2025 are projected to reach an estimated 41.46 million in 2030, supported by a light truck parc growing at 2.82% a year. LT275/70R18 leads with 8.8% of segment shipments, an estimated 3.32 million tires, followed by LT265/70R17 at 7.8%, LT225/75R16 at 6.5% and LT245/75R16 at 6.4%, with the ten largest sizes accounting for 56.6% of the segment. Light truck value reaches an estimated USD 9.44 billion in 2026, and the commercial-van size 235/65R16C, at 5.3% of segment shipments, links the class to growth in last-mile delivery fleets.
National dealers, defined as networks with more than 40 outlets across three or more regions, account for USD 20.17 billion, or 34.95% of 2025 market value, and are projected to reach USD 23.54 billion by 2030 at a 3.14% CAGR. The channel receives 41% of passenger and 46% of light truck replacement shipments, an estimated 109.24 million tires in 2025. Acquisitions by Mavis Tire Express Services Corp. and Big Brand Tire & Service enlarge this channel through 2026.
The commercial truck and bus channel, comprising commercial tire dealers, fleet service networks and truck stops, accounts for USD 10.02 billion, or 17.37% of 2025 value, and reaches USD 11.31 billion by 2030 at a 2.45% CAGR. Southern Tire Mart, LLC reported USD 3.33 billion of commercial sales in 2025, and the channel concentrates on 295/75R22.5 and 11R22.5 fitments for long-haul and regional fleets.
Local independent dealers account for USD 9.79 billion, or 16.97% of 2025 value, and are projected to reach USD 11.46 billion by 2030 at a 3.20% CAGR. The channel receives 19% of passenger and 26% of light truck replacement shipments, an estimated 52.39 million tires, and its higher light truck weighting reflects strong positions in rural and pickup-heavy markets.
Regional dealers with 10 to 40 outlets across two or more regions account for USD 8.45 billion, or 14.65% of 2025 value, rising to USD 9.87 billion by 2030 at a 3.16% CAGR. The channel receives 17% of passenger and 20% of light truck shipments, an estimated 45.64 million tires in 2025, and remains the primary acquisition pool for national consolidators.
General merchandise retailers, including warehouse clubs and mass merchants, account for USD 4.44 billion, or 7.70% of 2025 value, and are projected to reach USD 5.11 billion by 2030 at a 2.85% CAGR. The channel receives 11% of passenger shipments and only 2% of light truck shipments, reflecting a focus on high-volume passenger sizes such as 225/65R17 and 205/55R16.
Other recipients, a residual class covering shipments outside the dealer, merchandise and tire-maker channels, account for USD 3.38 billion, or 5.86% of 2025 value, rising to USD 3.89 billion by 2030 at a 2.85% CAGR. The class receives 8% of passenger and 3% of light truck replacement shipments, an estimated 19.06 million tires in 2025.
Tire-maker owned outlets account for USD 1.44 billion, or 2.50% of 2025 value, and are projected to reach USD 1.68 billion by 2030 at a 3.13% CAGR. The channel receives 3% of passenger and light truck replacement shipments, an estimated 7.86 million tires, through manufacturer retail networks such as the Firestone Complete Auto Care stores operated by Bridgestone Retail Operations, LLC.
By Geography
North Central
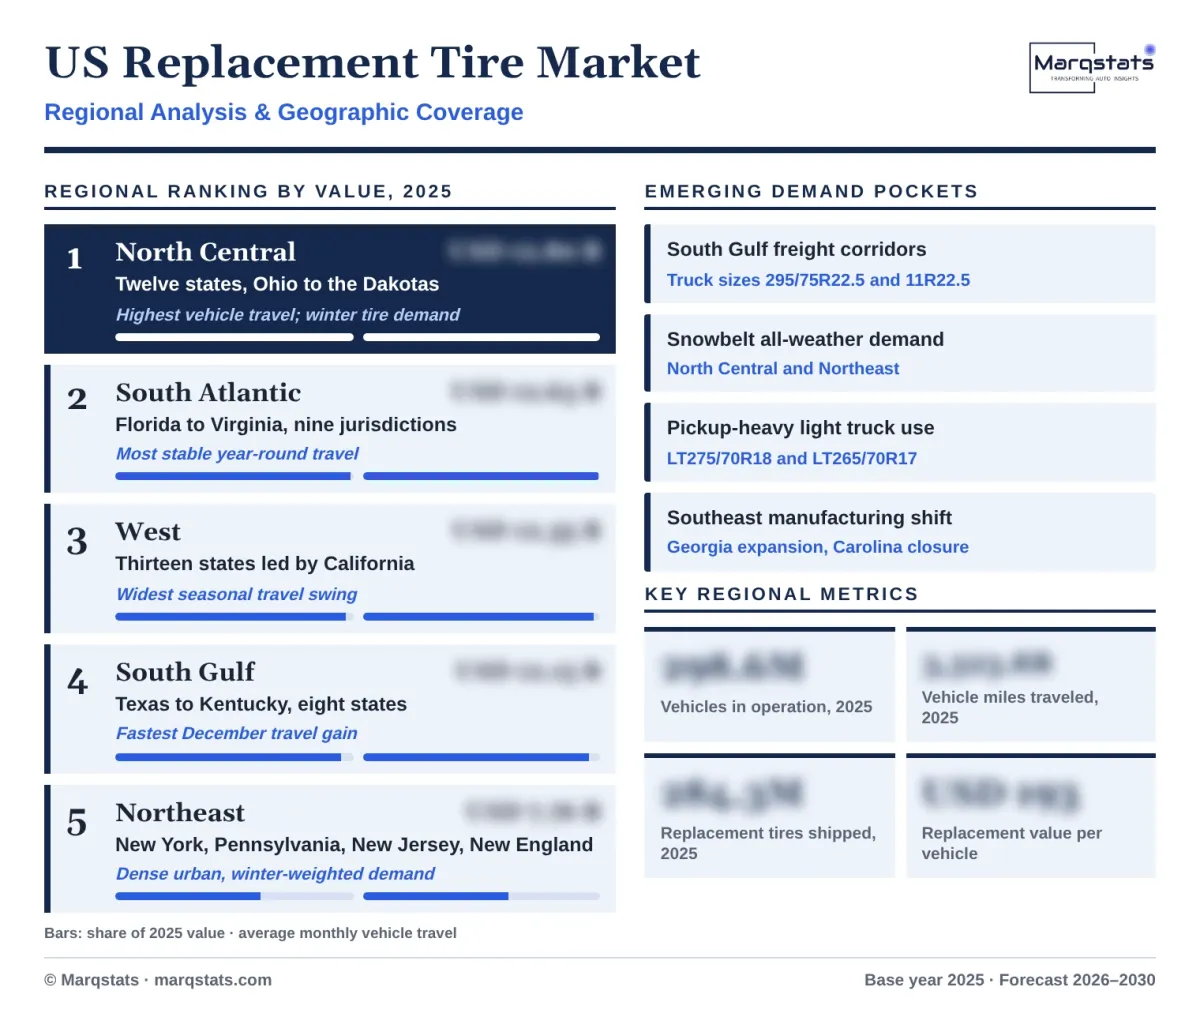
The North Central region is the largest regional market, accounting for 22.16% of 2025 value, or USD 12.80 billion, across twelve states from Ohio and Michigan to Kansas and the Dakotas. Average monthly vehicle travel of 63.53 billion miles in the sampled 2025 months is the highest of the five FHWA regions, and December travel fell 12.5% below the August level, which concentrates demand for winter and all-weather tires such as the Continental SecureContact AW. Big Brand Tire & Service enters the region through its acquisition of Belle Tire, which operates in Michigan, Ohio, Indiana and Illinois.
South Atlantic
The South Atlantic region accounts for 21.90% of 2025 value, or USD 12.63 billion, across Florida, Georgia, the Carolinas, Virginia, Maryland, Delaware, West Virginia and the District of Columbia. Travel is the most stable across seasons, with December 2025 only 3.7% below October, which supports steady year-round passenger replacement. The region hosts the Pirelli plant in Rome, Georgia, and the Goodyear plant in Fayetteville, North Carolina, which is scheduled to close by the end of 2027.
West
The West region accounts for 21.41% of 2025 value, or USD 12.35 billion, across thirteen states led by California, Washington, Arizona and Colorado. Average monthly travel of 61.36 billion miles includes a 16.6% swing between July and December 2025, the widest seasonal range of any region, which raises demand for all-season and all-terrain light truck sizes such as LT265/70R17. Big Brand Tire & Service, headquartered in Moorpark, California, operates its dealer network from the region.
South Gulf
The South Gulf region accounts for 21.07% of 2025 value, or USD 12.15 billion, across Texas, Oklahoma, Louisiana, Arkansas, Mississippi, Alabama, Tennessee and Kentucky. December 2025 travel of 57.615 billion miles rose 1.5% year on year, the fastest December gain of the five regions, supported by pickup-heavy light vehicle use and long-haul freight corridors. The region carries strong demand for LT275/70R18 and the 295/75R22.5 truck size used on regional and long-haul tractors.
Northeast
The Northeast region accounts for 13.46% of 2025 value, or USD 7.76 billion, across New York, Pennsylvania, New Jersey and the six New England states. Average monthly travel of 38.57 billion miles is the lowest of the five regions, and December 2025 travel was 1.0% below December 2024 and 16.2% below the July level. Dense urban driving and winter conditions favor passenger sizes such as 205/55R16 and 225/65R17, which raises the share of winter replacement in the region.
How Competition Is Evolving
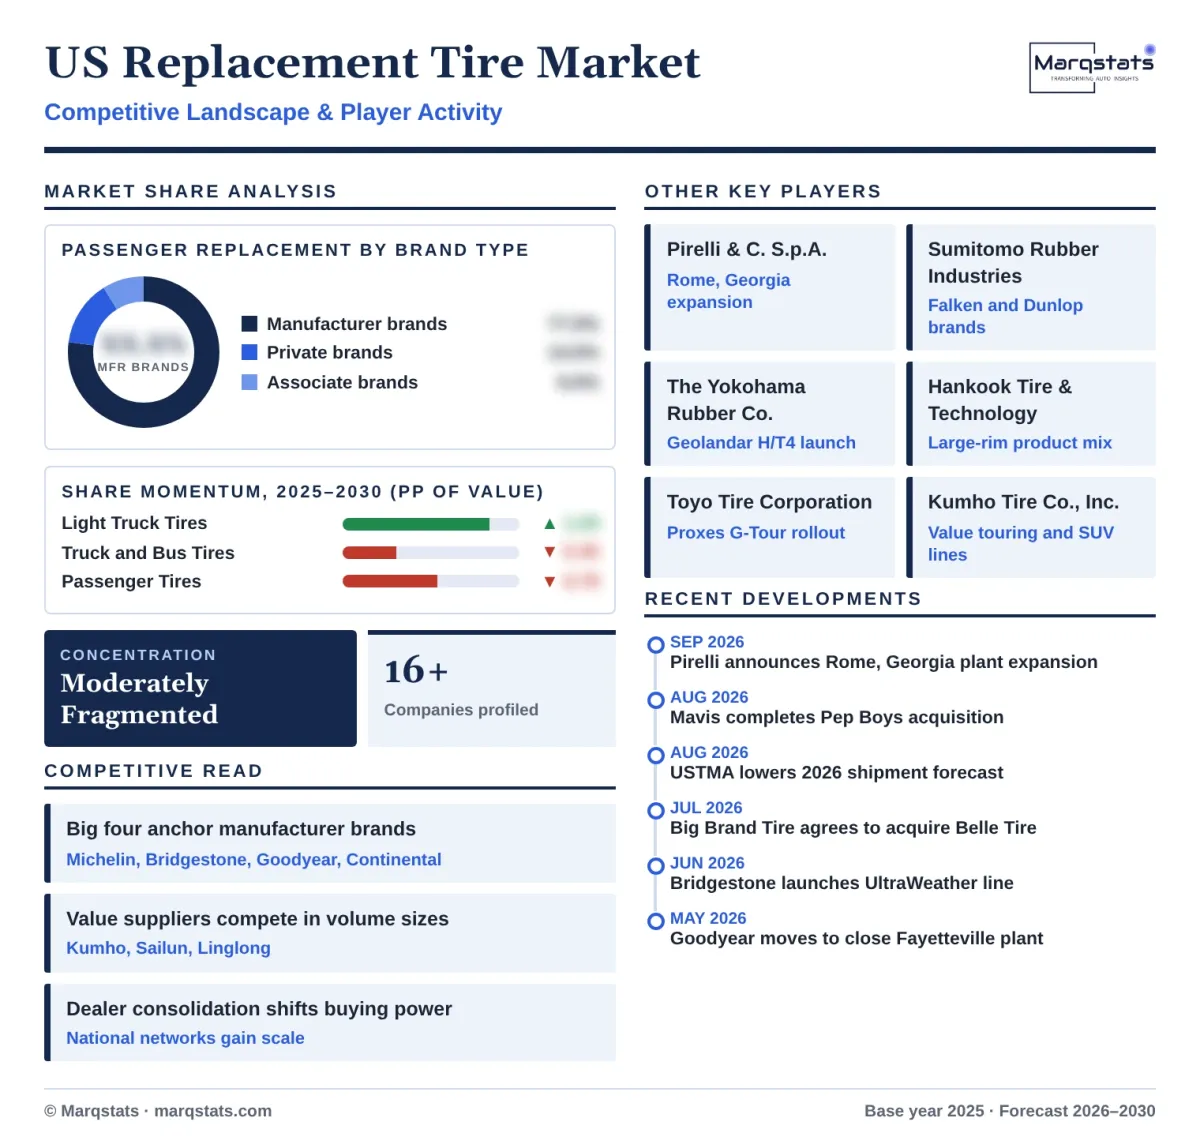
The US replacement tire market is moderately fragmented at the brand level and concentrated at the manufacturing level. Compagnie Générale des Établissements Michelin SCA, Bridgestone Corporation, The Goodyear Tire & Rubber Company and Continental AG are the four largest global suppliers, with estimated 2025 tire revenue of USD 24.10 billion, USD 19.63 billion, USD 16.90 billion and USD 15.60 billion respectively. Manufacturer brands account for 77% of passenger and 82% of light truck replacement shipments in 2025, while associate brands hold 9% and 6% and private brands hold 14% and 12%.
Competition centers on size coverage, product refresh and dealer access. Bridgestone launched UltraWeather in June 2026 with an eventual 61 sizes, Yokohama Tire Corporation introduced the Geolandar H/T4 in April 2026 in 62 sizes from 15 to 22 inches, and Toyo Tire U.S.A. Corp. began a staged launch of the Proxes G-Tour in September 2026 with more than 70 size, load and speed combinations. Asian value suppliers such as Kumho Tire Co., Inc., Sailun Group Co., Ltd. and Shandong Linglong Tyre Co., Ltd. compete on price in high-volume sizes, and the 25% Section 232 duty from May 2025 raises the landed cost of imported product. Premium suppliers compete on large-rim mix, as tires of 18 inches and above accounted for 68% of MICHELIN-brand passenger tire sales, 62% of Continental-brand passenger car tire sales and 47.8% of Hankook passenger and light truck tire sales worldwide in 2025.
Ownership of the retail channel is consolidating through acquisitions. Mavis Tire Express Services Corp. completed the USD 700 million Pep Boys acquisition in August 2026, Monomoy Capital Partners closed its USD 1.3 billion purchase of Jiffy Lube International in July 2026, and Big Brand Tire & Service agreed to acquire Belle Tire in July 2026, reaching more than USD 1.5 billion in revenue. On the supply side, Pirelli committed USD 1.2 billion to its Georgia plant and Goodyear is closing its Fayetteville plant, which shifts domestic capacity toward premium and large-rim products.
Companies Covered
Companies covered in the report include:
Recent Market Activity
Table of Contents
Coverage & Segmentation
The US replacement tire market comprises new pneumatic passenger, light truck and truck and bus tires sold in the United States to replace tires on vehicles in service, valued at retail in US dollars. The market excludes original equipment fitments, retreaded tires, off-the-road, agricultural and specialty tires, and installation, disposal and other service revenue. Coverage uses a 2025 base year, a 2021–2025 historical period and a 2026–2030 forecast period, with 2026 as the estimated year. The Marqstats United States Used Car Market report covers the used vehicle parc that drives a large share of replacement events, and the End-of-Life Tire Market report covers the scrap tires that each replacement generates.
Segmentation covers three tire classes, seven distribution channels and five regions defined by the FHWA Traffic Volume Trends series, with 16 manufacturers profiled. Unit shipments are the primary series, the market value is a Marqstats estimate, and value is derived from unit volume and average replacement value per tire by class, with leading size codes tracked within each class. Fleet tire maintenance is covered in the Marqstats Fleet Tire Management Software Market report.