Market Snapshot
Middle bar: base-year value × (1 + CAGR), rounded to two decimals. This is a calculated illustration, not a separately researched annual estimate.
The US SUV and light truck replacement tire market is valued at USD 32.29 billion in 2025 and is projected to reach USD 41.70 billion by 2030, registering a CAGR of 5.25% over 2026–2030. The market covers every replacement tire fitted to crossovers, SUVs, pickups and light commercial vans, whether passenger-rated or LT-metric, across a light truck parc of 189.616 million vehicles. Passenger-rated tires lead with 70.95% of 2025 value, while the light truck share of the light-vehicle parc rises from 65.67% in 2025 to an estimated 73.36% in 2030.
Market size and forecast figures are generated using Marqstats' proprietary estimation framework, updated as of October 2026.
Coverage spans two tire constructions, seven distribution channels and four US Census regions, from the South to the Northeast. Demand is sized by vehicle application rather than by tire category, and the analysis tracks the leading replacement size codes, from LT275/70R18 and LT265/70R17 in pickups to 235/65R16C in delivery vans and 275/60R20 in full-size SUVs.
Key Takeaways
Market Overview & Analysis
Report Summary
The US SUV and light truck replacement tire market comprises all replacement tires fitted to crossovers, SUVs, pickups and light commercial vans, valued at USD 32.29 billion in 2025. The market is defined by vehicle application, so it includes passenger-rated P-metric and Euro-metric tires as well as the LT-metric and commercial C-rated tires counted by the US Tire Manufacturers Association (USTMA) in its light truck category. Light trucks account for 189.616 million of the 288.727 million light vehicles in operation, or 65.67%, and Marqstats estimates that 170.49 million replacement tires were fitted to these vehicles in 2025, of which 37.7 million were LT-metric and an estimated 132.79 million were passenger-rated, rising to an estimated 194.21 million tires in 2030.
Demand is driven by the shift of the vehicle parc from cars to light trucks. The car parc fell from 115.674 million in 2020 to 99.111 million in 2025, while the light truck parc rose from 165.034 million to 189.616 million, a 2.82% annual rate. New sales sustain the shift, as Ford Motor Company sold 828,832 F-Series trucks in 2025, up 8.3%, and Toyota Motor North America sold 479,288 RAV4 crossovers. Each replacement event on a light truck carries a larger fitment, such as 275/60R20 on full-size SUVs or LT275/70R18 on heavy-duty pickups, so value grows faster than the overall US tire market.
Trade policy and producer prices set the pricing frame for 2026–2030. The Section 232 tariff on automobile parts applied a 25% duty to imported tires from 3 May 2025, and the US Bureau of Labor Statistics (BLS) Producer Price Index for tires averaged 195.76 in January to August 2026, 2.20% above its 2025 average. The USTMA July 2026 forecast projects LT-metric replacement shipments of 37.1 million units in 2026, down 1.6%, however the growing light truck parc lifts total light truck replacement demand to an estimated 171.48 million tires in 2026.
Supply is led by global manufacturers refreshing highway, all-terrain and crossover touring ranges. Kumho Tire U.S.A., Inc. launched the Road Venture HT in May 2026 and the Crugen GT Pro in 85 sizes in September 2026, Yokohama Tire Corporation introduced the Geolandar H/T4 in 62 US sizes in April 2026, and Continental Tire the Americas, LLC debuted the TerrainContact A/T2 in July 2026. The full US replacement market, of which this segment forms 55.97%, is covered in the Marqstats US Replacement Tire Market analysis.
Market Dynamics
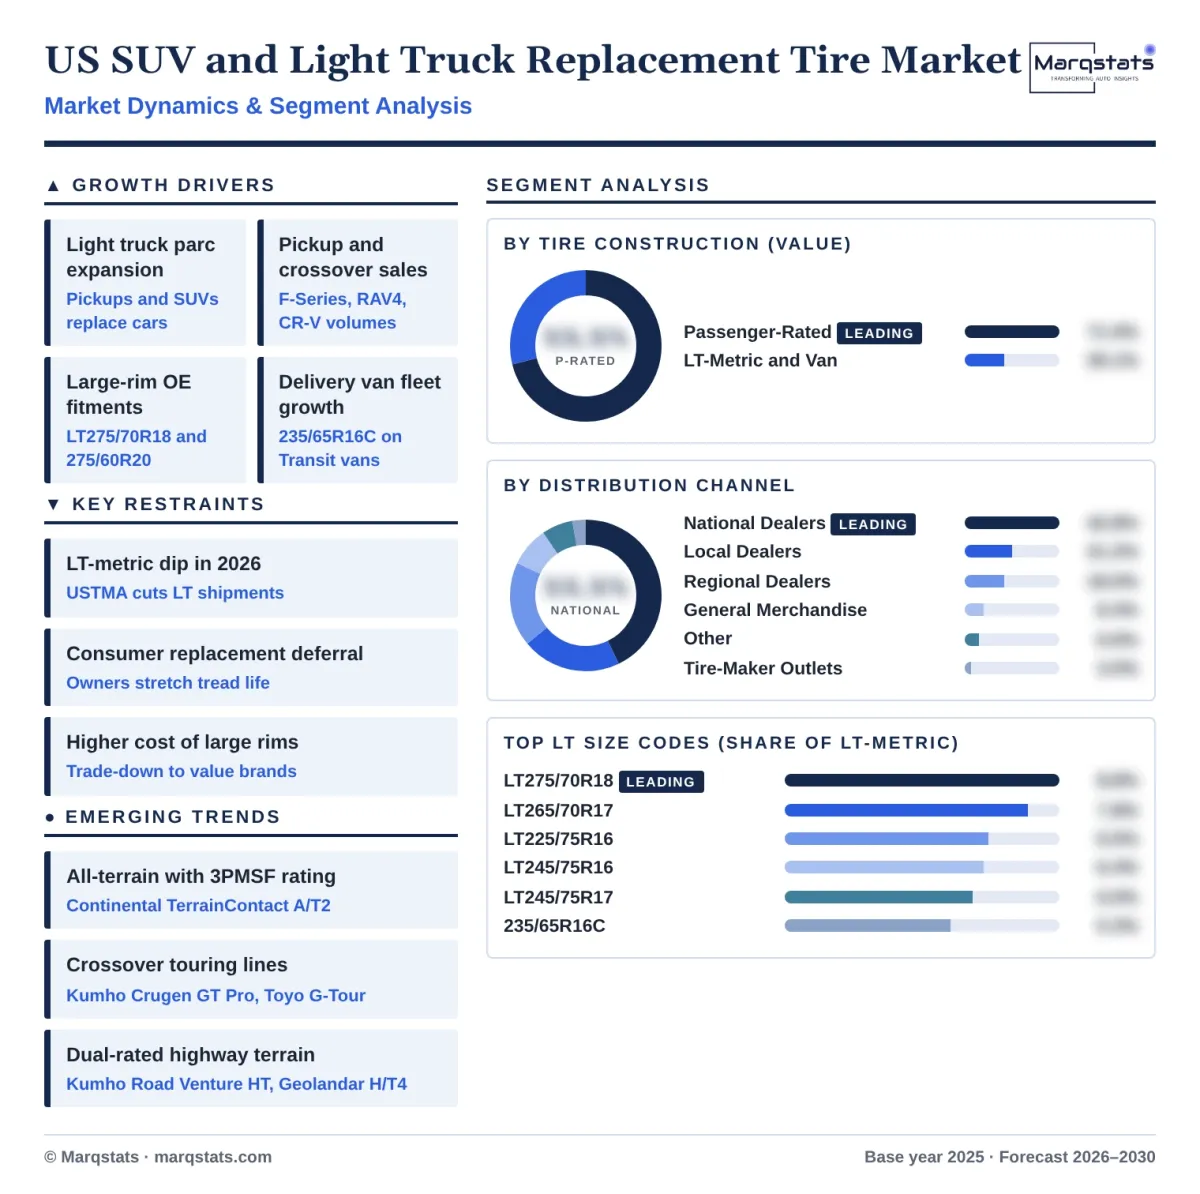
Key Drivers
Five conditions lift SUV and light truck replacement demand faster than the overall US tire market.
- Light truck parc expansion. The light truck parc reached 189.616 million vehicles in 2025, up from 165.034 million in 2020, and Marqstats projects it to reach 217.86 million by 2030. Each additional light truck adds an estimated 0.9 replacement tires a year to demand, the same flow rate observed across the light-vehicle parc in 2025. Passenger-rated tires make up 77.89% of light truck replacement units in 2025 and an estimated 78.65% in 2030.
- Pickup and crossover sales strength. Ford Motor Company sold 828,832 F-Series trucks in 2025, up 8.3%, along with 155,051 Maverick pickups and 222,706 Explorer SUVs. Toyota RAV4 sales of 479,288 units and Honda CR-V sales of 403,768 units add to the crossover pool that enters the replacement market as these vehicles age. The 2025 sales mix confirms that pickups and crossovers, not sedans, set the replacement pipeline for the next decade.
- Large-rim original equipment fitments. Original equipment sizes pass to the replacement market as vehicles age, and LT275/70R18 accounts for 14.5% of 2025 LT original equipment fitments against 8.8% of LT replacement. In passenger-rated sizes, 275/60R20 leads original equipment at 7.8%, which lifts the average value of future replacement events on full-size pickups and SUVs. Upsizing raises the value of each replacement event even where unit demand is flat.
- Delivery van fleet growth. Ford sold a record 161,797 Transit vans in 2025, up 5.9%, and the commercial-van size 235/65R16C accounts for 13.3% of LT original equipment fitments. Replacement share for the size stands at 5.3%, so the van parc built in 2023–2025 generates rising replacement demand through 2030 as delivery fleets accumulate high annual mileage. Van replacement demand concentrates in national dealer and fleet service channels that hold commercial C-rated inventory.
- Price support from tariffs. The 25% Section 232 duty on imported tires from May 2025 and higher producer prices lift replacement prices across the forecast period. Marqstats projects the average value of an LT-metric replacement tire to rise from an estimated USD 248.87 in 2025 to USD 282.24 in 2030, while passenger-rated tires rise from USD 172.56 to USD 196.41. Price growth accounts for nearly half of value growth in the segment through 2030, with units rising at 2.64% a year.
Key Restraints
Four constraints limit volume growth and pricing in SUV and light truck replacement through 2030.
- LT-metric shipment decline in 2026. The USTMA July 2026 forecast, published on 6 August 2026, projects LT-metric replacement shipments of 37.1 million units, down 1.6% from 37.7 million in 2025. LT-metric value eases to an estimated USD 9.44 billion in 2026, and LT-metric units return to growth only from 2027 as pickup owners defer heavy-duty replacements. The 2026 dip removes an estimated 0.6 million LT-metric tires from national demand.
- Consumer replacement deferral. The Goodyear Tire & Rubber Company reported a 13% decline in Americas replacement unit volume in the second quarter of 2026, following a 23.2% fall in the first quarter. Households running crossovers and older pickups extend tread life when budgets tighten, which delays replacement events and shifts demand toward private-brand products. Deferral weighs most on older crossovers fitted with passenger-rated sizes such as 225/65R17.
- Higher replacement cost of large rims. An estimated average replacement value of USD 248.87 per LT-metric tire in 2025 places a four-tire replacement for a heavy-duty pickup near USD 1,000 before installation. Owners facing this outlay downtrade to value brands, and private brands already account for 12% of LT-metric and 14% of passenger-rated replacement shipments. Value-brand suppliers from Asia gain share in these sizes as owners trade down from premium brands.
- Fragmented size range. The ten largest LT-metric replacement sizes account for 56.6% of 2025 shipments, and recognized passenger tire dimensions rose from 394 in 2025 to 411 in 2026. The widening size range raises inventory costs for local dealers and limits availability of less common fitments such as LT285/70R17 and LT275/65R18 at 3.8% and 3.7% of segment shipments. Distributors with broad size coverage gain share from dealers that cannot stock every LT-metric fitment.
Key Trends
Four shifts are changing the product mix and the route to market for SUV and light truck replacement tires.
- All-terrain tires with severe-snow rating. Continental Tire the Americas, LLC debuted the TerrainContact A/T2 in July 2026 with the Three-Peak Mountain Snowflake (3PMSF) certification for crossover, SUV and light truck drivers. All-terrain products now compete on daily road comfort and winter capability, which widens their appeal beyond off-road users in snowbelt states.
- Crossover-specific touring lines. Kumho Tire U.S.A., Inc. launched the Crugen GT Pro in September 2026 in 85 sizes from 16 to 22 inches for larger crossovers and SUVs, and Toyo Tire U.S.A. Corp. began a staged launch of the Proxes G-Tour across CUV, SUV and passenger fitments. Suppliers now design touring tires around crossover weight and rim size.
- Dual-rated highway terrain ranges. Kumho announced the Road Venture HT in May 2026 in more than 40 sizes from 15 to 22 inches, with a 75,000-mile warranty on P-metric sizes and 50,000 miles on LT-metric sizes. Yokohama Tire Corporation offers the Geolandar H/T4 in 62 US sizes, with 70,000 miles on Euro-metric and 55,000 miles on LT-metric sizes.
- Retail consolidation around light truck service. Mavis Tire Express Services Corp. completed the USD 700 million Pep Boys acquisition in August 2026, passing 4,400 locations, and Big Brand Tire & Service agreed to acquire Belle Tire in July 2026. National dealers receive 46% of LT-metric and 41% of passenger replacement shipments, and their share of light truck value reaches 42.75% in 2025.
Market Segmentation
Passenger-rated P-metric and Euro-metric tires on crossovers, SUVs and pickups account for an estimated USD 22.91 billion, or 70.95% of 2025 value, and are projected to reach USD 30.00 billion by 2030 at a 5.54% CAGR. Units rise from an estimated 132.79 million in 2025 to 152.75 million in 2030, as the light truck share of the light-vehicle parc climbs to 73.36%. Leading sizes include 225/65R17 on compact crossovers, 235/60R18 at 3.3% of passenger replacement shipments, and 275/60R20 and 275/55R20 at 2.3% and 2.2% on full-size pickups and SUVs. Passenger-rated value rises to an estimated USD 23.78 billion in 2026, as light truck growth and a 2.57% producer price increase offset the 1.6% decline in national passenger shipments. Crossover touring lines such as the Kumho Crugen GT Pro, offered from 16 to 22 inches, target the upper end of this size range.
LT-metric and commercial C-rated tires account for USD 9.38 billion, or 29.05% of 2025 value, and are projected to reach USD 11.70 billion by 2030 at a 4.52% CAGR. Shipments of 37.7 million units in 2025 dip to 37.1 million in 2026 and rise to an estimated 41.46 million in 2030. LT275/70R18 leads at 8.8% of segment shipments, an estimated 3.32 million tires, followed by LT265/70R17 at 7.8%, LT225/75R16 at 6.5%, LT245/75R16 at 6.4%, LT245/75R17 at 6.0% and the van size 235/65R16C at 5.3%. The ten largest LT-metric sizes account for 56.6% of segment shipments, against 82.4% of LT original equipment, so replacement demand is spread across older fitments. Original equipment leaders such as LT285/70R17 at 10.8% and LT275/65R20 at 8.8% of fitments, against 3.8% and 4.5% of replacement, signal the next wave of replacement demand.
National dealers with more than 40 outlets across three or more regions account for USD 13.80 billion, or 42.75% of 2025 value, and are projected to reach USD 17.80 billion by 2030 at a 5.22% CAGR. The channel receives 46% of LT-metric and 41% of passenger replacement shipments, an estimated 72.34 million light truck tires in 2025, and gains scale through acquisitions by Mavis Tire Express Services Corp. and Big Brand Tire & Service. National dealers hold the deepest inventories of large-rim sizes such as LT275/70R18 and 275/60R20, which supports their 46% share of LT-metric shipments.
Local independent dealers account for USD 6.84 billion, or 21.18% of 2025 value, rising to USD 8.80 billion by 2030 at a 5.17% CAGR. The channel receives 26% of LT-metric shipments against 19% of passenger shipments, reflecting strong positions in rural and pickup-heavy markets where LT265/70R17 and LT245/75R16 fitments dominate. Local dealers draw 35.65% of their light truck value from LT-metric tires, the highest weighting of any dealer class, supported by strong pickup demand in rural counties.
Regional dealers with 10 to 40 outlets across two or more regions account for USD 5.81 billion, or 17.99% of 2025 value, and are projected to reach USD 7.49 billion by 2030 at a 5.21% CAGR. The channel receives 20% of LT-metric and 17% of passenger replacement shipments, an estimated 30.34 million light truck tires, and remains the main acquisition pool for national consolidators. Regional networks compete on same-day availability of LT-metric sizes, a service advantage that keeps them attractive to acquirers building national scale.
General merchandise retailers, including warehouse clubs and mass merchants, account for USD 2.73 billion, or 8.45% of 2025 value, rising to USD 3.57 billion by 2030 at a 5.51% CAGR. The channel receives 11% of passenger shipments and only 2% of LT-metric shipments, so its light truck business centers on passenger-rated crossover sizes such as 225/65R17. Warehouse clubs compete on price for high-volume crossover fitments, and their limited LT-metric range keeps them marginal in heavy-duty pickup replacement.
Other recipients, a residual class covering shipments outside the dealer, merchandise and tire-maker channels, account for USD 2.13 billion, or 6.60% of 2025 value, and are projected to reach USD 2.78 billion by 2030 at a 5.47% CAGR. The class receives 8% of passenger and 3% of LT-metric replacement shipments, an estimated 11.86 million light truck tires in 2025. The class grows slightly faster than the dealer channels as passenger-rated tires gain share of light truck value through 2030.
Tire-maker owned outlets account for USD 0.98 billion, or 3.03% of 2025 value, rising to USD 1.26 billion by 2030 at a 5.15% CAGR. The channel receives 3% of LT-metric and passenger replacement shipments, an estimated 5.15 million light truck tires, through manufacturer networks such as the Firestone Complete Auto Care stores operated by Bridgestone Retail Operations, LLC. Manufacturer-owned stores give suppliers direct access to light truck owners and a channel for launching new all-terrain and highway terrain ranges.
By Geography
South
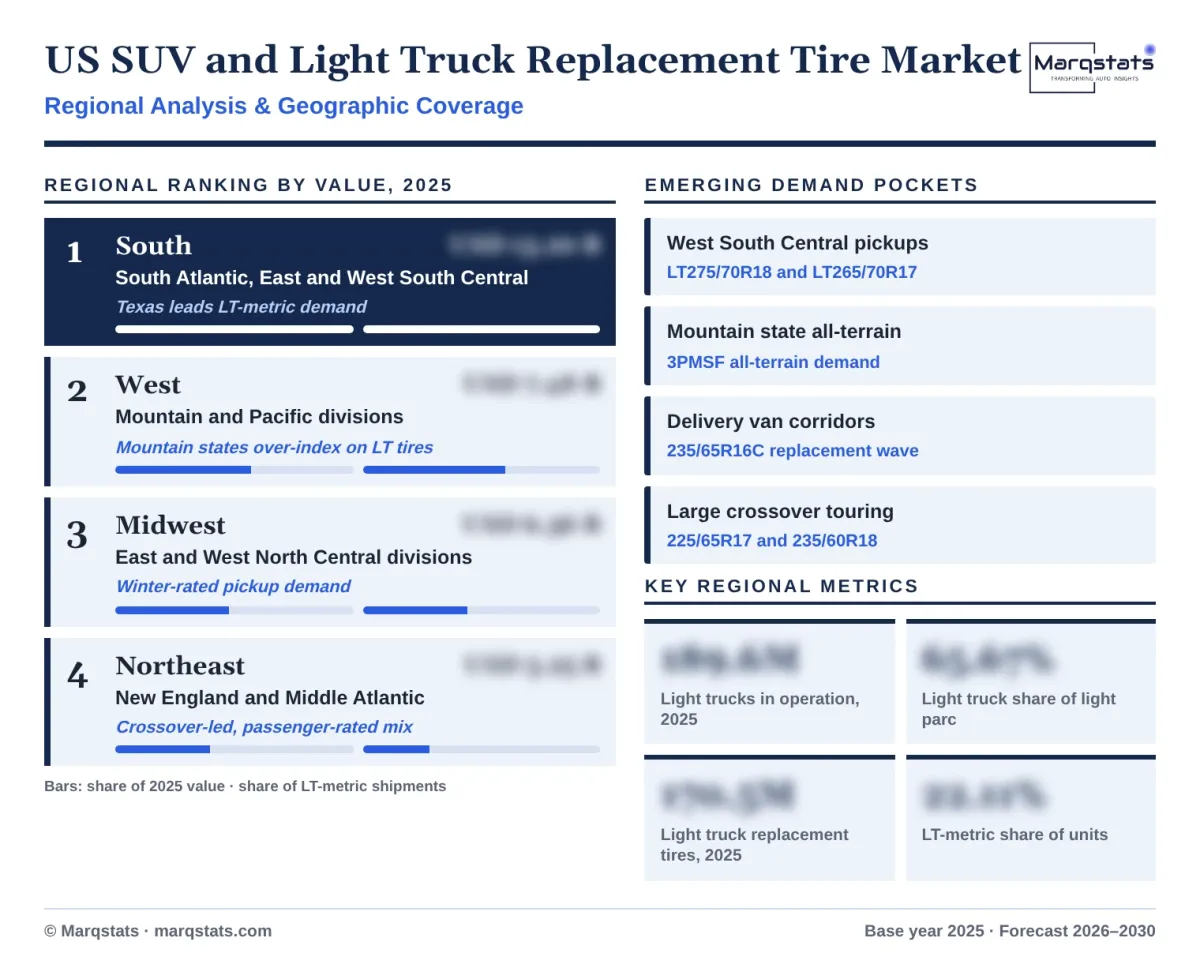
The South is the largest regional market, accounting for 40.87% of 2025 value, or USD 13.20 billion, across the South Atlantic, East South Central and West South Central divisions. The region receives 43% of national LT-metric replacement shipments and 40% of passenger shipments, and the West South Central division alone, led by Texas, takes 19% of LT-metric shipments on pickup-heavy light vehicle use across the state. An estimated 69.33 million light truck replacement tires were fitted in the region in 2025, more than twice the Northeast total.
West
The West accounts for 23.17% of 2025 value, or USD 7.48 billion, across the Mountain and Pacific divisions. The region receives 26% of LT-metric replacement shipments against 22% of passenger shipments, as the Mountain division takes 9% of LT-metric tires from only 5% of passenger tires, reflecting heavier pickup use in the mountain states that favors all-terrain products such as the Continental TerrainContact A/T2. The Pacific division takes 17% of both passenger and LT-metric replacement shipments, led by California, where crossover fitments dominate light truck demand.
Midwest
The Midwest accounts for 19.70% of 2025 value, or USD 6.36 billion, across the East North Central and West North Central divisions. The region receives 19% of LT-metric and 20% of passenger replacement shipments, and severe winters sustain demand for 3PMSF-rated all-terrain and highway terrain tires on pickups. Big Brand Tire & Service expands in the region through Belle Tire, which operates in Michigan, Ohio, Indiana and Illinois. An estimated 33.72 million light truck replacement tires were fitted in the region in 2025, with passenger-rated and LT-metric tires in close balance.
Northeast
The Northeast accounts for 16.26% of 2025 value, or USD 5.25 billion, across New England and the Middle Atlantic divisions. The region receives 18% of passenger replacement shipments and only 12% of LT-metric shipments, as dense urban driving favors crossovers on passenger-rated sizes such as 225/65R17 and 235/60R18 over heavy-duty pickups. An estimated 28.43 million light truck replacement tires were fitted in the region in 2025, with winter and all-weather fitments accounting for a larger share of demand than in the South.
How Competition Is Evolving
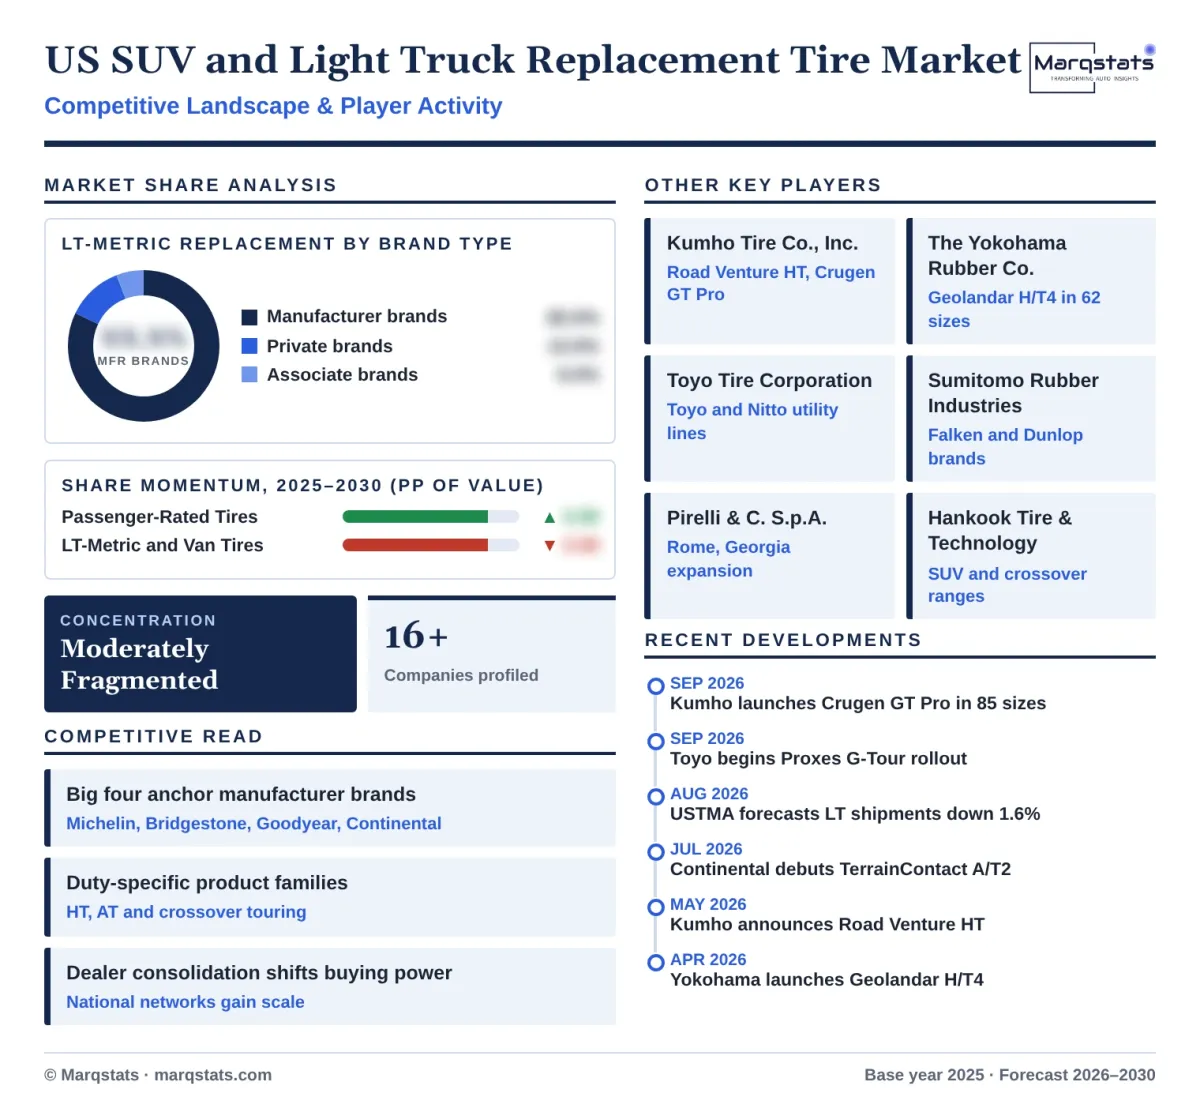
The US SUV and light truck replacement tire market is moderately fragmented at the brand level and concentrated at the manufacturing level. Compagnie Générale des Établissements Michelin SCA, Bridgestone Corporation, The Goodyear Tire & Rubber Company and Continental AG are the four largest global suppliers, with estimated 2025 tire revenue of USD 24.10 billion, USD 19.63 billion, USD 16.90 billion and USD 15.60 billion respectively. Manufacturer brands account for 82% of LT-metric and 77% of passenger replacement shipments in 2025, while private brands hold 12% and 14%.
Competition centers on duty-specific product families and size coverage. Highway terrain ranges such as the Kumho Road Venture HT and Yokohama Geolandar H/T4 serve daily-driven pickups, all-terrain lines such as the Continental TerrainContact A/T2 add severe-snow capability, and crossover touring lines such as the Kumho Crugen GT Pro and Toyo Proxes G-Tour target large-rim CUVs and SUVs. Toyo Tire Corporation, which sells the Toyo and Nitto brands, holds an enthusiast and utility position in pickup and off-road sizes. Asian value suppliers such as Kumho Tire Co., Inc., Sailun Group Co., Ltd. and Shandong Linglong Tyre Co., Ltd. compete on price in high-volume pickup and crossover sizes, and the 25% Section 232 duty from May 2025 raises the landed cost of imported product.
Ownership of the retail channel is consolidating, which raises the purchasing power of national dealers over light truck assortments. Mavis Tire Express Services Corp. completed the USD 700 million Pep Boys acquisition in August 2026, Big Brand Tire & Service agreed to acquire Belle Tire in July 2026, reaching more than USD 1.5 billion in revenue, and Pirelli & C. S.p.A. announced a USD 1.2 billion expansion of its Rome, Georgia plant in September 2026 to localize premium production.
Companies Covered
Companies covered in the report include:
Recent Market Activity
Table of Contents
Coverage & Segmentation
The US SUV and light truck replacement tire market comprises new passenger-rated, LT-metric and commercial C-rated replacement tires fitted to crossovers, SUVs, pickups and light commercial vans in the United States, valued at retail in US dollars. The market excludes tires on passenger cars, original equipment fitments, retreads, medium and heavy truck tires, and installation and service revenue. Coverage uses a 2025 base year, a 2021–2025 historical period and a 2026–2030 forecast period, with 2026 as the estimated year. The parent market is covered in the Marqstats US Replacement Tire Market report, and the used vehicle parc behind most replacement events is covered in the United States Used Car Market report.
Segmentation covers two tire constructions, seven distribution channels and four US Census regions, with 16 manufacturers profiled. Demand is sized by vehicle application, the market value is a Marqstats estimate, and value is derived from replacement units and average value per tire by construction, with leading size codes tracked within each construction. Truck fleet tire upkeep is covered in the Marqstats Fleet Tire Management Software Market report.