Market Snapshot
Middle bar: base-year value × (1 + CAGR), rounded to two decimals. This is a calculated illustration, not a separately researched annual estimate.
The US high-performance tire market is valued at USD 21.71 billion in 2025 and is projected to reach USD 26.40 billion by 2030, registering a CAGR of 3.99% over 2026–2030. The market covers H, V and Z speed-rated passenger replacement tires, which accounted for 125.8 million units, or 56.69% of US passenger replacement shipments, in 2025. H-rated tires lead with 47.54% of value, and the performance share of passenger replacement rises to an estimated 60.19% by 2030 as original equipment fitments rated H and above move into the replacement pool.
Market size and forecast figures are generated using Marqstats' proprietary estimation framework, updated as of October 2026.
Coverage spans three speed ratings, six distribution channels and four US Census regions, from the South to the Northeast. The analysis tracks the large-rim fitments that carry performance demand, from 235/55R19 and 255/45R19 on premium crossovers to 275/60R20 and 275/50R22 on full-size SUVs and pickups.
Key Takeaways
Market Overview & Analysis
Report Summary
The US high-performance tire market comprises H, V and Z speed-rated passenger replacement tires, valued at USD 21.71 billion in 2025. Speed ratings define the market because they are recorded on every tire sidewall and reported in the US Tire Manufacturers Association (USTMA) member data compiled in the Tire Business 2026 Market Data Book. Replacement shipments in 2025 comprised 59.8 million H-rated, 43.4 million V-rated and 22.6 million Z-rated tires, a total of 125.8 million units against 221.9 million passenger replacement shipments. The market forms 56.70% of US passenger replacement value and is sized at the passenger replacement average value per tire of an estimated USD 172.56 in 2025.
Demand is driven by the migration of performance-rated original equipment into the replacement pool. H, V and Z-rated tires account for 26.3 million of the 41.3 million passenger original equipment tires shipped in 2025, or 63.68%, against 56.69% of replacement shipments, and the gap of 6.99 percentage points equals 15.51 million tires a year at 2025 replacement volume. Large-rim fitments carry the shift, as recognized passenger tire dimensions of 20 inches and above rose from 71 in 2025 to 82 in 2026, and 18-inch-plus dimensions from 174 to 189, or 46.0% of all 411 recognized dimensions.
Trade policy and producer prices set the pricing frame for 2026–2030. The Section 232 tariff on automobile parts applied a 25% duty to imported tires from 3 May 2025, and the US Bureau of Labor Statistics (BLS) Producer Price Index for passenger car pneumatic tires averaged 202.94 in January to June 2026, 2.57% above its 2025 average of 197.85. Performance shipments ease to an estimated 125.28 million units in 2026 as the USTMA forecasts a 1.6% fall in passenger replacement, however market value rises to an estimated USD 22.17 billion on higher prices, and shipments reach an estimated 134.38 million units by 2030.
Supply is led by premium manufacturers with original equipment homologation programs and large-rim catalogs. Pirelli & C. S.p.A. launched the fifth-generation P Zero across 18 to 23 inches and announced a USD 1.2 billion expansion of its Rome, Georgia plant in September 2026, while Bridgestone Americas, Inc. launched the Firestone Firehawk Indy 500 V2 in 65 sizes from 16 to 20 inches in January 2026. The full US replacement market, of which this segment forms 37.63%, is covered in the Marqstats US Replacement Tire Market analysis.
Market Dynamics
Key Drivers
Five conditions lift performance tire demand faster than the overall passenger replacement market.
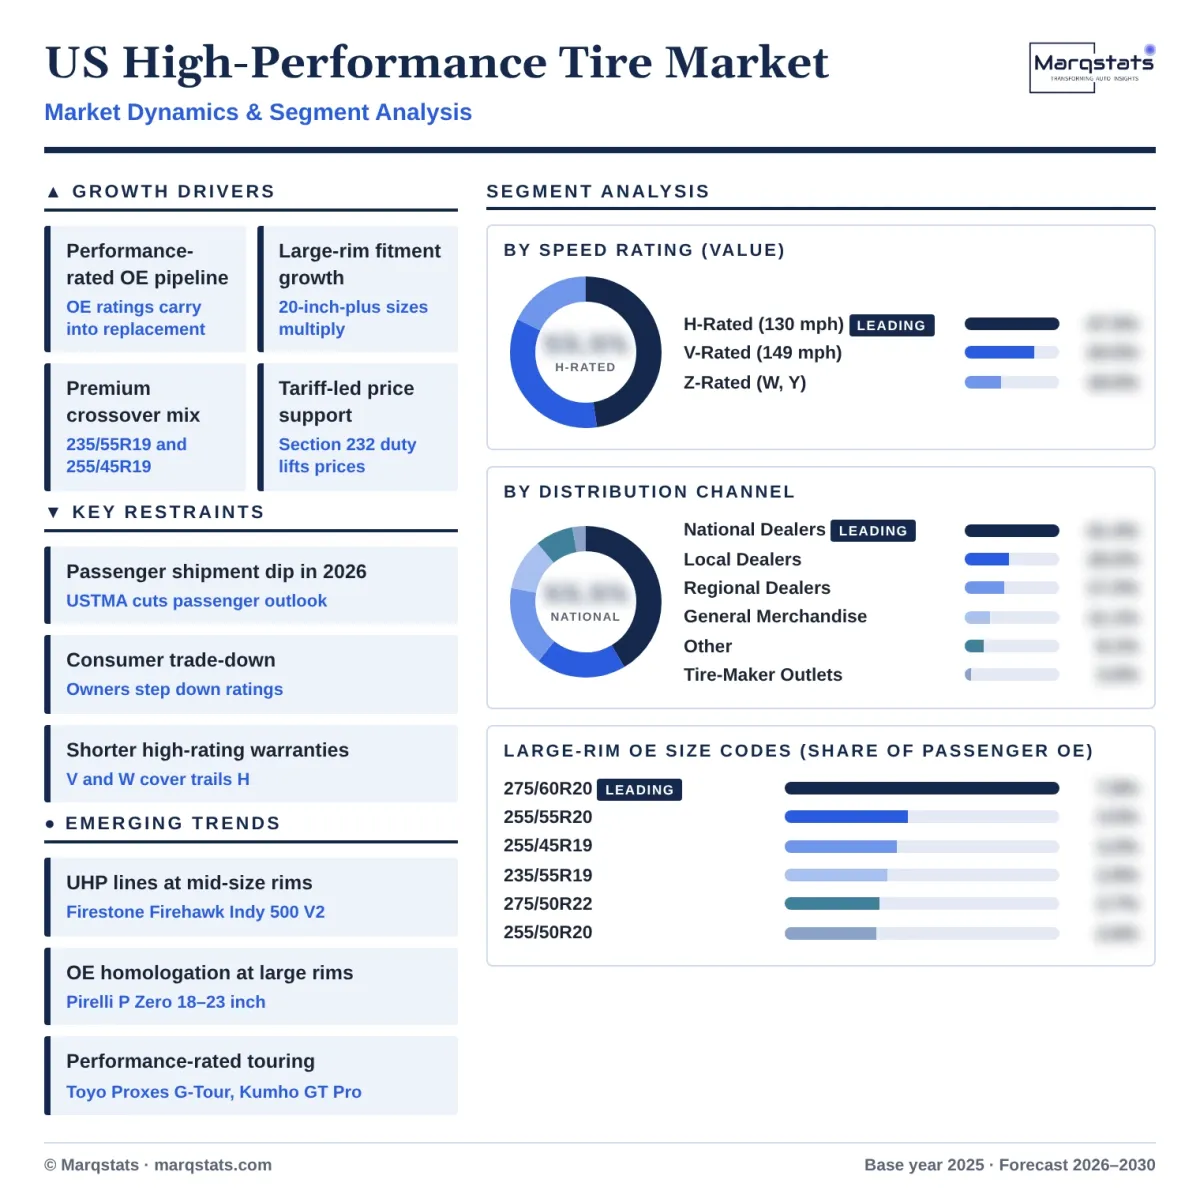
- Performance-rated original equipment pipeline. H, V and Z-rated tires account for 63.68% of 2025 passenger original equipment fitments against 56.69% of replacement shipments. Original equipment ratings carry into replacement as owners match the rating on the placard, and Marqstats projects the performance share of passenger replacement to rise to 60.19% by 2030. At 2025 replacement volume, closing the full gap to the original equipment mix would add 15.51 million performance tires a year.
- Large-rim fitment growth. Recognized passenger tire dimensions of 20 inches and above rose from 71 in 2025 to 82 in 2026, including 46 sizes at 20 inches and 16 at 22 inches. Original equipment leaders such as 275/60R20 at 7.8%, 255/55R20 at 3.5% and 275/50R22 at 2.7% of 2025 fitments carry H or higher ratings into the replacement market. The count of recognized 20-inch-plus dimensions has risen by 11 in a single year, the fastest addition of any rim band.
- Premium crossover and SUV mix. Light trucks account for 65.67% of the 288.727 million light vehicles in operation in 2025, and premium crossovers run performance-rated fitments such as 235/55R19 and 255/45R19 at 2.9% and 3.2% of passenger original equipment. The shift toward heavier, faster crossovers raises the speed and load ratings required on replacement tires. These crossover fitments are commonly specified with H or V ratings on the original equipment placard, which carries the rating into replacement.
- Manufacturer premiumization strategies. Tires of 18 inches and above accounted for 68% of MICHELIN-brand passenger tire sales and 62% of Continental-brand passenger car tire sales in 2025, and Hankook Tire & Technology Co., Ltd. reported 18-inch-plus tires at 49.5% of its passenger and light truck sales in the second quarter of 2026. Global suppliers allocate capacity and marketing to performance fitments, which lifts availability in the US. Global premium mix targets translate into broader US catalogs at 19, 20 and 22 inches through 2030.
- Price support from tariffs. The 25% Section 232 duty on imported tires from May 2025 and higher producer prices lift replacement prices across the forecast period. Marqstats projects the average value of a performance replacement tire to rise from an estimated USD 172.56 in 2025 to USD 196.41 in 2030, a 2.62% annual increase. Price growth accounts for about two-thirds of value growth in the market through 2030, with units rising at 1.33% a year.
Key Restraints
Four constraints hold performance tire volume growth below the rate of value growth through 2030.
- Passenger shipment decline in 2026. The USTMA July 2026 forecast, published on 6 August 2026, projects passenger replacement shipments of 218.3 million units, down 1.6% from 221.9 million in 2025. Performance shipments ease to an estimated 125.28 million units in 2026, and volume growth resumes only from 2027 as original equipment fitments age into replacement. Performance value still rises to an estimated USD 22.17 billion in 2026 as prices offset lower volume.
- Consumer trade-down. The Goodyear Tire & Rubber Company reported a 13% decline in Americas replacement unit volume in the second quarter of 2026, following a 23.2% fall in the first quarter. Private brands hold 14% of passenger replacement shipments, and price-sensitive owners of older vehicles step down to lower speed ratings or value brands when replacing performance fitments. Trade-down weighs most on V and Z-rated sizes, where the price gap to H-rated alternatives is widest.
- Shorter warranties at higher speed ratings. Toyo Tire U.S.A. Corp. offers a 65,000-mile warranty on T and H-rated Proxes G-Tour sizes against 55,000 miles on V and W-rated sizes, and Kumho Tire U.S.A., Inc. offers 75,000 miles on H and V-rated Crugen GT Pro sizes against 65,000 miles on W-rated sizes. Lower warranty cover raises the cost per mile of performance fitments for buyers. Shorter warranty cover on high-rated sizes also raises the replacement frequency that underpins Z-rated demand.
- Fragmented large-rim size range. Recognized passenger dimensions rose from 394 in 2025 to 411 in 2026, and the ten largest passenger replacement sizes account for only 28.6% of shipments. Large-rim performance sizes such as 275/50R22 and 255/50R20 fall outside the ten largest replacement sizes, which raises inventory costs and limits same-day availability at local dealers. Distributors with broad large-rim inventories gain share from dealers that cannot hold every staggered fitment.
Key Trends
Four shifts are changing how performance tires are engineered, rated and sold in the United States.
- Ultra-high-performance lines at mid-size rims. Bridgestone Americas, Inc. launched the Firestone Firehawk Indy 500 V2 in January 2026 in 65 sizes from 16 to 20 inches as the first Firestone ultra-high-performance summer tire with ENLITEN technology. Performance competition extends to mid-diameter fitments, so speed rating rather than rim size defines the category. The launch confirms that the ultra-high-performance segment spans 16 to 20 inches, well below the 22-inch fitments on luxury SUVs.
- Original equipment homologation at large rims. Pirelli & C. S.p.A. launched the fifth-generation P Zero in 18 to 23 inches with more than 50 products at launch, many developed with specific vehicle manufacturers. Homologated fitments lock in replacement demand for the approved product, which favors suppliers with deep original equipment relationships. Homologation marks on the sidewall steer replacement buyers back to the approved original equipment product.
- Grand touring tires with performance ratings. Toyo Tire U.S.A. Corp. began a staged launch of the Proxes G-Tour in September 2026 with more than 70 size, load and speed combinations across T, H, V and W ratings, and Kumho launched the Crugen GT Pro in 85 sizes from 16 to 22 inches. Touring products now carry performance ratings for crossovers and sedans. The blending of touring and performance ratings expands the H and V-rated pool beyond sports and luxury vehicles.
- Localized premium manufacturing. Pirelli announced a USD 1.2 billion expansion of its Rome, Georgia plant in September 2026, adding 1,000 jobs and reaching full operations in 2033. High Value products generate 79% of Pirelli revenue, and local production of large-rim performance tires reduces exposure to the 25% Section 232 duty on imports. The Georgia plant gives Pirelli local supply for the 18 to 23-inch P Zero range sold through US dealers.
Market Segmentation
H-rated tires, approved for sustained speeds up to 130 mph, account for USD 10.32 billion, or 47.54% of 2025 value, and are the fastest-growing rating at a 5.05% CAGR to USD 13.20 billion by 2030. Replacement shipments of 59.8 million units in 2025 rise to an estimated 67.20 million in 2030, as H-rated tires make up 52.47% of performance original equipment against 47.54% of performance replacement. The leading passenger replacement sizes, 225/65R17 and 235/60R18, are widely offered in H-rated touring and crossover versions. H-rated value rises to an estimated USD 10.65 billion in 2026, and the rating gains 2.46 percentage points of performance value by 2030.
V-rated tires, approved for speeds up to 149 mph, account for USD 7.49 billion, or 34.50% of 2025 value, and are projected to reach USD 8.87 billion by 2030 at a 3.44% CAGR. Replacement shipments of 43.4 million units in 2025 rise to an estimated 45.15 million in 2030, with V-rated tires making up 32.70% of performance original equipment. Large-rim crossover and SUV sizes such as 235/55R19 and 255/55R20, at 2.9% and 3.5% of passenger original equipment, add to V-rated demand as these vehicles age. V-rated value rises to an estimated USD 7.61 billion in 2026, while the rating loses 0.90 percentage points of performance value by 2030.
Z-rated tires, covering W and Y ratings above 149 mph, account for USD 3.90 billion, or 17.96% of 2025 value, and are projected to reach USD 4.33 billion by 2030 at a 2.11% CAGR. Replacement shipments of 22.6 million units in 2025 ease to an estimated 22.03 million in 2030, as Z-rated tires make up only 14.83% of performance original equipment. Sports and luxury fitments such as 255/45R19 and the Pirelli P Zero range wear faster and replace more often, which keeps Z-rated replacement above its original equipment share. Z-rated value holds at an estimated USD 3.91 billion in 2026, and the rating loses 1.56 percentage points of performance value by 2030.
National dealers account for USD 8.99 billion, or 41.42% of 2025 performance value, and are projected to reach USD 10.94 billion by 2030 at a 4.00% CAGR. The channel receives 41% of passenger replacement shipments, an estimated 52.10 million performance tires, and holds the broadest large-rim inventory among dealer classes. Consolidation through the Mavis acquisition of Pep Boys adds performance tire fitment capacity across nearly 800 additional locations.
Local independent dealers account for USD 4.17 billion, or 19.19% of 2025 value, rising to USD 5.07 billion by 2030 at a 3.99% CAGR. The channel receives 19% of passenger replacement shipments, an estimated 24.14 million performance tires, and competes on fitment service for staggered and low-profile sizes. Local dealers hold the second-largest channel share after national dealers, supported by fitment service for low-profile sizes such as 255/45R19.
Regional dealers account for USD 3.73 billion, or 17.17% of 2025 value, and are projected to reach USD 4.53 billion by 2030 at a 3.96% CAGR. The channel receives 17% of passenger shipments, an estimated 21.60 million performance tires, and remains the main acquisition pool for national consolidators. Regional networks compete on same-day availability of large-rim performance sizes, a service advantage valued by owners of premium crossovers.
General merchandise retailers account for USD 2.41 billion, or 11.11% of 2025 value, rising to USD 2.93 billion by 2030 at a 3.98% CAGR. Warehouse clubs and mass merchants focus on H-rated touring sizes such as 225/65R17, where price competition is strongest. The channel receives 11% of passenger replacement shipments, an estimated 13.98 million performance tires, concentrated in H-rated fitments.
Other recipients, a residual class covering shipments outside the dealer, merchandise and tire-maker channels, account for USD 1.75 billion, or 8.08% of 2025 value, and are projected to reach USD 2.13 billion by 2030 at a 4.01% CAGR. The class receives 8% of passenger replacement shipments, an estimated 10.17 million performance tires. The class grows in line with the market as performance ratings spread across touring and crossover fitments.
Tire-maker owned outlets account for USD 0.66 billion, or 3.03% of 2025 value, rising to USD 0.80 billion by 2030 at a 3.92% CAGR. Manufacturer networks such as the Firestone Complete Auto Care stores operated by Bridgestone Retail Operations, LLC give suppliers a direct channel for ultra-high-performance launches such as the Firehawk Indy 500 V2. The channel receives 3% of passenger replacement shipments, an estimated 3.81 million performance tires in 2025.
By Geography
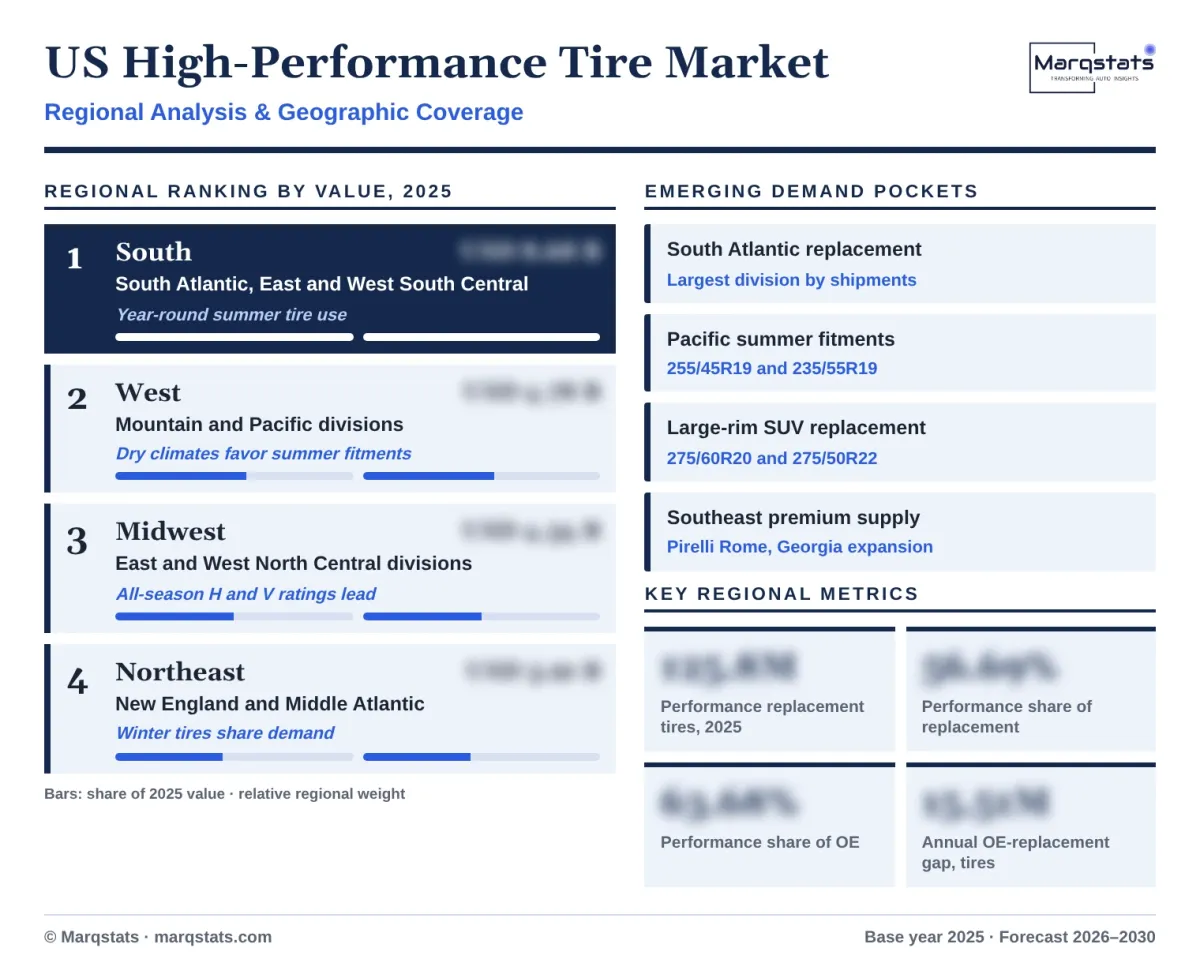
South
The South is the largest regional market, accounting for 40.00% of 2025 value, or USD 8.68 billion, across the South Atlantic, East South Central and West South Central divisions. An estimated 50.32 million performance tires were fitted in the region in 2025, supported by year-round driving that allows summer performance tires to stay fitted without seasonal changeovers. The South Atlantic division alone receives 20% of national passenger replacement shipments, the largest share of any division.
West
The West accounts for 22.00% of 2025 value, or USD 4.78 billion, across the Mountain and Pacific divisions, and the Pacific division alone receives 17% of national passenger replacement shipments. An estimated 27.68 million performance tires were fitted in the region in 2025, with dry climates in the Pacific and Mountain states supporting summer fitments such as 255/45R19. The Mountain division receives 5% of passenger replacement shipments, and the Pacific division accounts for the balance of the region.
Midwest
The Midwest accounts for 20.00% of 2025 value, or USD 4.34 billion, across the East North Central and West North Central divisions. An estimated 25.16 million performance tires were fitted in the region in 2025, and severe winters shift demand toward H and V-rated all-season and all-weather fitments rather than summer ultra-high-performance tires. The East North Central division, which includes Michigan, Ohio and Illinois, receives 13% of national passenger replacement shipments.
Northeast
The Northeast accounts for 18.00% of 2025 value, or USD 3.91 billion, across New England and the Middle Atlantic divisions. An estimated 22.64 million performance tires were fitted in the region in 2025, and winter conditions keep a larger share of demand in all-season and winter tires rather than summer ultra-high-performance fitments. The Middle Atlantic division receives 14% of national passenger replacement shipments and New England 4%.
How Competition Is Evolving
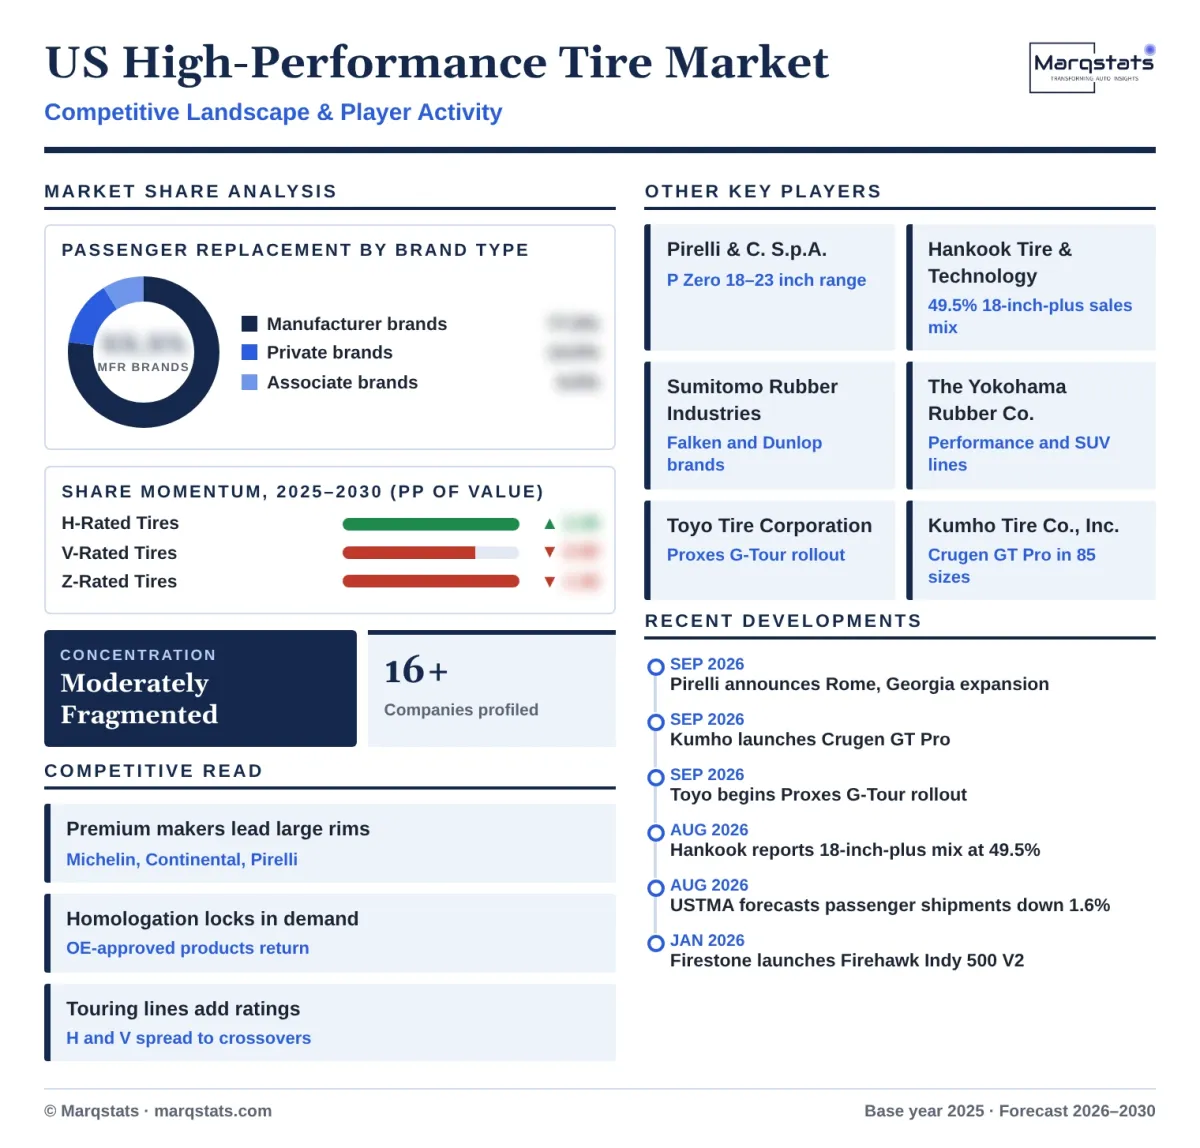
The US high-performance tire market is moderately fragmented at the brand level and concentrated among premium manufacturers. Compagnie Générale des Établissements Michelin SCA, Bridgestone Corporation, The Goodyear Tire & Rubber Company and Continental AG are the four largest global suppliers, with estimated 2025 tire revenue of USD 24.10 billion, USD 19.63 billion, USD 16.90 billion and USD 15.60 billion respectively, and Pirelli & C. S.p.A. adds USD 7.66 billion from a portfolio weighted to High Value products. Manufacturer brands account for 77% of passenger replacement shipments in 2025. Associate brands hold 9% and private brands 14% of passenger replacement shipments, and value-tier brands compete mainly on price in high-volume H-rated sizes such as 225/65R17.
Competition centers on original equipment homologation, large-rim coverage and premium mix. Tires of 18 inches and above accounted for 68% of MICHELIN-brand passenger tire sales and 62% of Continental-brand passenger car tire sales in 2025, and Hankook Tire & Technology Co., Ltd. reported 18-inch-plus tires at 49.5% of its passenger and light truck sales in the second quarter of 2026. Bridgestone extends performance competition to mid-size rims through the Firestone Firehawk Indy 500 V2, while Kumho Tire Co., Inc. and Toyo Tire Corporation add performance-rated touring lines for crossovers.
Supply footprints are shifting toward the US to limit tariff exposure. Pirelli announced a USD 1.2 billion expansion of its Rome, Georgia plant in September 2026, and the 25% Section 232 duty from May 2025 raises the landed cost of imported performance tires. Retail consolidation, led by the USD 700 million Pep Boys acquisition by Mavis Tire Express Services Corp. in August 2026, raises the purchasing power of national dealers over premium assortments.
Companies Covered
Companies covered in the report include:
Recent Market Activity
Table of Contents
Coverage & Segmentation
The US high-performance tire market comprises new H, V and Z speed-rated passenger replacement tires sold in the United States, including W and Y ratings within the Z class, valued at retail in US dollars. The market excludes original equipment fitments, tires with speed ratings below H, LT-metric and truck tires, retreads, and installation and service revenue. Coverage uses a 2025 base year, a 2021–2025 historical period and a 2026–2030 forecast period, with 2026 as the estimated year. The parent market is covered in the Marqstats US Replacement Tire Market report, and the used vehicle parc behind most replacement events is covered in the United States Used Car Market report.
Segmentation covers three speed ratings, six distribution channels and four US Census regions, with 16 manufacturers profiled. Unit shipments by speed rating are the primary series, the market value is a Marqstats estimate, and value is derived from performance units and the passenger replacement average value per tire, with leading large-rim size codes tracked within each rating. The crossover and pickup segment is covered in the Marqstats US SUV and Light Truck Replacement Tire Market report.