Market Snapshot
Middle bar: base-year value × (1 + CAGR), rounded to two decimals. This is a calculated illustration, not a separately researched annual estimate.
The US industrial solid tire market is valued at USD 703.44 million in 2025 and is projected to reach USD 898.46 million by 2030, registering a CAGR of 5.02% over 2026–2030. The market covers new press-on cushion tires, resilient solid tires, polyurethane tires and wheels, and other solid tires for forklifts, warehouse trucks, skid steers, aerial work platforms and ground support equipment, sold as replacement and original equipment. Solid tire imports fell 5.68% to 3.71 million units in 2025, and Marqstats estimates that 4.75 million solid and polyurethane tires entered use, down 3.65%, as US forklift shipments fell 9.03% to 231,397 trucks.
Market size and forecast figures are generated using Marqstats' proprietary estimation framework, updated as of October 2026.
Coverage spans four product types, four vehicle classes, two sales channels and four US regions: the South, West, Midwest and Northeast. The analysis benchmarks 16 tire makers and lift truck makers, including Compagnie Générale des Établissements Michelin SCA, Continental AG, The Yokohama Rubber Co., Ltd., Titan International, Inc. and Superior Tire & Rubber Corp., and tracks reference sizes such as 16x6x10.5, 18x7x12.125, 21x7x15 and 22x9x16 for press-on tires, 6.50-10, 7.00-12, 28x9-15 and 8.25-15 for resilient solid tires, 10x5x6.25 for polyurethane drive tires, and solid 10-16.5 and 12-16.5 for skid steers. Pneumatic tires, including foam-filled tires, sit outside the market.
Key Takeaways
Market Overview & Analysis
Report Summary
The US industrial solid tire market comprises new non-pneumatic tires for material handling and industrial vehicles, valued at USD 703.44 million in 2025 at the prices lift truck makers and dealers pay. Press-on cushion tires, which press onto a steel band, resilient solid tires shaped like pneumatic tires, polyurethane drive tires and load wheels, and other solid tires for skid steers, aerial work platforms, ground support equipment and carts all fall in scope, in standard and non-marking compounds. Pneumatic and foam-filled tires, rims and wheel assemblies sold without a tire, and tire pressing and retreading services sit outside the market perimeter.
Imports supply most units. Solid tire imports fell from 3,930,986 units in 2024 to 3,707,847 units in 2025, while customs value fell 7.54% from USD 242.96 million to USD 224.65 million. Customs value per tire slipped 1.97% from USD 61.81 to USD 60.59. US plants such as Superior Tire & Rubber Corp. in Warren, Pennsylvania and Specialty Tires of America, Inc. in Indiana, Pennsylvania make press-on and polyurethane products, and Marqstats estimates domestic supply of about 1.30 million units, less about 0.20 million exported, which together with imports covers the 4.75 million tires that entered use in 2025.
Product construction follows the truck and the floor. Cushion trucks carry press-on tires bonded to a steel band that a hydraulic press fits onto the wheel, giving a low profile and high load capacity on smooth concrete. Pneumatic-shaped trucks carry resilient solid tires with a hard base, a cushioning middle layer and a wear-resistant tread, which fit standard pneumatic rims and handle rough yards without punctures. Warehouse trucks run polyurethane treads bonded to cast wheels, which resist cuts and carry heavy loads on small diameters. Each construction serves a distinct vehicle class, so tire demand shifts with the mix of trucks sold as much as with total truck volume.
The lift truck cycle turned down in 2025. Industrial Truck Association (ITA) data show US factory shipments fell 9.03% from 254,359 trucks in 2024 to 231,397 in 2025. Class 1 and 2 electric rider trucks fell 8.85% to 88,461, Class 4 and 5 internal combustion trucks fell 22.37% to 63,855, and Class 3 electric hand and rider trucks rose 5.37% to 79,081, lifting their share of shipments from 29.5% to 34.2%. Marqstats estimates original equipment tires at 0.91 million in 2025 against 3.84 million replacement tires, so the installed fleet, not new truck sales, sets most of the demand.
Replacement follows hours of use. A press-on tire on a multi-shift electric counterbalance truck can wear out in a year, while the same tire on a single-shift truck lasts several years. Floor condition, turning, load, heat and debris drive wear, and chunking or flat spots force early removal. Marqstats sizes replacement by product type from the active fleet, typical annual hours and tire life, and adds early removals for damage. Hyster-Yale said in August 2026 that the first half of 2026 marked the bottom of the lift truck cycle, which supports original equipment demand from late 2026.
Value grows faster than units through mix and price. The average value per tire is an estimated USD 148.09 in 2025, rising to USD 164.86 by 2030, while units grow from 4.75 million to 5.45 million. Market value reaches an estimated USD 734.98 million in 2026. Pneumatic tires for forklifts, telehandlers and construction machines are covered in the Marqstats US Construction and Industrial Tire Market report.
Market Dynamics
Key Drivers
Five factors support industrial solid tire demand in the United States.
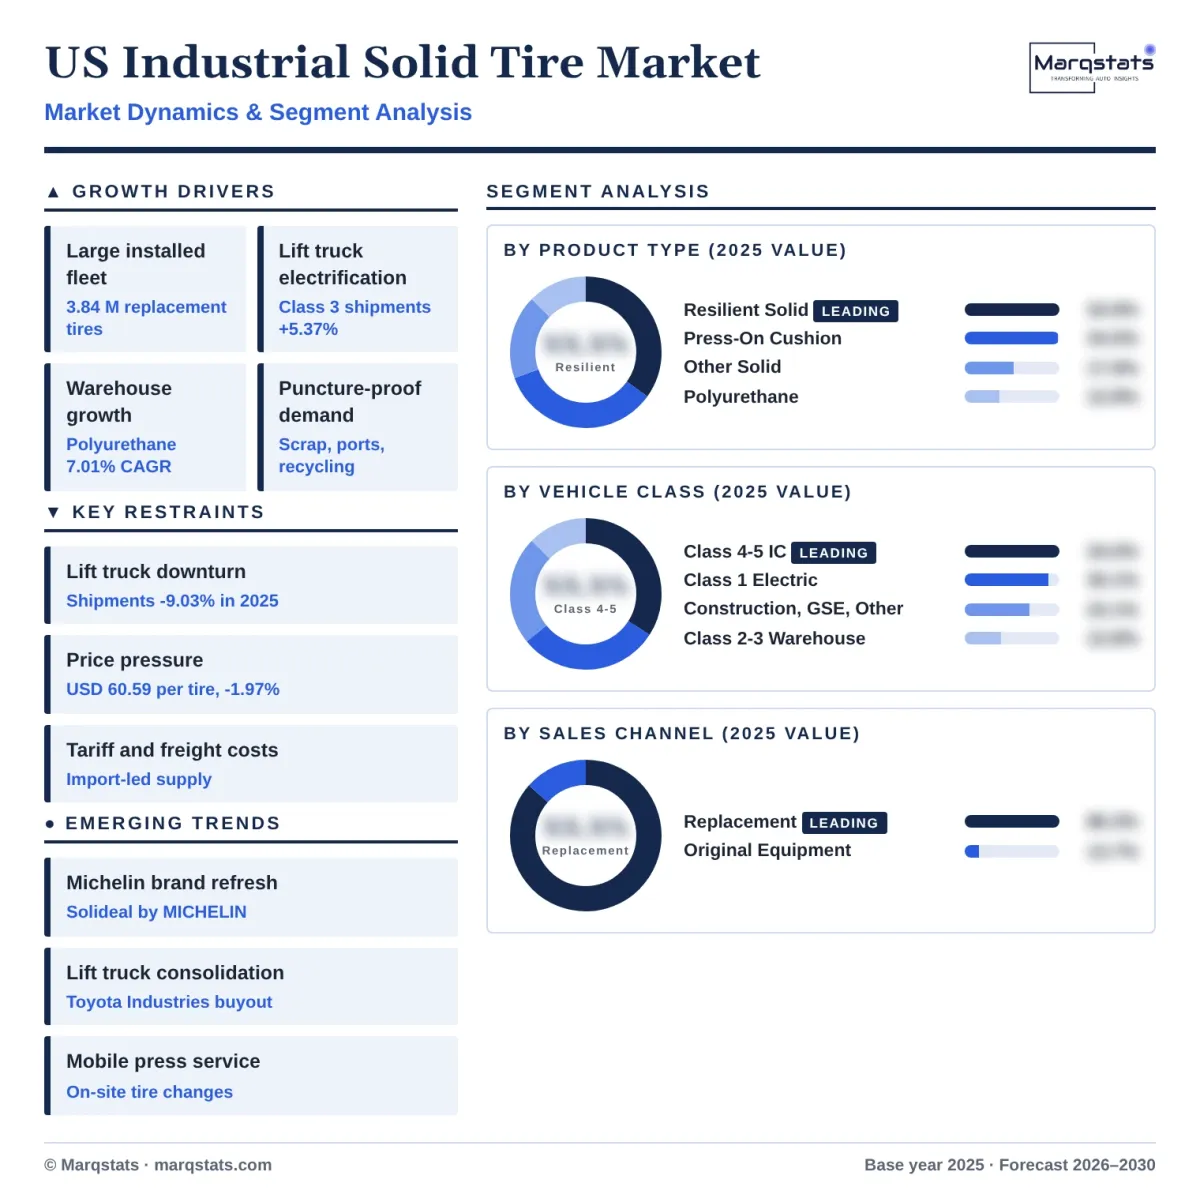
- Large installed forklift fleet. Replacement accounts for 3.84 million of the 4.75 million tires that entered use in 2025, because forklifts stay in service for many years and need several tire sets over their life. Distribution centers, factories and food plants run trucks on two or three shifts, and press-on tires on busy trucks wear out within a year. Replacement value grows at a 5.00% CAGR to USD 775.27 million by 2030. Replacement units rise from 3.84 million in 2025 to 4.40 million by 2030. Fleet managers also replace tires early when wear reduces lift height clearance or stability.
- Electrification of lift trucks. Electric counterbalance trucks run press-on cushion or resilient solid tires on smooth indoor floors, and electric trucks take a growing share of US shipments as internal combustion trucks decline. Class 4 and 5 internal combustion shipments fell 22.37% in 2025, while Class 3 shipments rose 5.37%. Electric truck owners want low rolling resistance compounds that extend battery life between charges. Class 3 trucks took 34.2% of US shipments in 2025, up from 29.5% in 2024. Lithium-ion batteries let electric trucks run multiple shifts, which raises tire wear per truck.
- Warehouse and e-commerce growth. Pallet jacks, stackers, order pickers and reach trucks in Class 2 and 3 run polyurethane drive tires and load wheels that wear quickly in high-throughput warehouses. Polyurethane tires and wheels grow fastest at a 7.01% CAGR to USD 126.11 million by 2030. MODEX 2026 in Atlanta drew about 50,000 registered visitors and 1,057 exhibitors, a record for the show. Automated guided vehicles and mobile robots add further demand for polyurethane wheels. Retail chains and third-party logistics providers add distribution space each year in major freight corridors.
- Puncture-proof demand in harsh sites. Scrap yards, recycling plants, ports, lumber yards and demolition sites move forklifts, skid steers and loaders to resilient solid tires to stop flats and downtime. Suppliers including Yokohama-ATG told Modern Tire Dealer in September 2026 that buyers in warehousing, recycling, scrap and port settings favor solid resilient tires and press-on bands to avoid punctures. Resilient solid tires cost more than pneumatic tires of the same size, which lifts market value per switch. Solid tires also remove the need for pressure checks, which cuts maintenance labor for large fleets.
- Non-marking compounds. Food processing, pharmaceutical, retail and cold storage sites require non-marking tires that leave no black marks on floors. Non-marking press-on and resilient solid tires carry higher prices than standard black compounds, which lifts value per tire. The average value per tire rises from USD 148.09 in 2025 to USD 164.86 by 2030. Cold storage sites also need compounds that stay flexible at low temperatures. Non-marking demand also grows in electronics and automotive parts warehouses with sealed or painted floors.
Key Restraints
Four constraints hold back industrial solid tire growth.
- Lift truck production downturn. US forklift shipments fell 9.03% in 2025, and Hyster-Yale's Q2 2026 revenue fell 16% to USD 755.5 million on lower shipments. Marqstats projects original equipment tires on Class 4 and 5 trucks to fall 6% in 2026, and fewer new trucks also slow the growth of the installed fleet. Hyster-Yale expects most of its shipment growth to arrive later in 2026.
- Price pressure and high inventories. Global Rubber Industries told Modern Tire Dealer in September 2026 that softer demand, high inventories and stronger competition have increased price pressure, with buyers shifting toward budget brands in material handling. Customs value per solid tire fell 1.97% in 2025, and low-cost press-on imports compete with branded tires on common sizes such as 16x6x10.5. Distributors holding high stock discount older inventory to clear warehouse space.
- Longer-life compounds. Tire makers extend tire life with harder-wearing compounds and better heat resistance, and buyers increasingly judge tires on total cost of ownership. Longer life lowers the number of tires bought per operating hour and offsets part of fleet growth. Fleets that track cost per hour often move to premium tires that last longer.
- Tariff and freight uncertainty. Most solid tires come from plants in Sri Lanka, China, India and Europe, so duty and freight changes move landed costs quickly. Trident International told Modern Tire Dealer that raw material and freight costs are pushing industrial tire prices up and that tariffs add uncertainty, while the Supreme Court ruled in February 2026 that IEEPA does not authorize tariffs. Distributors that import containers of press-on tires face the largest exposure to duty changes.
Key Trends
Four shifts are changing how industrial solid tires are made, sold and serviced.
- Brand consolidation at Michelin. Michelin announced its Beyond Road brand refresh on 2 September 2026, moving Solideal by Camso tires and wheels to the Solideal by MICHELIN name. Distributors may list legacy and new part numbers side by side during the change, and dealers update catalogs for one of the largest press-on and resilient solid ranges in the market. The change folds the Camso industrial range into the Michelin brand family. Dealers that carry both brands during the transition need clear cross-references to avoid double ordering.
- Consolidation among lift truck makers. Toyota Motor Corporation completed its tender offer for Toyota Industries Corporation, the parent of Toyota Material Handling and Raymond, in March 2026 in a buyout worth about 5.9 trillion yen, and the company is being delisted. Lift truck makers set original equipment tire specifications and approve suppliers, so changes in ownership and sourcing shape which tires reach new trucks. Toyota Industries is the largest lift truck maker in the world by revenue. Hyster-Yale also cited tariff-related sourcing changes that slow its production response to new bookings.
- Mobile tire pressing and service. Press-on tires need a hydraulic press to fit, so dealers run mobile press trucks that change tires on site at warehouses and plants. Fleets sign service contracts that cover inspection, replacement and disposal, and OTR Engineered Solutions said in September 2026 that fleets increasingly use national account programs for consistent service. On-site pressing cuts truck downtime from hours to minutes for many fleets. Mobile service also lets dealers inspect other wear parts while on site, which deepens fleet relationships.
- Smart and sustainable tires. Suppliers add tire sensors for preventive maintenance and use recycled and renewable materials in compounds, according to the Modern Tire Dealer industrial tire review in September 2026. Yokohama TWS also reported a shift toward lock-ring style wheel and tire assemblies that speed changes on resilient solid tires. Sensors that track hours and temperature help fleets plan replacement before tires fail. Recycled rubber content also helps large retailers meet supply chain sustainability targets.
Market Segmentation
Resilient solid tires account for an estimated USD 245.17 million, or 34.85% of 2025 value, the largest product type, and are projected to reach USD 303.34 million by 2030 at a 4.35% CAGR. Internal combustion pneumatic-shaped forklifts, electric counterbalance trucks and port equipment use 0.95 million resilient solid tires in 2025 at an average of USD 258.07 per tire, in sizes such as 6.50-10, 7.00-12, 28x9-15 and 8.25-15. These tires replace air-filled tires on rough outdoor surfaces where punctures cause downtime. Non-marking resilient tires serve food and beverage plants that also need puncture protection.
Press-on cushion tires account for an estimated USD 242.60 million, or 34.49% of 2025 value, and are projected to reach USD 308.07 million by 2030 at a 4.89% CAGR. These tires lead units at 2.10 million in 2025, including 0.29 million original equipment tires, at an average of USD 115.52 per tire, in sizes such as 16x6x10.5, 18x7x12.125, 21x7x15 and 22x9x16. Electric and internal combustion cushion forklifts on smooth indoor floors use them. Traction treads suit wet or dusty floors, while smooth treads give the longest wear on dry concrete.
Other industrial solid tires account for an estimated USD 125.80 million, or 17.88% of 2025 value, and are projected to reach USD 160.94 million by 2030 at a 5.05% CAGR. Skid steers, aerial work platforms, airport ground support equipment, tow tractors and industrial carts use 0.45 million tires in 2025 at an average of USD 279.56 per tire, in sizes such as solid 10-16.5 and 12-16.5 for skid steers and 6.00-9 for ground support equipment. Solid skid steer tires cost several times more than pneumatic tires of the same size.
Polyurethane tires and wheels account for an estimated USD 89.87 million, or 12.78% of 2025 value, and are projected to reach USD 126.11 million by 2030 at a 7.01% CAGR, the fastest product type. Pallet jacks, stackers, reach trucks and order pickers use 1.25 million polyurethane drive tires and load wheels in 2025, including 0.45 million original equipment units, at an average of USD 71.90 each, in sizes such as 10x5x6.25 drive tires. Load wheels wear fastest of all industrial tire products because they carry heavy loads on small diameters.
Class 4 and 5 internal combustion trucks account for an estimated USD 239.29 million, or 34.02% of 2025 value, and are projected to reach USD 296.16 million by 2030 at a 4.36% CAGR, the slowest vehicle class. These trucks use 1.37 million solid tires in 2025: Class 4 cushion trucks run press-on tires indoors and Class 5 pneumatic-shaped trucks run resilient solid tires outdoors. US shipments fell 22.37% to 63,855 in 2025, while a large installed fleet keeps replacement steady. Lumber, steel and building supply yards keep internal combustion trucks in service for heavy outdoor loads.
Class 1 electric counterbalance trucks account for an estimated USD 211.70 million, or 30.09% of 2025 value, and are projected to reach USD 269.44 million by 2030 at a 4.94% CAGR. These trucks use 1.54 million press-on and resilient solid tires in 2025, rising to 1.74 million by 2030, as electric trucks replace internal combustion models in warehouses and plants. Electric trucks also run quieter and cleaner, which suits food and retail warehouses.
Construction, ground support and other vehicles account for an estimated USD 162.58 million, or 23.11% of 2025 value, and are projected to reach USD 206.75 million by 2030 at a 4.92% CAGR. Skid steers, aerial work platforms, airport tugs, port equipment and carts use 0.59 million solid tires in 2025, often in puncture-prone sites such as scrap yards and recycling plants. Airports replace ground support tires on a schedule set by airline service contracts.
Class 2 and 3 warehouse trucks account for an estimated USD 89.87 million, or 12.78% of 2025 value, and are projected to reach USD 126.11 million by 2030 at a 7.01% CAGR, the fastest vehicle class. Narrow aisle trucks, pallet jacks and stackers use 1.25 million polyurethane tires and wheels in 2025, and Class 3 shipments rose 5.37% to 79,081 trucks in 2025. High pallet throughput in e-commerce centers wears polyurethane wheels in months rather than years.
Replacement accounts for an estimated USD 607.32 million, or 86.34% of 2025 value, and is projected to reach USD 775.27 million by 2030 at a 5.00% CAGR. Fleets bought 3.84 million replacement tires in 2025, rising to 4.40 million by 2030, through forklift dealers, industrial tire distributors and mobile press service providers. Large fleets replace tires by axle or full set during planned maintenance.
Original equipment accounts for an estimated USD 96.12 million, or 13.66% of 2025 value, and is projected to reach USD 123.19 million by 2030 at a 5.09% CAGR. Lift truck makers fitted 0.91 million solid and polyurethane tires in 2025, rising to 0.92 million in 2026 and 1.06 million by 2030, at prices about 15% below replacement. Lift truck makers approve two or three tire suppliers per model.
By Geography
South
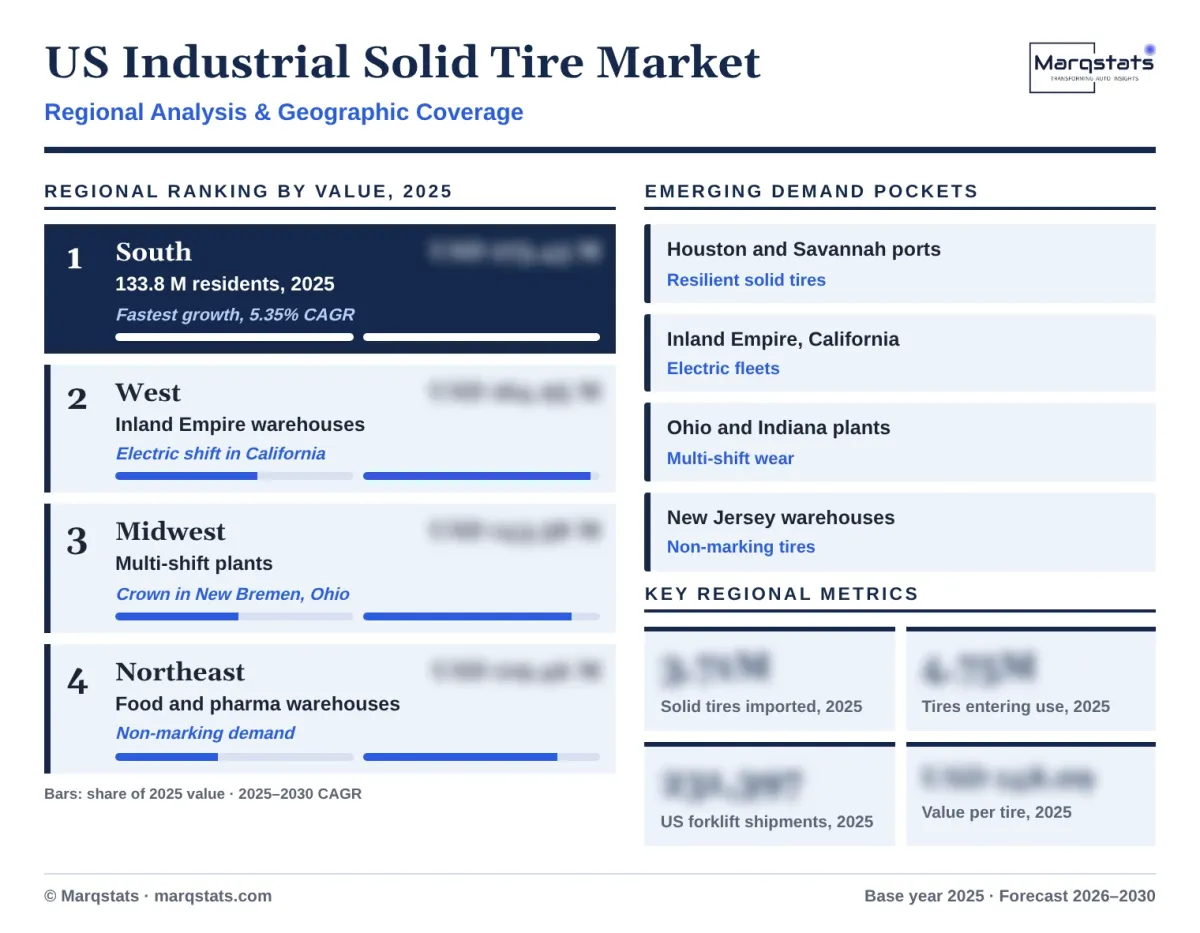
The South is the largest regional market at 39.16% of 2025 value, or USD 275.45 million, and grows fastest at a 5.35% CAGR to USD 357.46 million by 2030. The region held 133.8 million residents in July 2025, 39.16% of the US population, and distribution hubs in Texas, Georgia, Tennessee and Florida run large forklift fleets. Ports such as Houston and Savannah add demand for resilient solid tires on container handlers and yard trucks. Year-round construction and logistics activity in the Sun Belt keeps forklift utilization high.
West
The West accounts for 23.45% of 2025 value, or USD 164.95 million, and is projected to reach USD 211.95 million by 2030 at a 5.14% CAGR. The Inland Empire in Southern California holds one of the largest warehouse concentrations in the country, and the ports of Los Angeles and Long Beach run large fleets of material handling equipment. California rules on forklift emissions push fleets toward electric trucks on press-on tires. Port congestion and peak shipping seasons drive multi-shift operation of yard equipment.
Midwest
The Midwest accounts for 20.41% of 2025 value, or USD 143.58 million, and is projected to reach USD 180.84 million by 2030 at a 4.72% CAGR. Manufacturing plants and distribution centers across Ohio, Illinois, Indiana and Michigan run multi-shift forklift fleets, and Crown Equipment Corporation builds lift trucks in New Bremen, Ohio. Steel, automotive and appliance plants run heavy resilient solid tires on large internal combustion trucks.
Northeast
The Northeast accounts for 16.98% of 2025 value, or USD 119.46 million, and is projected to reach USD 148.21 million by 2030 at a 4.41% CAGR. Food distribution, pharmaceutical and retail warehouses in New Jersey and Pennsylvania favor non-marking tires, and Superior Tire & Rubber Corp. and Specialty Tires of America, Inc. produce in Pennsylvania. Dense urban warehouses use narrow aisle trucks on polyurethane wheels to save floor space.
How Competition Is Evolving
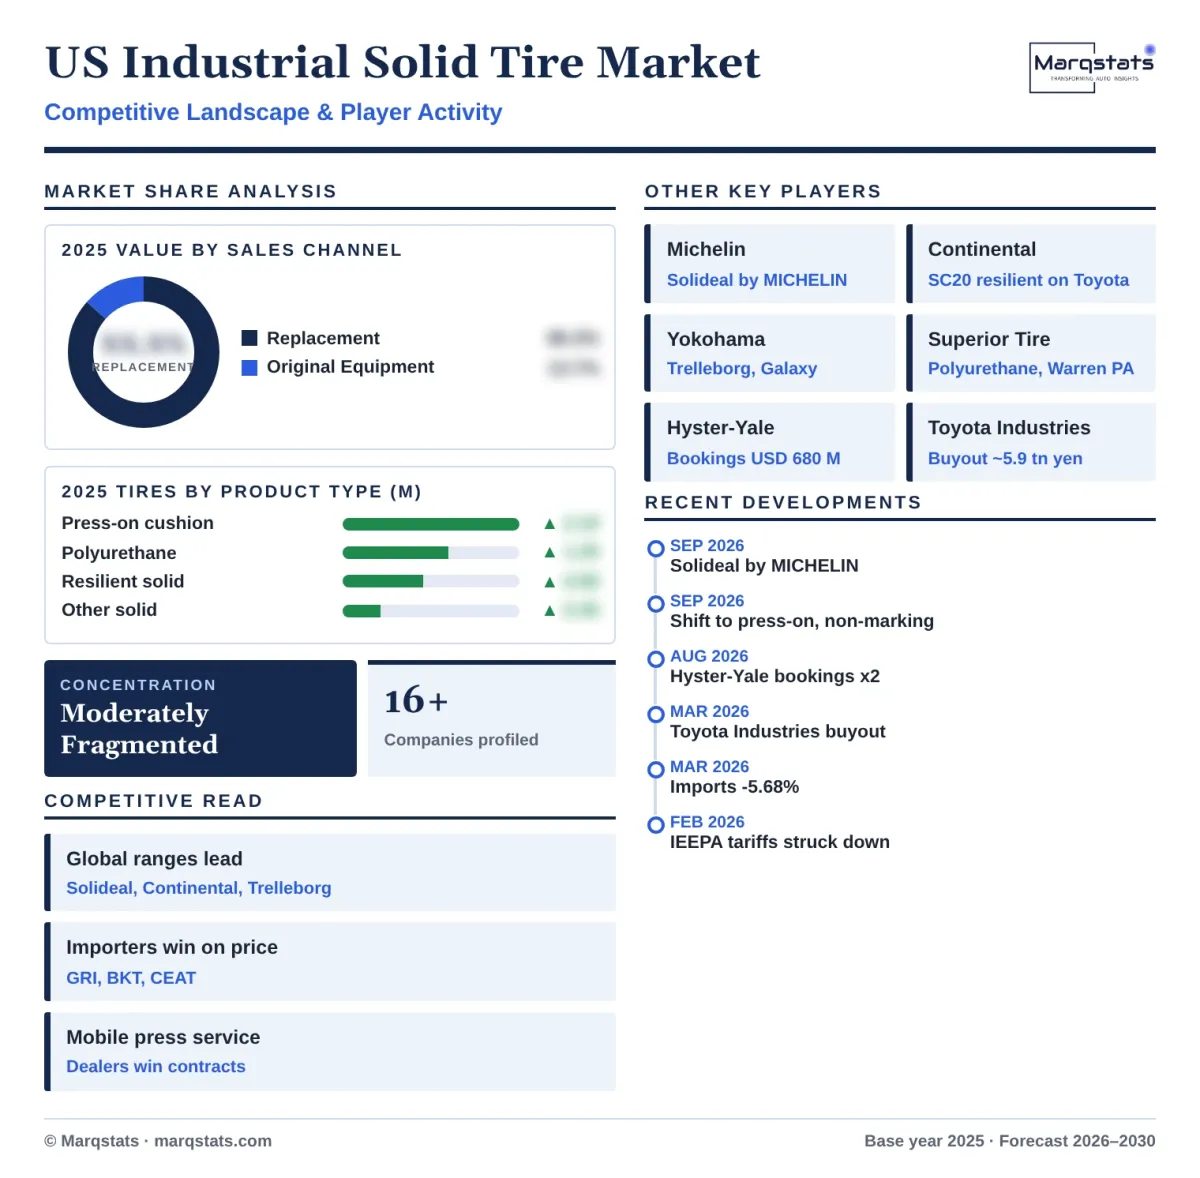
The US industrial solid tire market is moderately fragmented, with a few global ranges competing against many low-cost importers. Compagnie Générale des Établissements Michelin SCA through Solideal, Continental AG through its material handling solid tire range, The Yokohama Rubber Co., Ltd. through Trelleborg and Galaxy industrial tires, and Titan International, Inc. through Titan Specialty lead in press-on and resilient solid tires. Continental supplies its SC20 resilient tire as original equipment on some Toyota trucks.
Specialist and value makers compete on price and range. Global Rubber Industries (Pvt) Ltd., Balkrishna Industries Limited, CEAT Limited, Double Coin Holdings Ltd. and Zhongce Rubber Group Co., Ltd. supply press-on and resilient solid tires at discounts to premium brands. Superior Tire & Rubber Corp. leads in polyurethane tires and wheels from its Warren, Pennsylvania plant, and Specialty Tires of America, Inc. supplies press-on and industrial tires from Indiana, Pennsylvania.
Lift truck makers shape original equipment demand. Toyota Industries Corporation, Hyster-Yale, Inc., KION Group AG, Crown Equipment Corporation and Jungheinrich AG approve tire suppliers for each model and sell replacement tires through their dealer networks. Hyster-Yale's Q2 2026 lift truck bookings reached USD 680 million, more than double the prior year, led by the Americas, while KION's first-half 2026 Industrial Trucks and Services orders were EUR 3.982 billion, slightly below 2025.
Product range breadth and fitment data are key selling points. Industrial tire buyers need exact matches for hundreds of press-on and resilient sizes across truck models, and suppliers compete on catalog depth, stock availability and technical support for load and speed ratings. Global brands back dealers with fitment guides and training, while value importers focus on the highest-volume sizes such as 16x6x10.5, 18x7x12.125 and 6.50-10, where price competition is strongest.
Service decides replacement share. Dealers that own mobile presses and stock common sizes win contracts with large warehouse operators, and lift truck dealers bundle tire replacement into planned maintenance. Michelin's September 2026 brand refresh folds Solideal into the Michelin name, and electric forklift growth is covered in the Marqstats Electric Forklift Market report.
Companies Covered
Companies covered in the report include:
Recent Market Activity
Table of Contents
Coverage & Segmentation
The US industrial solid tire market comprises new press-on cushion tires, resilient solid tires, polyurethane tires and wheels, and other solid tires for material handling and industrial vehicles, sold as replacement and original equipment, valued at lift truck maker and dealer purchase prices in US dollars. The market excludes pneumatic and foam-filled tires, rims and wheels sold without tires, and pressing, retreading and other services. Coverage uses a 2025 base year, a 2021–2025 historical period and a 2026–2030 forecast period, with 2026 as the estimated year. Pneumatic forklift and construction tires are covered in the Marqstats US Construction and Industrial Tire Market report.
Segmentation covers four product types, four vehicle classes, two sales channels and four US regions, with 16 tire makers and lift truck makers profiled. Original equipment units follow lift truck shipments by class and tire positions, replacement units follow the active fleet, operating hours and tire life, and the import series is reconciled with domestic output and exports. Regional values follow population. Sizes such as 16x6x10.5, 21x7x15, 22x9x16, 6.50-10, 7.00-12, 28x9-15 and 10x5x6.25 are tracked as reference sizes. Tire dealer channel economics are covered in the Marqstats US Tire Dealer Market report.