Market Snapshot
Middle bar: base-year value × (1 + CAGR), rounded to two decimals. This is a calculated illustration, not a separately researched annual estimate.
The US commercial truck tire market is valued at USD 10.02 billion in 2025 and is projected to reach USD 11.31 billion by 2030, registering a CAGR of 2.45% over 2026–2030. The market covers new replacement tires for medium and heavy trucks, tractors, trailers and buses, which accounted for 24.7 million units in 2025, or 8.69% of US replacement tire shipments and 17.37% of replacement value. Two size codes, 295/75R22.5 and 11R22.5, account for 52.6% of replacement units, and shipments fall 7.1% to 22.9 million in 2026 before recovering to an estimated 24.59 million by 2030.
Market size and forecast figures are generated using Marqstats' proprietary estimation framework, updated as of October 2026.
Coverage spans three size groups and the five Traffic Volume Trends regions defined by the Federal Highway Administration (FHWA), from the North Central states to the Northeast. The analysis profiles the manufacturers that supply the market and benchmarks the commercial dealers, from Southern Tire Mart, LLC to Pomp's Tire Service, Inc., that fit and service fleet tires. Original equipment tires, retreads and road service revenue are tracked as context for the replacement forecast.
Key Takeaways
Market Overview & Analysis
Report Summary
The US commercial truck tire market comprises new replacement tires for medium and heavy trucks, tractors, trailers and buses, valued at USD 10.02 billion in 2025. The US Tire Manufacturers Association (USTMA) reports 24.7 million replacement truck tire shipments in 2025, and the market is valued at an estimated USD 405.56 per tire, more than twice the passenger average of USD 172.56. Original equipment truck tires, 4.4 million units in 2025, and retreaded tires sit outside the market perimeter, although retreading competes directly with new replacement tires for every casing that fleets keep in service. Truck and bus tires form 17.37% of US replacement tire value in 2025, the second-largest class after passenger tires.
Demand is driven by freight activity, fleet size and the wear of steer, drive and trailer positions. The medium and heavy vehicle parc reached 9.834 million units in 2025, up from 8.995 million in 2020, a 1.80% annual rate, and all-road vehicle miles traveled reached 3,323.786 billion in 2025, up 0.9%, according to the FHWA. Two fitments dominate the fleet, as 295/75R22.5 accounts for 30.1% of replacement units and 11R22.5 for 22.5%, an estimated 7.43 million and 5.56 million tires, so dealer inventory and pricing concentrate on a narrow size range compared with passenger tires. The ten largest passenger replacement sizes, by contrast, account for only 28.6% of passenger shipments, so truck tire assortments are far narrower.
Freight weakness and trade policy set the frame for 2026–2030. The USTMA July 2026 forecast, published on 6 August 2026, projects replacement truck tire shipments of 22.9 million units in 2026, down 7.1%, while Bridgestone Americas, Inc. estimates that North American truck and bus replacement demand fell 13% in the first half of 2026. A 25% Section 232 tariff on medium and heavy truck parts, including tires, took effect on 1 November 2025, which raises the landed cost of imported truck tires and lifts the average value per tire to an estimated USD 414.47 in 2026. Market value recovers to USD 9.92 billion in 2027 and USD 10.36 billion in 2028 as freight demand stabilizes.
Supply is led by global manufacturers selling through a concentrated commercial dealer channel. Southern Tire Mart, LLC reported USD 3.33 billion of commercial sales in 2025, up 7.4%, with 230 owned outlets, 3,810 service trucks and 25 retread plants, while Pomp's Tire Service, Inc. reached USD 1.15 billion, up 43.4%, through acquisitions. Best One Tire & Service reported USD 1.05 billion and McCarthy Tire Service Company, Inc. USD 556.8 million of commercial sales in 2025. The full US replacement market, of which truck and bus tires form 17.37%, is covered in the Marqstats US Replacement Tire Market analysis.
Market Dynamics
Key Drivers
Five conditions sustain replacement truck tire demand and value in the United States.
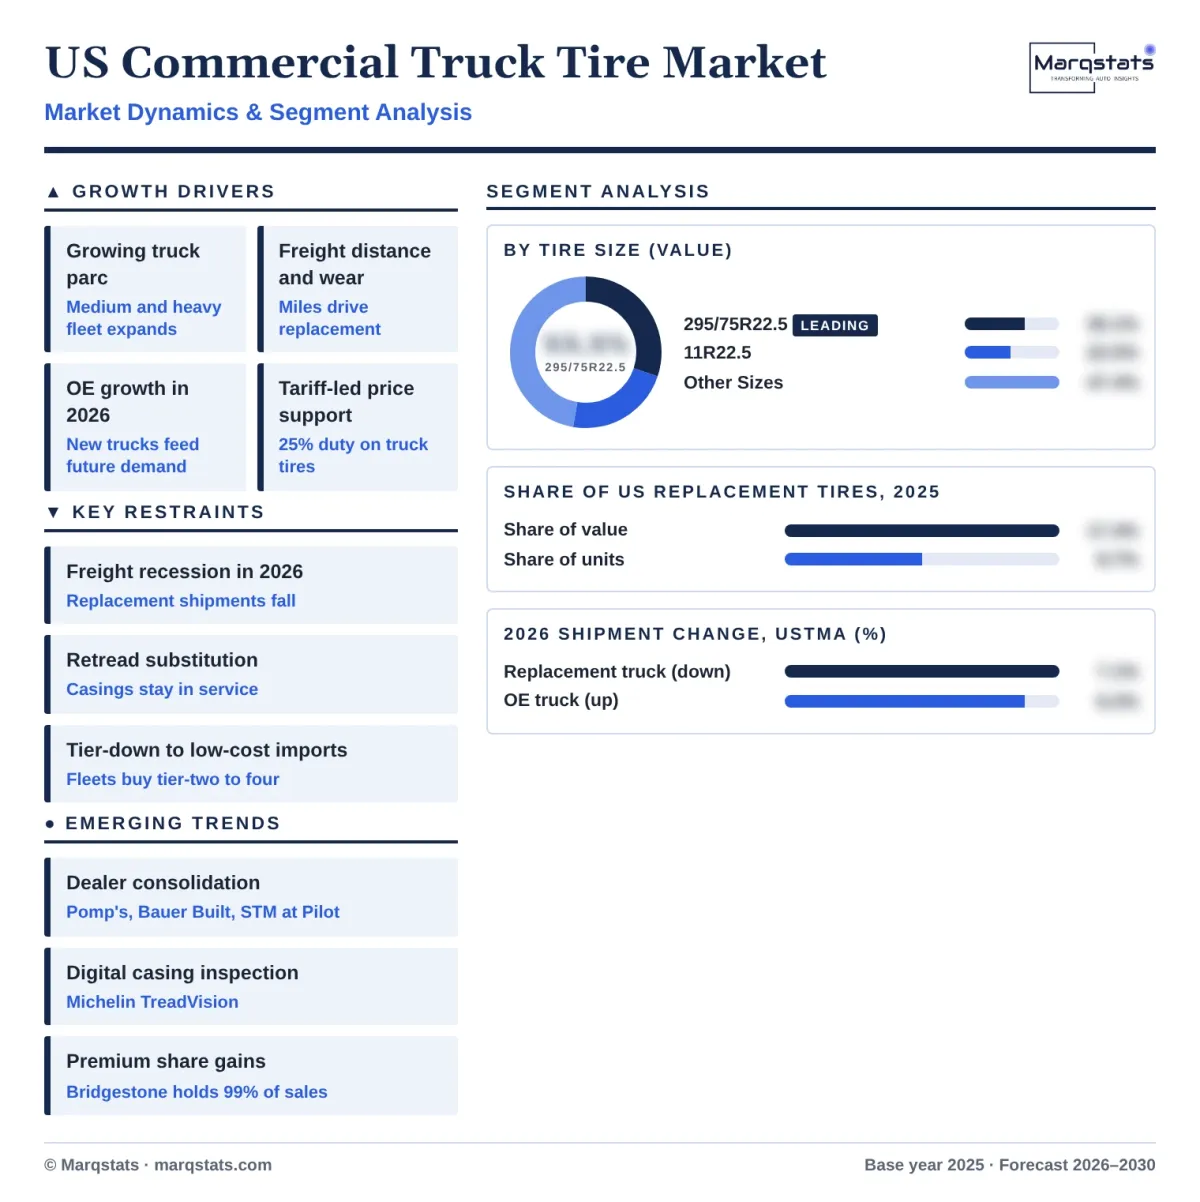
- Growing medium and heavy vehicle parc. The medium and heavy vehicle parc reached 9.834 million units in 2025, up from 8.995 million in 2020, a 1.80% annual rate. Each additional tractor-trailer combination adds 18 tire positions across steer, drive and trailer axles, and Marqstats projects replacement shipments to recover to 24.59 million units by 2030 as the parc continues to grow. Medium and heavy vehicles form 3.29% of the 298.561 million vehicles in operation in 2025, yet their tires account for 17.37% of US replacement tire value. Fleet growth therefore carries a disproportionate weight in replacement tire spending.
- Freight distance and tread wear. All-road vehicle miles traveled reached 3,323.786 billion in 2025, up 0.9% or 29.8 billion miles, according to the FHWA. Long-haul tractors accumulate high annual mileage, and drive and steer tires on 295/75R22.5 and 11R22.5 fitments wear out on a predictable mileage cycle, which ties replacement demand to freight volumes. Freight distance links tire demand to the wider economy, and the 0.9% rise in 2025 travel supported the 24.7 million replacement shipments recorded for the year.
- Original equipment growth in 2026. The USTMA forecasts original equipment truck tire shipments of 4.6 million units in 2026, up 6.2% from 4.4 million in 2025, and Bridgestone reported a 6% rise in North American truck and bus original equipment sales in the first half of 2026. New trucks delivered in 2026 enter the replacement pool once their original tires reach the end of tread life. The rise in original equipment shipments in 2026 contrasts with the fall in replacement, as fleets that bought new trucks defer replacement on older units.
- Tariff-led price support. The 25% Section 232 tariff on medium and heavy truck parts, including tires, from 1 November 2025 raises the landed cost of imported truck tires. Marqstats projects the average value of a replacement truck tire to rise from an estimated USD 405.56 in 2025 to USD 414.47 in 2026 and USD 459.95 in 2030. Price growth carries all of the value growth in the market through 2030, as replacement units ease from 24.7 million in 2025 to 24.59 million in 2030.
- Total cost of ownership purchasing. Fleets judge truck tires by cost per mile, casing value, uptime and fuel efficiency rather than purchase price, according to suppliers surveyed by Modern Tire Dealer in July 2026. The Goodyear Tire & Rubber Company and Toyo Tire U.S.A. Corp. promote premium, highly retreadable casings, which sustains demand for tier-one new tires on steer and drive positions. Fleets running premium casings through two or more retread cycles lower their cost per mile, which supports premium new tire sales on the first life of each casing.
Key Restraints
Four constraints hold truck tire volumes below the 2025 level until the end of the decade.
- Freight recession in 2026. The USTMA July 2026 forecast projects replacement truck tire shipments of 22.9 million units in 2026, down 7.1% or 1.7 million units from 24.7 million in 2025. Market value falls to an estimated USD 9.49 billion in 2026, down from USD 10.02 billion, the only US replacement tire class to lose value in the year. The decline is concentrated in the replacement channel, as fleets defer purchases and run tires closer to minimum tread depth during the freight downturn.
- Steeper first-half decline. Bridgestone Americas, Inc. estimates that North American truck and bus replacement demand fell 13% in the first half of 2026, nearly twice the full-year USTMA decline, while its own replacement sales held at 99% of the prior year. Kumho Tire U.S.A., Inc. reported a 15% year-over-year decline in the commercial truck segment in the first quarter of 2026. The gap between the first-half industry estimate and the full-year forecast implies a partial recovery in replacement demand during the second half of 2026.
- Retread substitution. Retreading extends casing life and replaces new tires on drive and trailer positions, and Michelin Retread Technologies launched TreadVision in March 2026, using 1,200 tread measurement points to raise inspection consistency. Southern Tire Mart operates 25 retread plants producing 8,310 retreads a day in 2025, which limits new tire demand per vehicle. Retread capacity at the largest dealers gives fleets a lower-cost alternative to new tires on trailer positions, where retreads are commonly used.
- Tier-down to low-cost imports. American Tire Distributors, Inc. reported fleets tiering down to tier-two through tier-four truck tires in 2026, and TBC Corporation expects continued share gains by tier-three and tier-four brands. Sailun Group Co., Ltd. and Tireco, Inc. cite aggressive discounting from global overcapacity, which caps price growth for premium suppliers. Price pressure from low-cost imports limits the ability of premium suppliers to pass the full tariff cost on to fleets in 2026.
Key Trends
Four shifts are changing how truck tires are bought, serviced and supplied in the United States.
- Dealer consolidation and service networks. Pomp's Tire Service, Inc. grew commercial sales 43.4% to USD 1.15 billion in 2025 through acquisitions, Bauer Built, Inc. grew 23.9% to USD 390.4 million, and the Southern Tire Mart at Pilot joint venture grew 57.6% to USD 260 million across 161 travel-center outlets. Scale lets dealers offer national fleet contracts and 24-hour road service. McCarthy Tire Service Company, Inc. operates 800 service trucks and 13 retread plants, and service coverage now decides many national fleet contracts.
- Digital casing inspection. Michelin Retread Technologies launched TreadVision in March 2026, with the TreadEye scanner taking 1,200 tread measurement points per tire. Dealers now compete on inspection consistency, casing salvage and data reporting as much as on tire price, which favors operators with integrated retread plants. Data from casing inspection also feeds fleet tire management platforms that schedule replacement and retreading by position.
- Original equipment share gains by premium suppliers. Bridgestone reported that its North American truck and bus replacement sales held at 99% of the prior year in the first half of 2026 against an estimated 13% industry decline, and its global truck and bus revenue rose 8% to about USD 3.31 billion. Premium suppliers gain share through fleet programs and original equipment fitments. Original equipment fitments on new Class 8 tractors create replacement loyalty when fleets match the original tire at first replacement.
- Tariff-driven import rebalancing. Bridgestone reports that tariffs are starting to normalize low-tier import levels, while Prometeon Tyre Group S.r.l. and Shandong Linglong Tyre Co., Ltd. report continued demand for low-cost Asian brands. The 25% Section 232 duty on truck tires from November 2025 narrows the price gap between imports and US-built premium tires. The duty narrows the price gap between US-built and imported truck tires further in 2026.
Market Segmentation
The low-profile 295/75R22.5 is the largest single replacement size, accounting for 30.1% of truck and bus replacement units, an estimated 7.43 million tires and USD 3.02 billion in 2025. Value is projected to reach USD 3.40 billion by 2030 at a 2.40% CAGR, and units dip to 6.89 million in 2026 before returning to 7.40 million in 2030. The size is the standard fitment on Class 8 linehaul tractors and trailers, so its demand tracks long-haul freight volumes and the replacement cycle of steer, drive and trailer positions. A five-axle tractor-trailer carries 18 tire positions, and fleets that standardize on 295/75R22.5 across steer, drive and trailer axles concentrate purchasing on a single code.
The 11R22.5 accounts for 22.5% of truck and bus replacement units, an estimated 5.56 million tires and USD 2.25 billion in 2025, and is projected to reach USD 2.54 billion by 2030 at a 2.45% CAGR. Units fall to an estimated 5.15 million in 2026 and recover to 5.53 million by 2030. The conventional-profile size serves regional haul, vocational and bus fleets that favor load capacity and retreadability. The size remains the main fitment for older tractors, regional delivery trucks and transit buses, which keeps its share stable as the fleet renews. The size is valued at the market average of an estimated USD 405.56 per tire in 2025.
Truck and bus sizes outside the two leading fitments account for USD 4.75 billion, or 47.40% of 2025 value, and are projected to reach USD 5.37 billion by 2030 at a 2.48% CAGR. The group covers an estimated 11.71 million tires in 2025, falling to 10.85 million in 2026 and recovering to 11.66 million by 2030. It includes wide-base single tires for trailers and tractors, 19.5-inch and 24.5-inch fitments for vocational trucks, and bus and coach sizes, which carry higher assortment costs for dealers than the two leading codes. Bus and coach operators, refuse fleets and construction trucks rely on this group, which makes demand less dependent on long-haul freight than the two leading sizes. The group holds a 47.40% value share in 2030 as the size mix stays stable through the forecast period.
By Geography
North Central
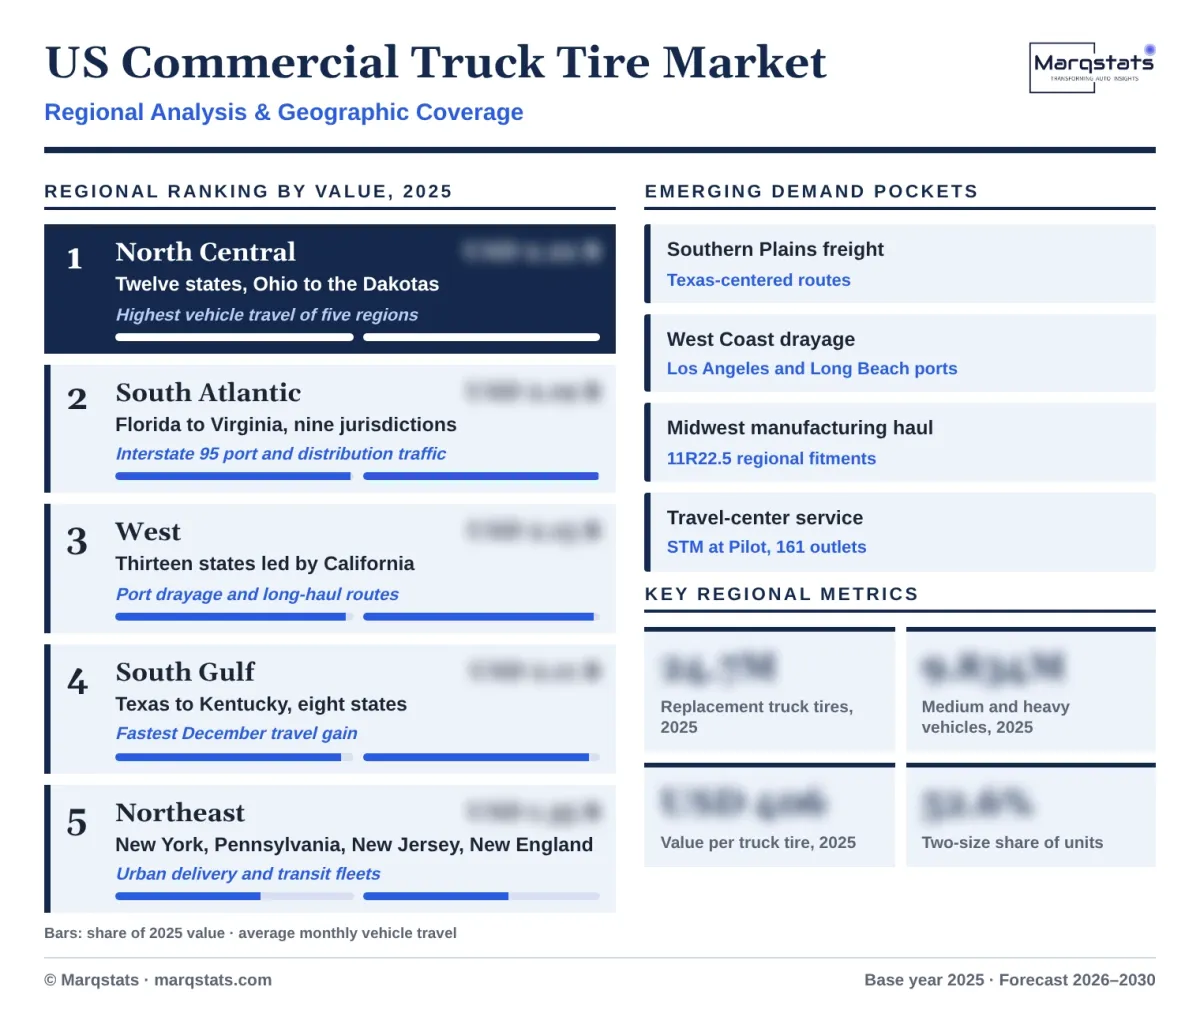
The North Central region is the largest regional market, accounting for 22.16% of 2025 value, or USD 2.22 billion, across twelve states from Ohio and Michigan to Kansas and the Dakotas. Average monthly vehicle travel of 63.53 billion miles in the sampled 2025 months is the highest of the five FHWA regions, and an estimated 5.47 million replacement truck tires were fitted in 2025 along the Interstate 80, 90 and 94 freight corridors. The region's twelve states include major manufacturing centers in Michigan, Ohio and Illinois, which generate regional haul demand for 11R22.5 fitments.
South Atlantic
The South Atlantic region accounts for 21.90% of 2025 value, or USD 2.19 billion, across Florida, Georgia, the Carolinas, Virginia, Maryland, Delaware, West Virginia and the District of Columbia. Travel is the most stable across seasons, with December 2025 only 3.7% below October, and the region supports an estimated 5.41 million replacement truck tires on port and distribution traffic along the Interstate 95 corridor. The region hosts the Goodyear plant in Fayetteville, North Carolina, scheduled to close by the end of 2027, and the Pirelli plant in Rome, Georgia.
West
The West region accounts for 21.41% of 2025 value, or USD 2.15 billion, across thirteen states led by California, Washington, Arizona and Colorado. An estimated 5.29 million replacement truck tires were fitted in 2025, supported by port drayage from the Ports of Los Angeles and Long Beach and long-haul routes across the Mountain states, which accumulate high annual mileage per tractor. California carries a large share of the region's truck activity, and drayage fleets serving the ports run high-mileage duty cycles on 295/75R22.5 fitments.
South Gulf
The South Gulf region accounts for 21.07% of 2025 value, or USD 2.11 billion, across Texas, Oklahoma, Louisiana, Arkansas, Mississippi, Alabama, Tennessee and Kentucky. December 2025 travel of 57.615 billion miles rose 1.5% year on year, the fastest December gain of the five regions, and an estimated 5.20 million replacement truck tires were fitted in 2025 on freight and energy-sector routes centered on Texas. Texas is the most populous state in the region, and Southern Tire Mart, LLC, headquartered in Columbia, Mississippi, anchors the regional dealer network.
Northeast
The Northeast region accounts for 13.46% of 2025 value, or USD 1.35 billion, across New York, Pennsylvania, New Jersey and the six New England states. Average monthly travel of 38.57 billion miles is the lowest of the five regions, and an estimated 3.32 million replacement truck tires were fitted in 2025, with urban delivery and transit bus fleets accounting for a large share of regional truck tire demand. Winter conditions raise demand for drive tires with deeper tread and severe-snow capability across the region's freight routes.
How Competition Is Evolving
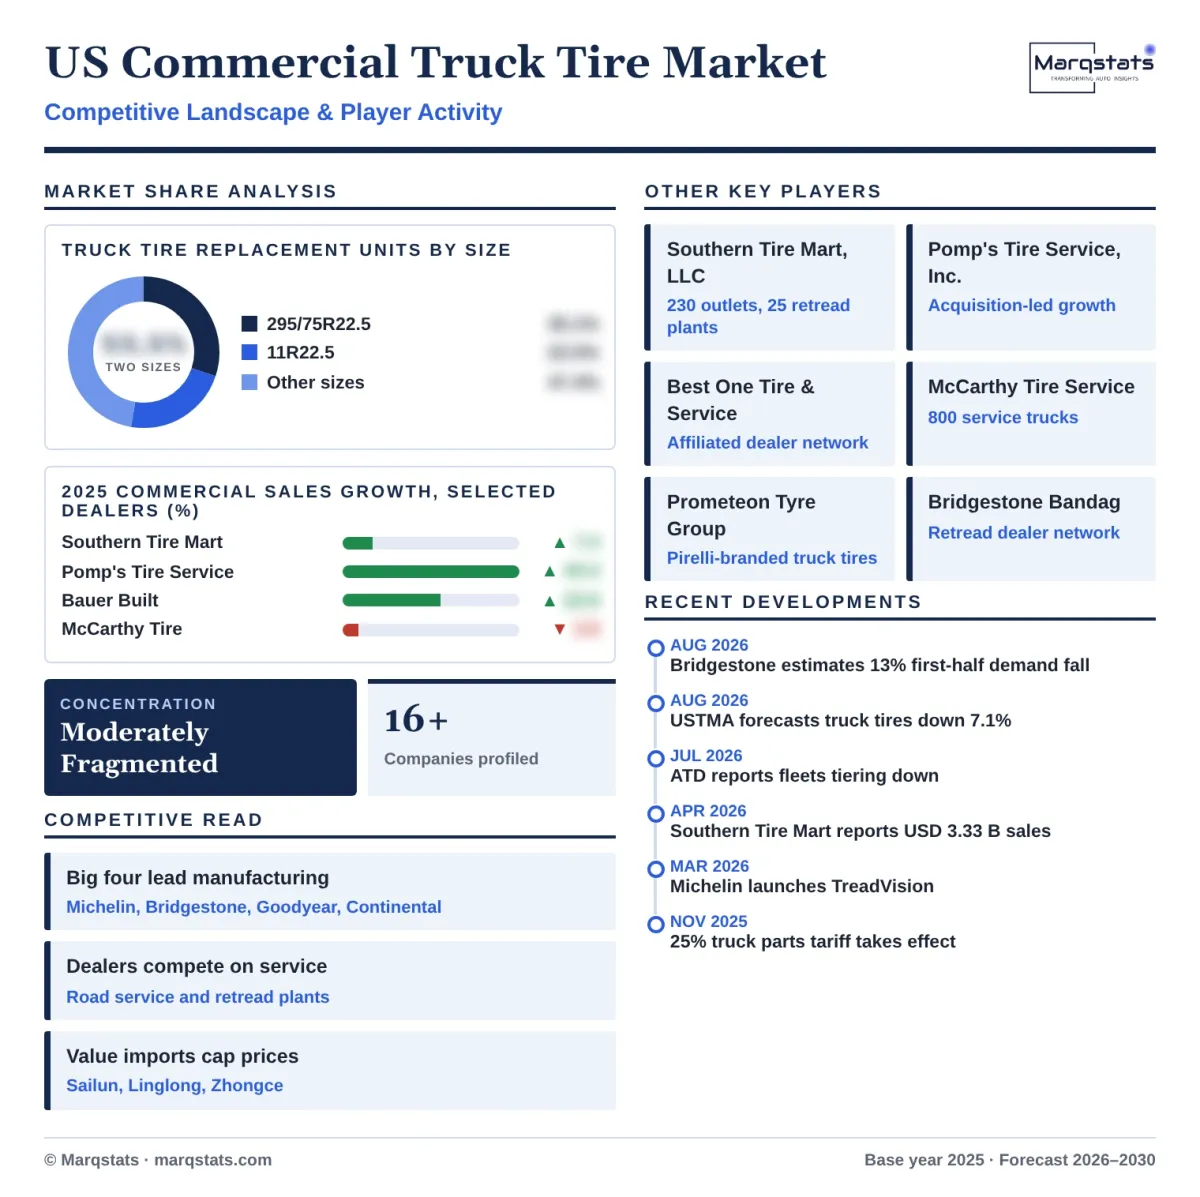
The US commercial truck tire market is moderately concentrated at the manufacturing level and consolidating at the dealer level. Compagnie Générale des Établissements Michelin SCA, Bridgestone Corporation, The Goodyear Tire & Rubber Company and Continental AG are the four largest global tire suppliers, with estimated 2025 tire revenue of USD 24.10 billion, USD 19.63 billion, USD 16.90 billion and USD 15.60 billion respectively, and each operates a truck tire and retread program in the United States. Bridgestone held its North American truck and bus replacement sales at 99% of the prior year in the first half of 2026 against an estimated 13% industry decline, a gain in share. Goodyear sells commercial tires and retreads through its Goodyear Commercial Tire and Service Centers network, and Bridgestone sells retreads through the Bandag dealer network.
Competition centers on cost per mile, casing value and service coverage rather than purchase price. Premium suppliers sell retreadable casings and fleet tire management, while value suppliers such as Sailun Group Co., Ltd., Shandong Linglong Tyre Co., Ltd., Zhongce Rubber Group Co., Ltd. and Prometeon Tyre Group S.r.l. compete on price in high-volume sizes such as 295/75R22.5 and 11R22.5. American Tire Distributors, Inc. and TBC Corporation report a shift toward tier-two to tier-four truck tires in 2026, and the 25% Section 232 duty on truck parts from November 2025 narrows the import price advantage. Fleets increasingly split purchases, buying premium tires for steer positions and lower-tier tires or retreads for trailer positions.
The commercial dealer channel is led by Southern Tire Mart, LLC with USD 3.33 billion of 2025 commercial sales, ahead of Pomp's Tire Service, Inc. at USD 1.15 billion, Best One Tire & Service at USD 1.05 billion and McCarthy Tire Service Company, Inc. at USD 556.8 million. Acquisitions drive much of the growth, as Pomp's grew 43.4% and Bauer Built 23.9% in 2025, and Southern Tire Mart operates 3,810 service trucks and 25 retread plants. Service Tire Truck Centers, Inc. reported USD 297.6 million and Boulevard Tire Center USD 310 million of 2025 commercial sales, which shows a long tail of regional fleet specialists behind the national leaders. Fleet tire upkeep software is covered in the Marqstats Fleet Tire Management Software Market report.
Companies Covered
Companies covered in the report include:
Recent Market Activity
Table of Contents
Coverage & Segmentation
The US commercial truck tire market comprises new replacement tires for medium and heavy trucks, tractors, trailers and buses sold in the United States, valued at retail in US dollars. The market excludes original equipment fitments, retreaded tires, light truck and passenger tires, off-the-road and agricultural tires, and installation, road service and other service revenue. Coverage uses a 2025 base year, a 2021–2025 historical period and a 2026–2030 forecast period, with 2026 as the estimated year. The parent market is covered in the Marqstats US Replacement Tire Market report.
Segmentation covers three size groups and five FHWA regions, with 16 companies profiled across manufacturing and commercial dealer layers. Replacement shipments are the primary series, the market value is a Marqstats estimate, and value is derived from shipments and the average value per truck tire, with the leading size codes 295/75R22.5 and 11R22.5 tracked separately. Retreading is covered separately, and scrap tire recovery is covered in the Marqstats End-of-Life Tire Market report.