Market Snapshot
Middle bar: base-year value × (1 + CAGR), rounded to two decimals. This is a calculated illustration, not a separately researched annual estimate.
The US commercial van upfitting market is estimated at USD 1,397.36 million in 2025 and is projected to reach USD 1,970.57 million by 2030, a CAGR of 7.12%, on completed van upfits rising from 249,651 to 286,157 at a 2.77% CAGR. Value growth therefore derives mainly from richer equipment packages and higher installed prices rather than from additional vans. The defining feature of the market is the gap between job count and value across end uses, as delivery and logistics fleets account for 40.00% of completed upfits but only 14.59% of value.
Market size and forecast figures are generated using Marqstats' proprietary estimation framework, updated as of October 2026. The estimate is constructed from published full-size van sales and installed package values by end use, and it is most sensitive to the share of cargo vans that receive an upfit and to the package mix bought by trades fleets.
Van upfitting covers the equipment and installation labour that convert an empty cargo van into a working vehicle, spanning shelving and storage, partitions, floors and wall liners, ladder racks, power systems, refrigeration and specialist interiors. Trades and field service fleets buy the richest packages and account for 55.44% of 2025 value, while delivery fleets fit simpler interiors at an average of about USD 2,041 a job against USD 6,746 for a trades van.
The van base held up through the 2025 and 2026 truck slowdown, with Ford, General Motors, Stellantis and Mercedes-Benz selling 348,831 full-size vans in the United States in 2025, excluding Ford E-Series cutaways, and the Ford Transit alone selling 161,797 units, up 5.9%. Transit sales of 78,925 in the first half of 2026 ran ahead of the 2025 record pace, which supports a 6.70% rise in upfit value to USD 1,490.92 million in 2026.
Coverage spans the United States across the South, West, Midwest and Northeast census regions, with segmentation by upfit type, end use and sales channel. Cutaway and box-body conversions, passenger and accessibility conversions and recreational camper vans fall outside the measure, which keeps the estimate additive to work truck upfitting rather than overlapping with it.
Key Takeaways
Market Overview & Analysis
Report Summary
Commercial van upfitting comprises the installation of working equipment inside and on top of a full-size cargo van, and the market spans four upfit types. Shelving and storage systems form the first; partitions, flooring and cargo protection form the second; ladder racks and exterior access form the third; and electrical, refrigeration and specialty equipment, including inverters, auxiliary batteries, lighting, refrigeration units and mobile-workshop fit-outs, forms the fourth. The scope includes installation labour, factory-installed trade packages and the transfer of equipment from an outgoing van to its replacement, while the van itself, cutaway and box-body conversions, passenger and wheelchair-accessible conversions and recreational camper vans are excluded.
No public body counts van upfits or publishes upfit penetration rates, so the market size is a Marqstats construction calibrated to published full-size van sales and to package values drawn from published equipment prices and installation times. Vehicle counts are published figures, whereas the cargo share, upfit penetration and package values are disclosed estimates, and retrofit, transfer and used-van jobs are sized in proportion to new-van upfits.
The forecast depends on three conditions, the first being that van sales hold close to 2025 levels, as Transit sales did in the first half of 2026. The second is installed price growth of about 3.5% in 2026 on steel and aluminium costs and about 2.5% a year thereafter, and the third is a rise in content per van of about 1.2% a year as power systems and specialty equipment spread across vocations. A sustained fall in trades employment would affect the richest packages first, and with them the end use that carries 55.44% of value.
The analysis is directed at equipment makers balancing trades revenue against delivery throughput, regional and national upfitters exposed to the growth of OEM factory packages, fleet operators specifying equipment for transfer between van generations and investors assessing suppliers across van and pickup platforms.
US Commercial Van Upfitting Market Size and Forecast
Volume is the anchor series, and value is derived from completed upfits and an average package value that rises from about USD 5,597 in 2025 to USD 6,886 in 2030, an increase of 4.24% a year. US commercial van upfitters, dealers and OEM programmes completed an estimated 249,651 van upfits in 2025, comprising 175,811 new-van upfits and 73,840 retrofit, transfer or used-van jobs, and each upfit is counted as one completed job on one van regardless of the number of components installed.
Completed upfits rise to 253,568 in 2026 and value to USD 1,490.92 million, followed by 262,639 upfits and USD 1,606.50 million in 2027 and 270,704 upfits and USD 1,722.57 million in 2028. The series reaches 279,009 upfits and USD 1,846.95 million in 2029 and 286,157 upfits and USD 1,970.57 million in 2030, a 2.77% compound annual growth rate in volume against 7.12% in value.
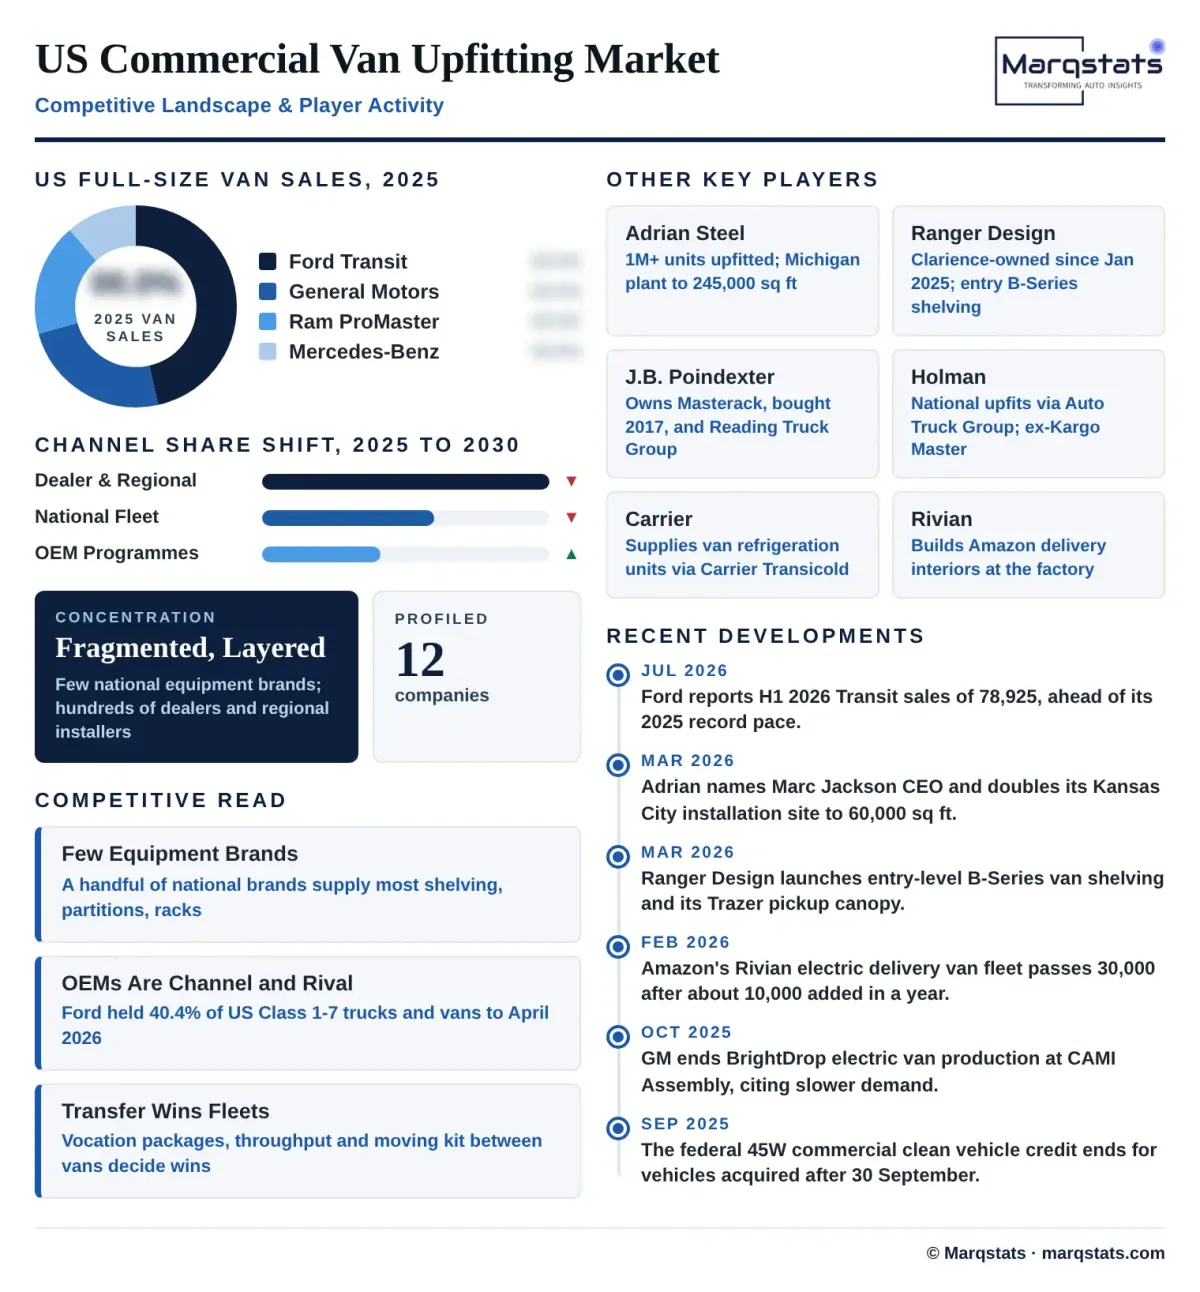
The Ford Transit anchors the full-size van base at 161,797 units in 2025 including the E-Transit, ahead of the Ram ProMaster at an estimated 62,806, the Chevrolet Express at 58,578, Mercedes-Benz vans at about 40,000 reported units, the GMC Savana at 20,679 and the Chevrolet BrightDrop at 4,971. An estimated 72% of these vans are sold in cargo configuration and about 70% of cargo vans receive an upfit, while Ford E-Series sales of 40,968 fall outside the base because most are cutaways that receive box bodies, which constitute a work truck upfit rather than a van interior.
New-van upfits average about USD 6,306 and retrofit or transfer jobs about USD 3,910, because many retrofits move existing shelving to a new van and are priced mainly on labour and brackets.
Delivery Vans Are Two in Five Upfits but One Dollar in Seven
Value in the US commercial van upfitting market is distributed unevenly across end uses. Delivery and logistics fleets account for 99,860 of 249,651 completed upfits in 2025, or 40.00%, but USD 203.86 million of USD 1,397.36 million in value, or 14.59%, whereas trades and field service fleets account for 46.00% of upfits and 55.44% of value and refrigerated and specialty conversions for 14.00% of upfits and 29.97% of value.
The package specification explains the gap, since a delivery fleet typically buys a partition, a floor and perhaps a single shelf unit at about USD 2,041 a job. A trades fleet buys a vocation-specific package instead, such as a Ranger Design HVAC shelving package for a low-roof Ford Transit that lists at USD 5,282.15 with an estimated 5.32 hours of installation before ladder racks or power are added, and a refrigerated conversion adds insulation and a refrigeration unit at an average of about USD 11,983.
Fleet count and revenue therefore point in different directions for equipment suppliers. Parcel and last-mile fleets offer volume and standardised specifications with thin margins per van, while trades fleets and specialty conversions carry the value, so a supplier that wins a national delivery account gains installation throughput and one that wins HVAC, plumbing and electrical contractors gains revenue.
The Truck Upfit Market Is More Than Twice the Van Market
Van upfitting represents the smaller half of light-duty upfitting. Adrian, one of the largest van equipment makers, stated in March 2026 that the pickup upfit market is roughly twice the size of the van market, and the Marqstats North America work truck upfitting estimate, which puts US light-duty Class 2b-3 truck upfits at about USD 3.29 billion in 2025, or about 2.4 times the US van figure, is consistent with that assessment.
The two markets are converging at the product level. Adrian launched an Open Bed Service Truck system and roll-up door at Work Truck Week 2026 to allow tradespeople to equip pickups without moving up to a larger service vehicle, and Ranger Design launched its Trazer canopy for pickups alongside its B-Series van shelving. Suppliers selling both van interiors and pickup storage can follow a fleet when it switches platforms, which makes cross-platform product lines a growing source of competitive advantage.
The boundary between the two measures is drawn so that they are additive. The US commercial van upfitting market counts equipment inside and on top of cargo vans, while service bodies, box bodies on cutaways and pickup canopies are counted in work truck upfitting, so the two estimates can be combined without double counting.
How the US Figure Compares with the North America Van Upfitting Estimate
The Marqstats North America Commercial Van Upfitting estimate, published in April 2026, places the regional market at USD 5.20 billion in 2025 and USD 9.85 billion by 2030, a 13.63% CAGR, and the difference from the US figure reflects definition rather than disagreement. The regional estimate covers Canada and Mexico as well as the United States, which it places at about 85% to 88% of the region, and it counts Class 3 chassis-cab vans, at roughly 45% to 50% of upfitted units, together with ambulance, accessible transit and mobile-workshop conversions and fully integrated telematics, EV-specific hardware and electrical builds worth USD 12,000 to USD 18,000 per vehicle.
The US estimate is confined to cargo-van interiors, with chassis-cab and cutaway bodies counted in the North America work truck upfitting estimate and passenger and accessibility conversions and separately purchased telematics hardware excluded. On units the two estimates agree, because a regional base of more than 400,000 upfitted vans a year, with Class 2 vans at 50% to 55% and the United States at 85% to 88%, implies roughly 170,000 to 194,000 US cargo-van upfits against 175,811 new-van upfits in the US measure.
The value gap therefore arises from scope rather than volume. The US share of the regional estimate equates to about USD 4.4 billion to USD 4.6 billion, of which the USD 1,397.36 million cargo-van interior layer is one component and the remaining USD 3.0 billion to USD 3.2 billion comprises chassis-cab bodies, vocational conversions and integrated electronics. The faster 13.63% growth rate of the regional estimate also reflects those electronics and EV hardware tiers, which fall outside the US measure.
Regulation and Costs That Shape a Van Upfit
A van upfitter that alters a completed vehicle assumes alterer duties under 49 CFR Parts 567 and 568, including keeping the vehicle within its gross vehicle and axle weight ratings and preserving required safety equipment. OEM body-builder guidelines restrict where installers may drill and attach equipment, and partitions and shelving must leave airbag and restraint clearances intact, requirements that favour upfitters with tested, vehicle-specific kits over one-off installations.
The incentive and tariff environment shifted in 2025 and 2026, as the federal 45W commercial clean vehicle credit became unavailable for vehicles acquired after 30 September 2025, removing a subsidy that had supported electric delivery van orders. Steel, aluminium and derivative tariffs were adjusted again in June 2026, raising input costs for steel shelving and aluminium racks, and installed prices are estimated to rise 3.5% in 2026 as a result.
The installed price of a van upfit reflects five cost layers, namely the core interior of shelving, partitions, drawers and floor; exterior access such as ladder racks and steps; electrical and specialist equipment such as inverters, auxiliary batteries, lighting and refrigeration; vehicle-specific fitment, wiring and safety checks; and delivery, downtime, financing and equipment transfer at replacement. Factory trade packages are less costly to fit, and a Ford dealer guide places Transit factory trade packages at about USD 1,500 to USD 3,500 over the base cargo van price.
Market Dynamics
Key Drivers
Five demand forces support growth in the US commercial van upfitting market through 2030, anchored by a stable full-size van base and richer trades packages.
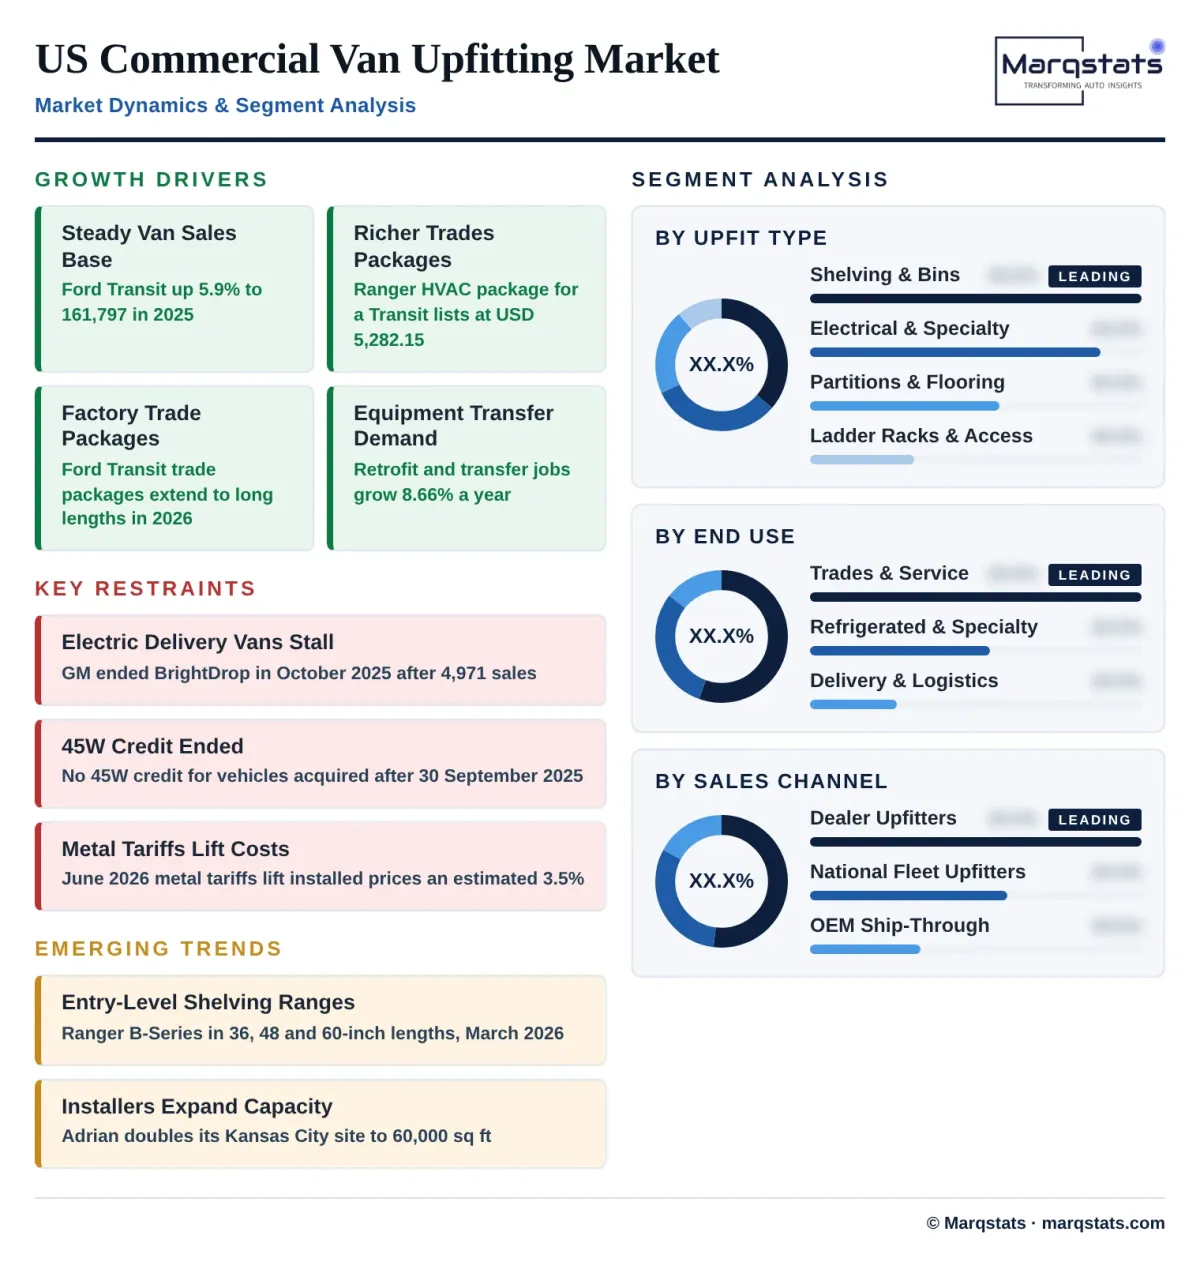
- A steady and expanding full-size cargo van sales base. Ford Transit sales rose 5.9% to 161,797 in 2025 and Chevrolet Express sales rose to 58,578 from 44,221, while Transit sales of 78,925 in the first half of 2026 ran ahead of the 2025 record pace.
- Demand from trades fleets for richer vocation-specific packages. HVAC, plumbing and electrical contractors specify vocation-specific shelving, bins, racks and power, and a single HVAC package for a low-roof Transit lists at USD 5,282.15 before installation.
- OEM factory trade packages moving upfit into the vehicle order. Ford offers Electrician, HVAC, General Contractor and Shelving trade packages on Transit, available in extended long-length configurations for 2026, which simplifies ordering for small fleets.
- Equipment transfer and used-van retrofit adding steady demand. Retrofit, transfer and used-van jobs grow at 8.66% a year, faster than new-van upfits, as fleets move modular equipment to replacement vans at the end of each van cycle.
- Rising electrical power demand inside the working van. Ford Transit offers Pro Power Onboard of up to 2.4 kW and a 250-amp dual alternator, and fleets add inverters and auxiliary batteries for tools, refrigeration and idle-free operation.
Key Restraints
Four constraints restrain the market, two of which stem from the withdrawal of federal support for electric vans during 2025.
- Loss of momentum in dedicated electric delivery vans. GM ended BrightDrop production at CAMI Assembly in October 2025, citing slower demand and the end of US tax credits, which removed a dedicated delivery platform after 4,971 sales in 2025.
- Expiry of the 45W commercial clean vehicle credit in 2025. The credit ended for vehicles acquired after 30 September 2025, removing an incentive that had supported electric van orders and their specialised upfits.
- Metal tariffs raising the cost of shelving and racks. Steel, aluminium and derivative tariff changes in June 2026 increase the cost of steel shelving and aluminium ladder racks, and fleets resist price increases in national contracts.
- Basic package specifications in high-volume parcel and delivery fleets. Delivery and logistics upfits average about USD 2,041, and large parcel fleets negotiate national pricing that limits upfitter margin on 40.00% of jobs.
Key Trends
Four structural shifts are changing how commercial van upfits are specified, priced and installed in the United States.
- Entry-level product ranges introduced by established van shelving suppliers. Ranger Design launched its B-Series shelving in March 2026 in 36, 48 and 60-inch lengths for low and high-roof vans, aimed at an accessible price point.
- Expansion of installation and production capacity by equipment makers. Adrian announced in March 2026 that it is doubling its Kansas City installation facility to 60,000 square feet and expanding its Adrian, Michigan plant to 245,000 square feet.
- Ownership consolidation of van equipment brands under larger groups. Clarience Technologies acquired Ranger Design in January 2025, combining van shelving with lighting, camera and telematics brands sold through more than 250 resellers.
- Growth of captive electric delivery fleets outside the dealer channel. Amazon had more than 30,000 Rivian delivery vans on the road by February 2026, with interiors specified at the factory rather than upfitted after delivery.
Strategic Implications
- Revenue from trades and throughput from delivery for equipment makers. Trades fleets carry 55.44% of value, whereas delivery fleets carry 40.00% of jobs but only 14.59% of value, so the two end uses reward different commercial models.
- Speed of delivery as the defence of the dealer channel for regional upfitters. Dealer and regional upfitters hold 51.90% of value but are losing share to OEM factory packages, which grow at 10.80% a year.
- Modular and transferable equipment specifications for national fleets. Retrofit and transfer jobs average about USD 3,910 against USD 6,306 for a new upfit, so equipment that moves to the next van reduces lifecycle cost.
- Supplier coverage of both van and pickup platforms for investors. The pickup upfit market is about twice the van market, and fleets switching platforms favour suppliers able to serve both.
Market Segmentation
Shelving and storage systems form the largest upfit type at USD 505.88 million in 2025, or 36.20% of value, rising at a 7.04% CAGR to USD 710.79 million, or 36.07% of value, by 2030. Steel and aluminium shelving, drawer units and bins dominate trades upfits, where a full HVAC package can exceed USD 5,000 before installation.
Partitions, flooring and cargo protection account for USD 289.85 million in 2025, or 20.74% of value, and grow at a 6.75% CAGR to USD 401.81 million, or 20.39% of value, by 2030. The type forms the core of delivery upfits, which typically combine a bulkhead, a floor and wall liners.
Ladder racks and exterior access account for USD 158.01 million in 2025, or 11.31% of value, rising at a 7.11% CAGR to USD 222.76 million, or 11.30% of value, by 2030. Drop-down and roof racks are standard specifications on electrical, telecom and general contractor vans.
Electrical, refrigeration and specialty equipment is valued at USD 443.62 million in 2025, or 31.75% of the market, and grows fastest among upfit types at a 7.44% CAGR to USD 635.21 million, or 32.23% of value, by 2030. Inverters, auxiliary batteries, lighting, refrigeration units and mobile-workshop fit-outs gain share as electrical power demand inside the van rises.
Trades and field service fleets form the largest end use at USD 774.69 million in 2025, or 55.44% of value, rising at a 7.18% CAGR to USD 1,095.80 million, or 55.61% of value, by 2030. These fleets completed 114,840 upfits in 2025 at an average of about USD 6,746, buying vocation-specific packages for HVAC, plumbing, electrical and general contracting.
Delivery and logistics fleets account for USD 203.86 million in 2025, or 14.59% of value, and grow at a 5.58% CAGR, the slowest rate among end uses, to USD 267.48 million, or 13.57% of value, by 2030. They completed 99,860 upfits in 2025, mostly partitions, floors and basic shelving at about USD 2,041 a job.
Refrigerated and specialty conversions are valued at USD 418.81 million in 2025, or 29.97% of the market, and grow fastest among end uses at a 7.71% CAGR to USD 607.29 million, or 30.82% of value, by 2030. Refrigerated food and pharmaceutical delivery, mobile service and utility vans averaged about USD 11,983 a job across 34,951 upfits in 2025.
OEM factory and ship-through programmes account for USD 240.63 million in 2025, or 17.22% of value, and grow fastest among channels at a 10.80% CAGR to USD 401.81 million, or 20.39% of value, by 2030. Factory trade packages and approved ship-through upfitters allow fleets to order a finished van on a single invoice.
Dealer and regional upfitters form the largest channel at USD 725.29 million in 2025, or 51.90% of value, rising at a 6.19% CAGR to USD 979.14 million, or 49.69% of value, by 2030. Dealers stock upfitted vans for small trades buyers, while regional upfitters handle custom and retrofit work.
National fleet upfitters account for USD 431.44 million in 2025, or 30.88% of value, and grow at a 6.45% CAGR to USD 589.62 million, or 29.92% of value, by 2030. National programmes standardise specifications across multiple locations, which places them at the centre of delivery and utility fleet procurement.
By Geography
South
The South is the largest and fastest-growing region at USD 566.90 million in 2025, or 40.57% of value, rising at a 7.46% CAGR to USD 812.53 million, or 41.23% of value, by 2030. Census Bureau estimates put its population at 133.8 million in July 2025, up 6.0% since 2020 and the fastest growth of any region, which expands demand from trades and delivery fleets in Texas, Florida and the Southeast.
West
The West accounts for USD 323.17 million in 2025, or 23.13% of value, and grows at a 7.04% CAGR to USD 454.03 million, or 23.04% of value, by 2030. Its population of 80.1 million grew 1.9% between 2020 and 2025, and California fleet rules and electric delivery deployments raise demand for power and specialty equipment.
Midwest
The Midwest accounts for USD 275.62 million in 2025, or 19.72% of value, and grows at a 6.82% CAGR to USD 383.37 million, or 19.45% of value, by 2030. The region has a population of 69.8 million and hosts substantial van equipment production, including Adrian in Michigan and its expanding Kansas City installation facility.
Northeast
The Northeast accounts for USD 231.67 million in 2025, or 16.58% of value, and grows at a 6.72% CAGR, the slowest rate among regions, to USD 320.64 million, or 16.27% of value, by 2030. Its population of 58.0 million grew only 0.7% between 2020 and 2025, although dense urban delivery and utility networks sustain demand for partitions, racks and specialty fit-outs.

How Competition Is Evolving
The US commercial van upfitting market is fragmented at the installation level and more concentrated at the equipment level, with a small group of national equipment brands supplying most branded shelving, partitions and racks and hundreds of dealers and regional upfitters installing them. Van upfit market shares could not be sourced from any public disclosure, so competition is assessed across three layers comprising equipment makers, national installers and OEM programmes.
Among equipment makers, Adrian Steel Company reports that it has upfitted more than one million units and is expanding production and installation capacity, while Clarience Technologies acquired Ranger Design in January 2025 and added entry-level B-Series shelving in March 2026. The Masterack brand, acquired in 2017, sits within J.B. Poindexter & Co., which also owns Reading Truck Group. The Knapheide Manufacturing Company competes with enclosed service bodies that can replace a van for some trades, and Holman runs national design, manufacturing and installation through Auto Truck Group, having absorbed the legacy Kargo Master brand. Refrigeration units come mainly from Carrier Global Corporation through Carrier Transicold and from Trane Technologies plc through Thermo King.
Vehicle manufacturers act as both channel and competitor, led by Ford Motor Company, which offers factory trade packages and ship-through upfitting on Transit and held a 40.4% share of the US Class 1-7 commercial truck and van segment through April 2026. Stellantis N.V., General Motors Company and Mercedes-Benz Group AG run their own upfit programmes, and Amazon delivery interiors are built at the factory by Rivian Automotive, Inc. Competition among upfitters turns on vocation-specific packages, installation throughput, OEM programme approval and the ability to transfer equipment between vans.
Companies Covered
Companies covered in the report include:
Recent Market Activity
Table of Contents
Coverage & Segmentation
Coverage spans the US commercial van upfitting market across the South, West, Midwest and Northeast census regions, with 2025 as the base year, 2021 to 2025 as the historical period and 2026 to 2030 as the forecast period. Value is expressed in USD million of equipment and installation revenue, excluding the van, sales tax and freight, and volume in completed upfits, with segmentation across four upfit types, three end uses and three sales channels and twelve companies profiled.
Cutaway and box-body conversions on vans such as the Ford E-Series, which are counted in work truck upfitting, passenger and wheelchair-accessible conversions, recreational camper vans and loose accessories sold without installation fall outside the scope. Van sales draw on automaker releases, with Ram ProMaster volumes taken from a secondary sales tracker and Mercedes-Benz volumes from a rounded company figure, and regional shares are weighted by Census Bureau Vintage 2025 population estimates.
Two related Marqstats estimates apply broader definitions, with North America Commercial Van Upfitting adding Canada, Mexico, Class 3 chassis-cab vans, vocational conversions and integrated electronics and North America Refrigerated Van Conversion covering refrigerated vans and light trucks across the region. Neither figure is directly comparable with the US cargo-van interior measure.