Market Snapshot
Middle bar: base-year value × (1 + CAGR), rounded to two decimals. This is a calculated illustration, not a separately researched annual estimate.
The global skeletal trailer market, covering skeletal and container chassis trailers, is estimated at USD 1,914.09 million in 2025 and is projected to reach USD 2,810.92 million by 2030, a CAGR of 7.99%, on new chassis deliveries rising from 139,570 to 173,868 units at a 4.49% CAGR. The distinguishing feature of the market is the amplitude of the US purchase cycle, in which apparent consumption fell 74.4% in 2024 even as world container traffic grew, and the recovery from that trough makes North America the fastest-growing region at 11.43% a year.
Market size and forecast figures are generated using Marqstats' proprietary estimation framework, updated as of October 2026. The estimate is constructed from regional delivery volumes, anchored in the United States to trade commission consumption data, and from regional average selling prices, and it is most sensitive to the timing of US chassis pool fleet renewal.
The market covers new road chassis built to carry ISO and domestic containers, comprising fixed skeletal chassis, extendable and multi-length chassis and tank-container and specialty chassis in 20-foot, 40-foot and 45-foot or 53-foot sizes, and it excludes flatbed trailers, container side-lifters, terminal-only yard chassis, refurbished chassis and chassis rental revenue. Europe is the largest region by value at 30.09%, whereas China is the largest by units at 35.82% but accounts for only 18.29% of value, because a Chinese skeletal chassis sells for about USD 7,000.
US demand sets the cyclical profile of the global market. Apparent consumption of in-scope chassis in the United States fell from 79,126 units in 2022 to 16,214 in 2024, including a 74.4% decline in 2024 alone, as pool operators absorbed equipment bought during the pandemic import surge. The antidumping duties imposed in June 2026 on chassis from Mexico, Thailand and Vietnam raise landed prices and favour domestic builders as fleets begin to renew.
Key Takeaways
Market Overview & Analysis
Report Summary
A skeletal trailer, also termed a container chassis or intermodal chassis, is a semi-trailer frame fitted with corner twistlocks that carries a shipping container in place of a body, so that the container itself forms the cargo space. Chassis move containers between ports, rail terminals, inland container depots and customer sites in the activity known as drayage. Fixed chassis carry a single container length, whereas extendable, sliding and multi-length chassis adjust to carry 20-foot, 30-foot, 40-foot or 45-foot boxes, and specialty designs carry tank containers or mount a generator set for refrigerated boxes.
No public source reports a global chassis total, and the strongest hard evidence comes from the US International Trade Commission, whose 2026 investigation reported US apparent consumption of 79,126 chassis in 2022, 63,343 in 2023 and 16,214 in 2024, worth USD 271.72 million in 2024. Manufacturers such as CIMC Vehicles, which sold 112,159 semi-trailers in 2025, report broad semi-trailer volumes without separating chassis. The global skeletal and container chassis trailer market is a Marqstats construction assembled region by region, comprising about 18,000 chassis in North America, 18,000 in Europe, 50,000 in China, 14,520 in India, 1,050 in South Africa and 38,000 in other markets in 2025.
The India figure matches the skeletal and container chassis segment of the Marqstats India truck trailer estimate, with fiscal year 2026 data aligned to calendar 2025, and the South Africa figure represents half of the skeletal, low-bed and specialized segment of the Marqstats South Africa truck trailer estimate. Value is measured as manufacturer revenue at regional prices benchmarked to USITC data, dealer listings and supplier price guides.
Skeletal Trailer Market Size and Forecast
Volume is the anchor series for the skeletal trailer market, and value is derived from regional delivery volumes and a weighted average selling price that rises from about USD 13,714 per chassis in 2025 to USD 16,167 in 2030. Manufacturers delivered an estimated 139,570 new skeletal and container chassis worldwide in 2025, and deliveries are forecast to reach 173,868 by 2030, a 4.49% compound annual growth rate, while market value rises from USD 1,914.09 million to USD 2,810.92 million at 7.99% a year.
The annual path runs through 146,014 chassis and USD 2,088.08 million in 2026, 153,666 chassis and USD 2,277.18 million in 2027 and 160,734 chassis and USD 2,454.68 million in 2028. It continues to 167,311 chassis and USD 2,629.28 million in 2029 before reaching 173,868 chassis and USD 2,810.92 million in 2030.
Value grows faster than units in the early forecast years. In 2026 value rises 9.09% to USD 2,088.08 million, above the USD 2,067.03 million implied by the constant-growth path, because duty-paid US prices rise and European trailer sales recover, and unit growth peaks at 5.24% in 2027 as US pool operators resume orders before settling near 4% a year.
The rise in average chassis value reflects mix more than list-price escalation. North America and Europe, where chassis cost two to five times as much as in China, grow faster than China across the forecast, and extendable chassis gain share from fixed designs as operators standardise on units that carry more than one container length.
The US Chassis Cycle Swings Harder Than Container Traffic
Chassis purchases in the United States follow fleet stock rather than container volumes from one year to the next. During the 2021 to 2022 import surge, dwell times at US ports and rail ramps lengthened, chassis remained under containers for days and pool operators bought heavily, lifting apparent consumption to 79,126 units in 2022. When the surge subsided, dwell times fell, idle chassis returned to the pools and purchases collapsed to 16,214 units in 2024, even though world container port throughput grew 6.9% that year.
The purchase trough had not reversed by the end of September 2025, when US consumption for the first nine months stood at 11,541 units, down 1.9% from 11,767 in the same period of 2024. North American deliveries are estimated at 18,000 chassis in 2025, of which about 16,000 are in the United States and the balance in Canada and Mexico, and are forecast to recover gradually, rising about 5% in 2026, 12% in 2027 and 10% in 2028 as chassis bought in 2021 and 2022 age and pools replace older units. North American value consequently grows at 11.43% a year to USD 541.08 million by 2030.
Dwell time is the mechanism behind the amplitude of the cycle. A terminal handling 1,000 road container moves a day, with chassis remaining under a container for two days on average and 85% of the fleet available, requires about 2,353 chassis, and if average occupancy rises to three days the requirement increases to about 3,530, some 1,177 more, with no change in cargo volume. Modest changes in congestion therefore move chassis demand far more than changes in container volume, and fleets planned on throughput alone tend to over-buy in a surge and under-buy in a recovery.
Container Chassis Pricing and Cost Structure
Container chassis prices vary widely by region and by design. USITC data put the average in-scope chassis in the United States at about USD 16,758 in 2024, and dealer listings show a new 2025 Gallegos 40-foot tandem chassis at USD 16,900 and a new 2025 Cheetah 40-foot tri-axle combo chassis at USD 43,900. Chinese suppliers quote USD 5,000 to USD 13,000 free on board for container chassis before freight, duties and certification, while Indian suppliers advertise 40-foot skeletal trailers at INR 7 lakh to INR 12 lakh.
Average selling prices in 2025 stand at about USD 17,500 in North America, USD 32,000 in Europe, USD 7,000 in China, USD 10,526 in India, USD 25,000 in South Africa and USD 13,000 in other markets. European prices are the highest because extendable chassis, air suspension, disc brakes and electronic braking systems are standard specifications, and since each figure is a regional average, a global price requires volume weighting rather than a simple average of the regional benchmarks.
The frame and twistlocks, axles, suspension, brakes, tyres, landing gear, lights and paint account for most of the ex-works price of a chassis, and steel prices are the principal source of cost variation. Extendable models add sliding mechanisms and locking pins, and delivered cost adds freight, import duties, approval and finance. Rental adds a further layer of cost for chassis users, with DCLI publishing daily market rates of about USD 28.55 to USD 47.50 per day depending on region, and at its Gulf rate of USD 34.05 a day each additional billable day adds USD 34.05 to a shipment before other charges.
Trade Remedies and Regulation
Trade policy has become a defining influence on the US chassis market. Cheetah Chassis Corporation and Stoughton Trailers filed antidumping and countervailing duty petitions against chassis from Mexico, Thailand and Vietnam in February 2025, and in April 2026 the Commerce Department set final dumping margins of 32.37% for Mexico, 72.85% to 129.63% for Thailand and 186.84% for Vietnam, together with subsidy rates of 76.91% for Mexico and 9.65% to 10.72% for Thailand. The ITC found injury in May 2026 and the orders took effect in June 2026, adding to the orders that chassis from China have faced since 2021.
Mexico was the largest import source, and the petitioners cited USD 950.2 million of 2024 imports from Mexico under the tariff lines in scope, which also capture subassemblies and other trailer frames. Commerce set the antidumping cash deposit for Mexico at zero after offsetting export subsidies, but the 76.91% countervailing duty still applies. The orders raise the cost and risk of imported chassis, giving domestic builders greater pricing power and leaving pool operators with higher replacement costs.
Further regulation adds cost in every major market. In the United States, the FMCSA requires intermodal equipment providers to register, mark their chassis and operate inspection, repair and defect-response systems, and new heavy trailer chassis can attract the 12% federal excise tax on first retail sale. Indian skeletal trailers require AIS-113 approval, and South African heavy trailers must comply with VC8027 and road mass limits.
Pools, Lessors and Fleet Economics
Chassis ownership differs sharply by region, and the US model is distinctive. Ocean carriers in the United States withdrew from providing chassis over the past decade and pool operators and lessors took their place, with DCLI owning or managing more than 270,000 chassis and TRAC Intermodal serving motor carriers at more than 450 start and stop locations. These pools buy in large batches, standardise specifications and use their purchasing power to press manufacturers on price, and chassis pools and lessors account for an estimated 70% of North American chassis units.
Outside North America, trucking and drayage fleets own most chassis. Hauliers in Europe, China, India and South Africa buy chassis together with their tractors and operate them on dedicated port or rail routes, and trucking and drayage fleets accounted for USD 1,314.38 million, or 68.67% of global value, in 2025. Pools and lessors nonetheless grow faster, at 9.87% a year, because the US recovery is concentrated in pool purchases.
Pool economics reward utilisation rather than low acquisition cost, because a pool earns rental per day, and faster turns and accurate tracking therefore matter more than purchase price. Telematics, standardised parts, corrosion protection and quick repair raise the share of the fleet available for rent, and the location-specific USD 400 drop-off charge that TRAC applied in its metro market from March 2026 shows how pools use fees to steer chassis back to where demand is.
Demand by Haulage Stream
Container chassis demand derives from three haulage streams, of which port drayage is the largest, moving import and export boxes between terminals, warehouses and distribution centres. Port drayage follows container throughput, which reached an estimated 994 million TEU worldwide in 2025, up about 6.5%.
Rail and inland depot drayage forms the second stream, moving boxes over the first and last miles of rail journeys. India's Jawaharlal Nehru Port Authority handled 3,826,820 TEU in April to August 2026, up 15.45%, and its rail and road links are a principal driver of Indian skeletal chassis demand.
Domestic intermodal, the third stream, is concentrated in North America, where 53-foot domestic containers ride on 53-foot chassis between rail ramps and shippers. That concentration explains why the 45-foot and 53-foot size segment holds 25.04% of global value and grows at 9.57% a year. Shipping lines, terminals and specialist users such as tank-container operators account for the remainder of demand, at USD 208.00 million in 2025.
Market Dynamics
Key Drivers
Five demand and policy factors support growth in the global skeletal trailer market through 2030.
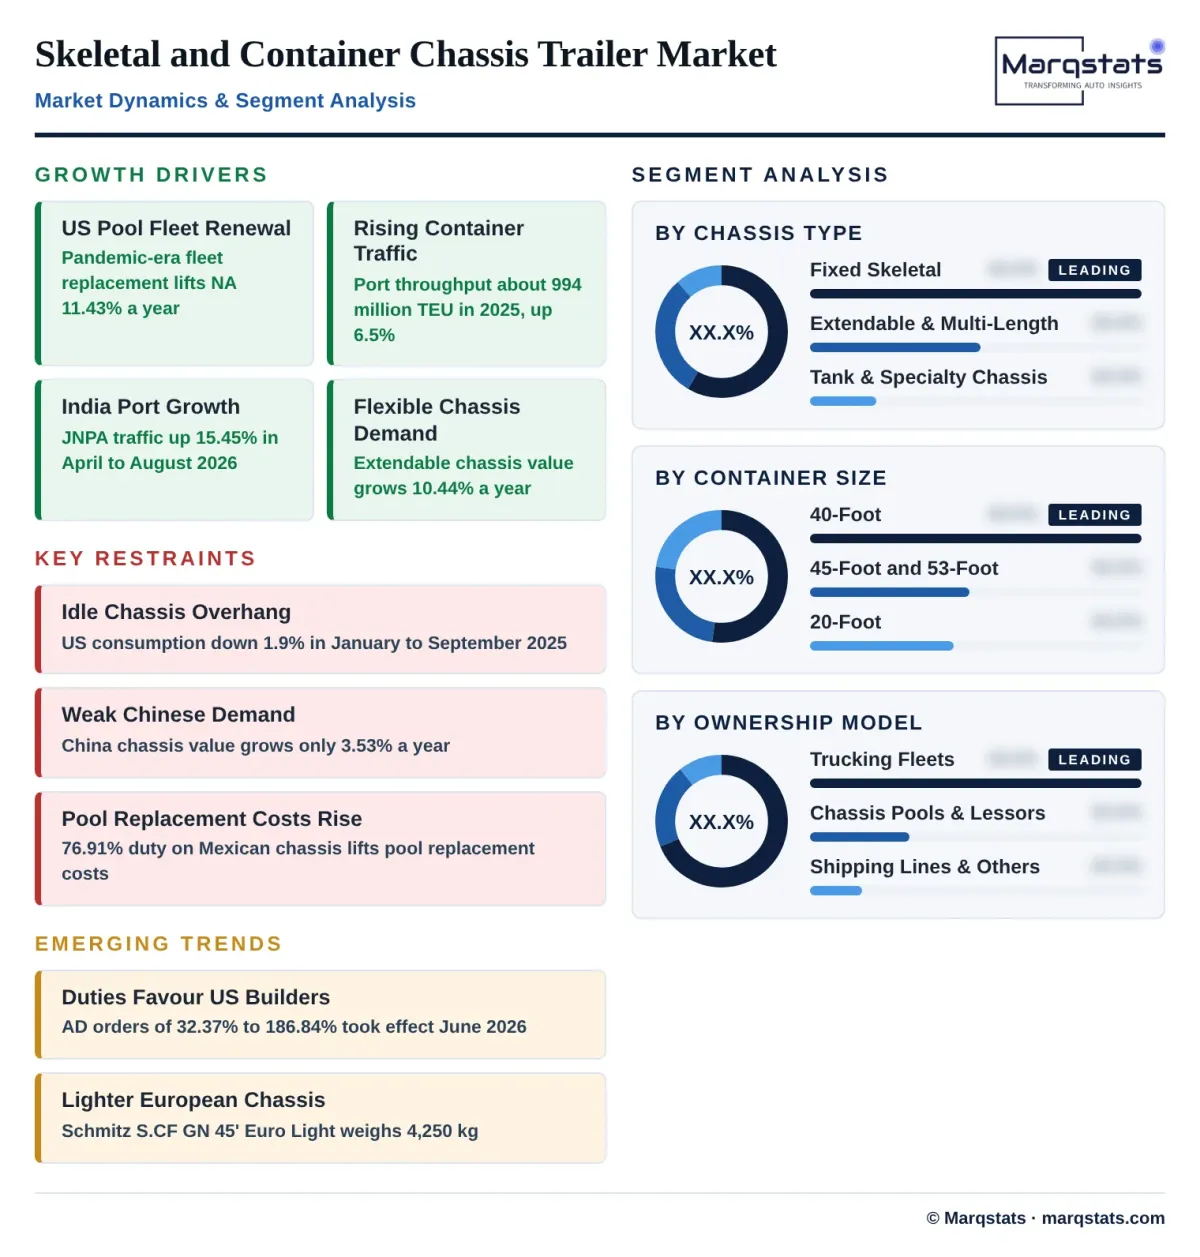
- US fleet renewal. US chassis purchases fell to 16,214 units in 2024, and replacement of pandemic-era pool fleets from 2026 drives North American value growth of 11.43% a year to USD 541.08 million by 2030.
- Container traffic growth. Global container port throughput reached about 994 million TEU in 2025, up about 6.5%, adding drayage demand at ports and inland depots across every region.
- India port growth. Traffic at the Jawaharlal Nehru Port Authority rose 15.45% in April to August 2026, and Indian skeletal chassis value grows at 10.91% a year to USD 256.50 million by 2030.
- Flexible chassis designs. Extendable and multi-length chassis grow at 10.44% a year between 2025 and 2030, because a single unit can carry 20-foot, 40-foot and 45-foot boxes on mixed routes.
- Trade protection in the United States. Duties of 32.37% to 186.84% on imports from Mexico, Thailand and Vietnam, in effect since June 2026, raise landed prices and favour domestic builders through the replacement cycle.
Key Restraints
Four constraints moderate growth, most of them rooted in fleet efficiency and the US purchase cycle.
- Fleet overhang from the 2021 to 2022 surge. Idle chassis bought during the import surge kept US consumption 1.9% lower year on year in January to September 2025, at 11,541 units.
- Weak Chinese demand. China grows at only 3.53% a year in value to 2030, the slowest of any region, because its domestic drayage fleets are large and mature and chassis prices are low at about USD 7,000.
- Rail and pooling efficiency. Faster turns and shared pools allow operators to move more containers without buying more chassis, as the 2024 collapse in US purchases to 16,214 units against 6.9% growth in world port throughput demonstrated.
- Refurbishment of older chassis. Pools rebuild and re-certify older chassis rather than replacing them, which delays new purchases in a market where US consumption remained far below the 2022 peak of 79,126 units through 2025.
Key Trends
Four trends are reshaping the container chassis supply base.
- Domestic sourcing in the United States. The antidumping orders in effect from June 2026 shift purchasing toward US builders such as Cheetah Chassis and Stoughton Trailers, which filed the original petitions in February 2025.
- Underride and safety upgrades. In June 2025 the Stoughton 53-foot intermodal chassis became the first chassis to earn the IIHS Toughguard award for rear underride protection, bringing crash safety into chassis specification decisions.
- Lightweight chassis designs. European chassis such as the Schmitz Cargobull S.CF GN 45' Euro Light, at a tare weight of 4,250 kg, reduce unladen mass in order to raise payload within gross weight limits.
- Chinese exporters in emerging markets. CIMC Vehicles reported 15% growth in North American semi-trailer sales and 20% growth in Global South markets in 2025, extending Chinese supply into markets with low duty barriers.
Strategic Implications
- Capacity for the pool replacement cycle. US builders adding capacity for the 2027 to 2028 pool replacement cycle stand to benefit while duties of up to 186.84% limit import competition.
- Dwell-based fleet planning. Pool operators that plan purchases on dwell time and fleet age rather than on container throughput alone avoid the over-buying that preceded the 2024 collapse to 16,214 units.
- Premium extendable and lightweight designs. European builders gain most from extendable and lightweight chassis, where premium specifications support prices above USD 30,000 per unit.
- Export focus on low-barrier markets. Asian exporters are best placed in Africa, the Middle East and South-East Asia, where duty barriers are low and port volumes are rising, with other markets growing at 7.64% a year to USD 713.67 million by 2030.
Market Segmentation
Fixed skeletal chassis are the dominant type at USD 1,117.31 million, or 58.37% of 2025 value, from 100,530 units. Value grows at 6.70% a year to USD 1,544.94 million and the share of value declines to 54.96% by 2030 as extendable designs gain ground, although the type remains the standard choice on dedicated routes in China, India, North America and emerging markets, where low price and simple maintenance carry most weight.
Extendable and multi-length chassis account for USD 572.89 million, or 29.93% of 2025 value, from 25,979 units, and are the fastest-growing type at 10.44% a year to USD 941.18 million by 2030. They dominate in Europe and are gaining share in US pools, because a single chassis can serve mixed container lengths.
Tank-container and specialty chassis account for USD 223.89 million, or 11.70% of 2025 value, from 13,061 units, and grow at 7.72% a year to USD 324.80 million by 2030. The segment includes tank-container chassis, tipping container chassis and chassis with generator mounts for refrigerated boxes.
20-foot chassis account for USD 434.90 million, or 22.72% of 2025 value, from 40,050 units, and grow at 6.76% a year to USD 603.18 million by 2030. They are common in India, South-East Asia and Africa, where heavy 20-foot boxes carry dense cargo.
40-foot chassis are the largest size segment at USD 999.93 million, or 52.24% of 2025 value, from 76,389 units, and grow at 7.73% a year to USD 1,450.82 million by 2030. The 40-foot box is the standard unit of global trade, so these chassis lead in every region.
45-foot and 53-foot chassis account for USD 479.26 million, or 25.04% of 2025 value, from 23,131 units, and grow at 9.57% a year to USD 756.92 million by 2030. Domestic 53-foot intermodal traffic in North America and 45-foot pallet-wide boxes in Europe drive the segment.
Chassis pools and lessors account for USD 391.71 million, or 20.46% of 2025 value, from 23,157 units, and are the fastest-growing ownership model at 9.87% a year to USD 627.08 million by 2030. Most of this demand originates in the United States, where pools supply the majority of marine and domestic chassis.
Trucking and drayage fleets are the largest buyer group at USD 1,314.38 million, or 68.67% of 2025 value, from 100,730 units, and grow at 7.44% a year to USD 1,881.29 million by 2030. Fleet ownership dominates in Europe, China, India and South Africa, where hauliers buy chassis with their tractors for dedicated port and rail routes.
Shipping lines, terminals and other buyers account for USD 208.00 million, or 10.87% of 2025 value, from 15,683 units, and grow at 7.78% a year to USD 302.55 million by 2030. Tank-container operators and logistics parks form part of this group.
By Geography
Europe
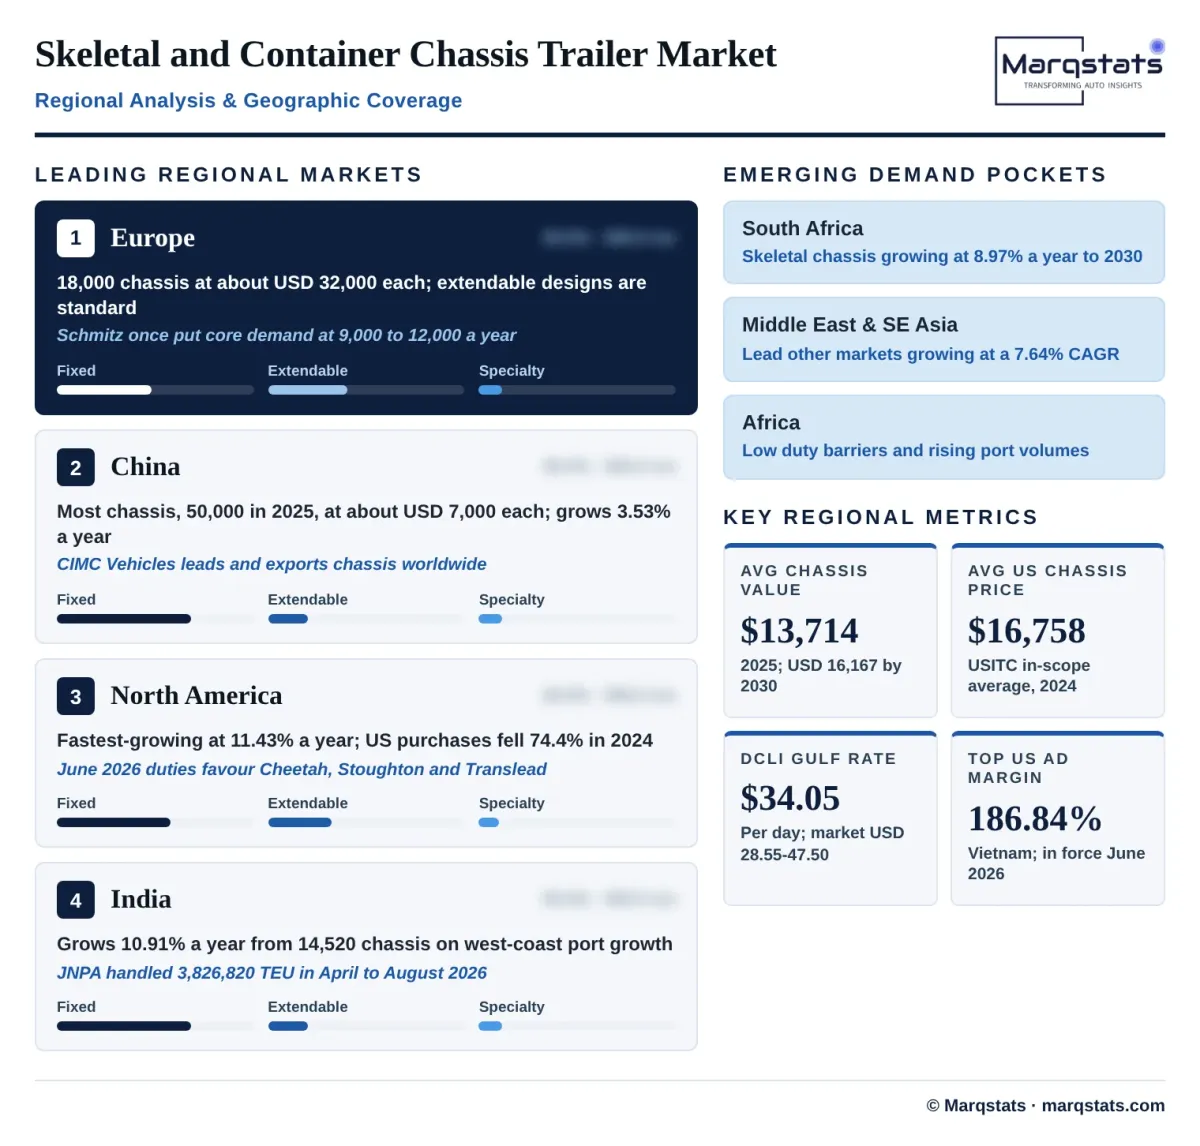
Europe is the largest region in the skeletal trailer market at USD 576.00 million, or 30.09% of 2025 value, from 18,000 chassis at about USD 32,000 each, and grows at 7.92% a year to USD 843.05 million by 2030. Germany, the Netherlands, Belgium and Scandinavia are the core markets, for which Schmitz Cargobull once estimated combined demand at 9,000 to 12,000 container chassis a year, and Schmitz Cargobull, KRONE, Kögel and Wielton lead supply.
North America
North America accounts for USD 315.00 million, or 16.46% of 2025 value, from 18,000 chassis, and is the fastest-growing region at 11.43% a year to USD 541.08 million by 2030. US purchases fell 74.4% in 2024 and remained flat in 2025, but ageing pool fleets and the June 2026 duties support a recovery led by domestic builders such as Cheetah Chassis, Stoughton Trailers and Hyundai Translead.
China
China is the largest region by volume at 50,000 chassis, or 35.82% of global units, but contributes only USD 350.00 million, or 18.29% of 2025 value. Value grows at 3.53% a year to USD 416.29 million by 2030, the slowest regional rate, because prices are low and domestic drayage fleets are mature, and CIMC Vehicles leads the domestic market while exporting chassis worldwide.
India
India accounts for USD 152.84 million, or 7.98% of 2025 value, from 14,520 chassis, and grows at 10.91% a year to USD 256.50 million by 2030. Traffic through JNPA, Mundra and other west-coast ports drives demand, and the figures match the skeletal and container chassis segment of the Marqstats India truck trailer estimate.
Rest of the World
The rest of the world accounts for USD 520.25 million, or 27.18% of 2025 value, from 39,050 chassis, and grows at 7.70% a year to USD 754.00 million by 2030. South Africa contributes USD 26.25 million from about 1,050 skeletal chassis, rising to USD 40.33 million by 2030 at 8.97% a year, while other markets add USD 494.00 million in 2025 and USD 713.67 million by 2030, a 7.64% CAGR, led by the Middle East, South-East Asia, Latin America and Australia.
How Competition Is Evolving
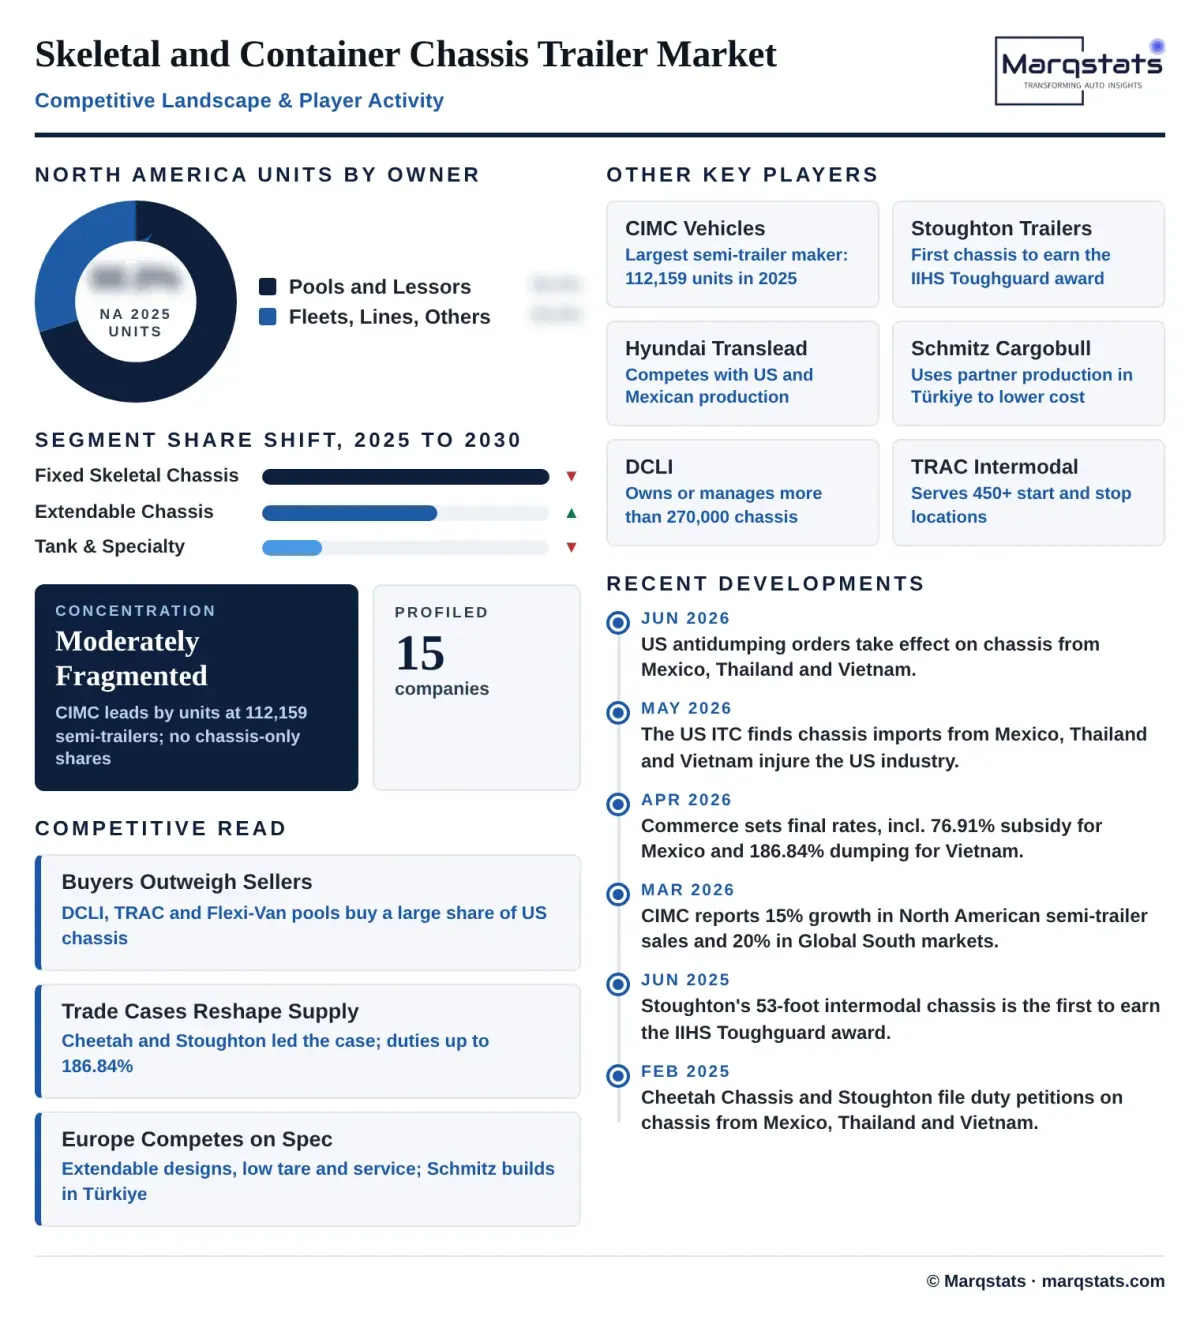
The global skeletal and container chassis trailer market is moderately fragmented. CIMC Vehicles is the largest semi-trailer manufacturer by units, with 112,159 semi-trailers sold in 2025, and holds a strong chassis position in China and export markets, while each region has its own leaders and hundreds of small fabricators compete in China, India and other emerging markets. No source publishes chassis-only company shares, so competitive position is assessed by region and by strategy rather than by share.
Buyers in North America are more concentrated than sellers, with a small number of pool operators led by DCLI, TRAC Intermodal and Flexi-Van purchasing a large share of US chassis. Domestic builders Cheetah Chassis and Stoughton Trailers led the 2025 trade case, and Hyundai Translead competes with US and Mexican production. In Europe, Schmitz Cargobull, KRONE, Kögel and Wielton compete on extendable designs, low tare weight and service, and Schmitz Cargobull has used partner production in Türkiye to lower cost.
Regional specialists hold their home markets, including Tata International Vehicle Applications and Grover Petro and Auto Industries in India and Afrit and Henred Fruehauf in South Africa. Competition turns on price, delivery time, compliance with local approvals and trade rules and the ability to support large fleet orders with parts and repair, and trade remedies are reshaping the US supply chain in a way that makes further consolidation among builders and pools likely.
Companies Covered
Companies covered in the report include:
Recent Market Activity
Table of Contents
Coverage & Segmentation
Coverage spans new skeletal and container chassis trailers worldwide, segmented into North America, Europe, China, India and the rest of the world, with South Africa reported separately within the last of these. The base year is 2025, the historical period runs from 2021 to 2025 and the forecast period from 2026 to 2030. Value is expressed in USD million of manufacturer revenue, excluding the tractor, sales and excise taxes, rental revenue and refurbished chassis, and volume is expressed in new chassis delivered. Segmentation covers chassis type, container size and ownership model, each with three segments, and fifteen companies are profiled.
Flatbed trailers, side-lifters, terminal-only yard chassis and used chassis are excluded from the market definition. US history draws on trade commission investigation data, company data on annual reports and results releases, prices on dealer listings and supplier guides and demand context on port throughput statistics, while the India and South Africa figures are consistent with the Marqstats country trailer estimates.