Market Snapshot
Key Takeaways
Market Overview & Analysis
Report Summary
The electric terminal tractor market comprises new battery-electric terminal tractor unit sales worldwide, covering vehicles designed to move semi-trailers within ports, intermodal terminals, distribution centres, manufacturing yards and rail facilities. This study segments the market by battery capacity, autonomy level, drive configuration, tonnage capacity, end-use industry and region, with a 2025 base year, historical coverage from 2021 to 2025, and forecasts to 2030. The parent all-fuel market is reported alongside as context.
Three scope decisions govern the figures. The market is sized on new unit sales rather than installed fleet, since fleet counts accumulate across a fifteen-to-twenty-year service life and are not comparable to annual sales. Only battery-electric units are counted, with hydrogen fuel cell prototypes noted and excluded on volume grounds. And retrofit conversions of existing diesel units are excluded from new sales, though the retrofit parts business is a material and growing adjacent activity.
Terminal tractors are a small market by unit count and a significant one by electrification relevance. Roughly 9,800 units were sold worldwide in 2025 across all fuel types, a fraction of the volume in any on-highway truck category, yet the segment has electrified faster than heavy road transport because its duty cycle removes the constraints that slow adoption elsewhere. Vehicles return to a fixed base every shift, routes are enclosed and predictable, and charging can be installed once and used continuously.
The parent market grows slowly and predictably. Terminal tractor demand tracks warehouse construction, port throughput and intermodal freight volumes rather than economic cycles directly, and replacement demand from an installed base with a long service life dominates. That stability is what makes the electric substitution rate the only variable worth modelling closely, and it is why this report treats the parent market as context rather than as the subject.
Market Dynamics
Key Drivers
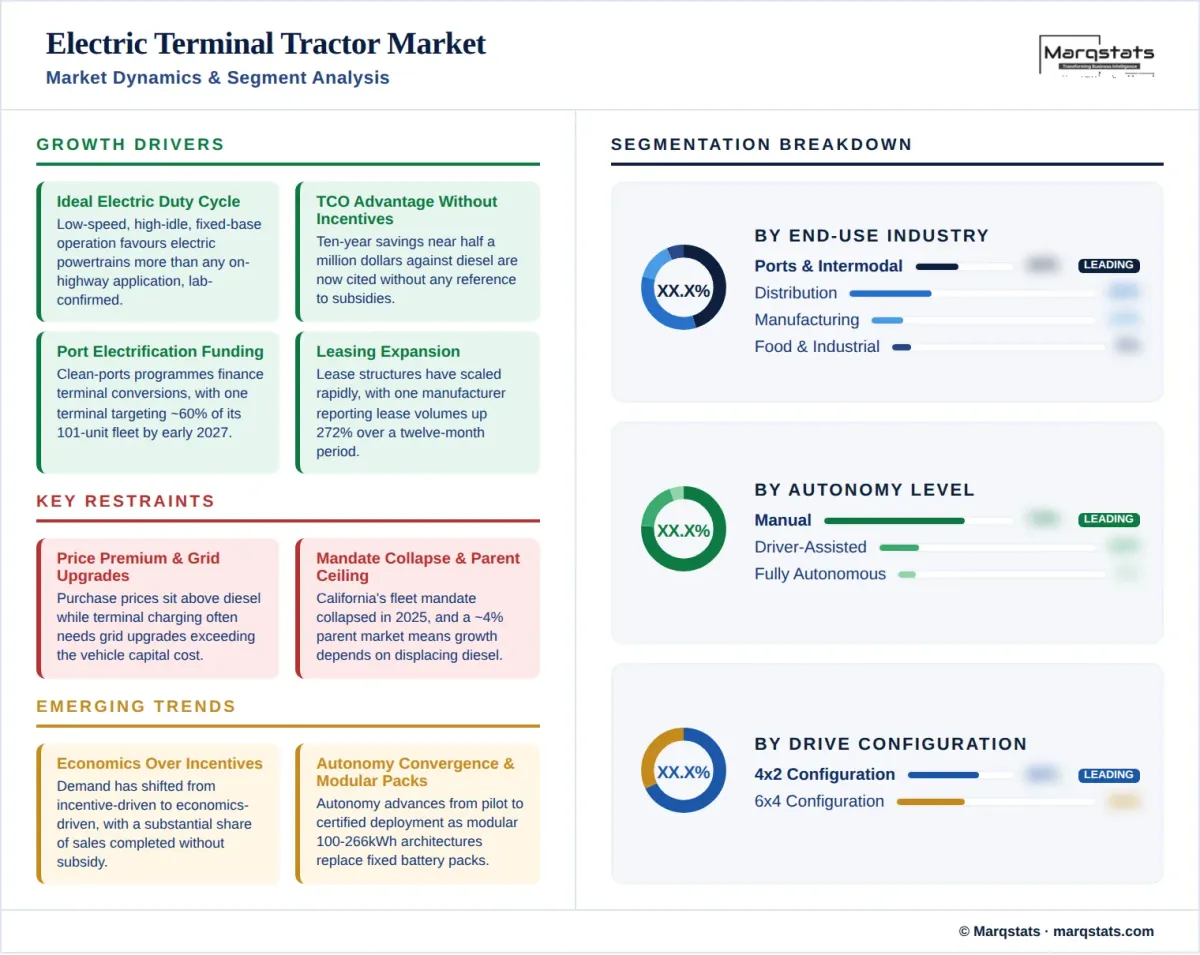
- Duty cycles of low speed, high idle and constant start-stop cycling favour electric powertrains more strongly than any on-highway application, confirmed by national laboratory analysis.
- Total cost of ownership advantages near half a million dollars over ten years are now achieved without incentives, moving demand past early adoption.
- Port electrification funding programmes are financing terminal conversions, with one major container terminal targeting about 60% of its 101-unit fleet electrified by January 2027.
- Leasing structures have expanded rapidly, with one manufacturer reporting lease volumes up 272% over a twelve-month period.
- Fixed-base operation allows charging infrastructure to be installed once and utilised continuously, removing the network dependency that constrains road freight electrification.
Key Restraints
- Purchase prices remain materially above diesel equivalents, requiring operators to underwrite a multi-year payback before savings accrue.
- The California Advanced Clean Fleets rule collapsed across 2025, removing the strongest regulatory mandate for zero-emission fleet purchasing in the largest regional market.
- Charging infrastructure at terminals requires grid upgrades that frequently exceed the vehicle capital cost and carry longer lead times.
- The parent market grows at only about 3.98% annually, so electric volume depends almost entirely on displacing diesel rather than on category expansion.
Key Trends
- Demand has shifted from incentive-driven to economics-driven, with manufacturers reporting a substantial share of sales and leases completed without any subsidy.
- Autonomous configurations are advancing from pilot to certified deployment, with one developer achieving European machinery certification in March 2025.
- Modular battery architectures are replacing fixed packs, with capacity options spanning roughly 100 to 266 kilowatt-hours on current-generation products.
- Diesel-to-electric retrofit programmes are emerging as a parallel route, extending the addressable base beyond new unit sales.
Market Segmentation
Configurations below 200 kilowatt-hours serve single-shift distribution centre and manufacturing yard applications where duty cycles are predictable and opportunity charging is available between movements. The band accounts for the largest share of installed electric units, reflecting the cost sensitivity of distribution operators and the modest energy demand of trailer movements within a confined site. Current-generation modular architectures allow specification within this band without committing to a fixed pack.
Configurations above 200 kilowatt-hours serve multi-shift port and intermodal operations where continuous availability outweighs capital cost, and they grow fastest of any capacity band. Modular architectures on current products extend to about 266 kilowatt-hours, and one manufacturer introduced a third-generation product in March 2025 delivering approximately 30% additional range over its predecessor. Higher-capacity units also support the heavier tonnage applications where trailer weights and gradients increase energy demand per movement.
Manual operation accounts for roughly three-quarters of terminal tractor deployment and remains the default across both electric and diesel fleets. Driver-assisted configurations add collision avoidance, automated coupling assistance and geofenced speed management without removing the operator, and they represent the pragmatic middle path for operators unwilling to underwrite full autonomy. Both categories benefit from electric powertrains independently of autonomy, since the drivetrain and the control architecture are separable decisions.
Fully autonomous configurations grow fastest of any operating mode, and the enclosed, mapped and access-controlled nature of terminal yards makes them the most tractable environment for commercial autonomous freight deployment. A European developer achieved machinery directive certification in March 2025 using pre-certified safety software, one major equipment manufacturer launched an automated terminal tractor range in August 2025 alongside an autonomy partnership, and a further specialist is developing autonomous electric yard trucks for distribution applications. Electric powertrains and autonomy are converging because both favour the same duty cycle.
The 4x2 configuration accounts for roughly two-thirds of terminal tractor deployment and is the standard specification for distribution centre, warehouse and manufacturing yard applications. Lower weight, tighter turning circles and reduced capital cost suit operations moving standard trailers on level, paved surfaces. The configuration also carries a smaller battery requirement for equivalent duty, which improves the electric payback calculation relative to heavier alternatives.
The 6x4 configuration grows faster than 4x2, driven by port and intermodal applications where heavier containers, gradients and continuous multi-shift operation demand additional traction and payload capacity. The configuration commands a higher price and a larger battery, which raises both capital cost and the absolute fuel saving, and port operators with funded electrification programmes have been the principal buyers. Rail intermodal terminals represent a further growth application within this configuration.
Capacity below 50 tons serves lighter distribution and manufacturing applications with standard trailer movements. The 50 to 100 ton band is the volume core of the market at roughly 56% of deployment, covering the majority of distribution centre, port and intermodal specifications, and it is where electric substitution is proceeding fastest because the duty cycle is the most thoroughly understood and payback the most reliably modelled. Most current electric product ranges are concentrated in this band.
Capacity above 100 tons serves heavy port, steel, mining-adjacent and specialised industrial applications, and grows faster than the market average. Electric penetration in this band lags the volume core because energy demand per movement is highest, battery requirements are correspondingly large, and operators in these applications have historically prioritised availability over operating cost. Improving energy density and modular pack architectures are gradually reducing that constraint.
Ports, container terminals and rail intermodal facilities are the largest end-use for electric terminal tractors specifically, though not for the parent market, because they combine high utilisation with access to public electrification funding. One major container terminal deployed 20 electric units from April 2025, ordered 40 more, and is targeting approximately 60 electric units representing about 60% of its 101-vehicle fleet by January 2027, operating 51 chargers with a further 20 dual-plug direct-current units being added. A neighbouring port has deployed 15 electric units.
Retail and e-commerce third-party logistics distribution accounts for roughly a third of parent-market deployment and is the largest end-use overall, driven by warehouse construction and by the concentration of trailer movements at large fulfilment sites. Automotive manufacturer yards grow fastest of any end-use, reflecting both plant expansion and corporate emissions commitments that extend to yard operations. Food and beverage distribution and general industrial applications account for the remainder.
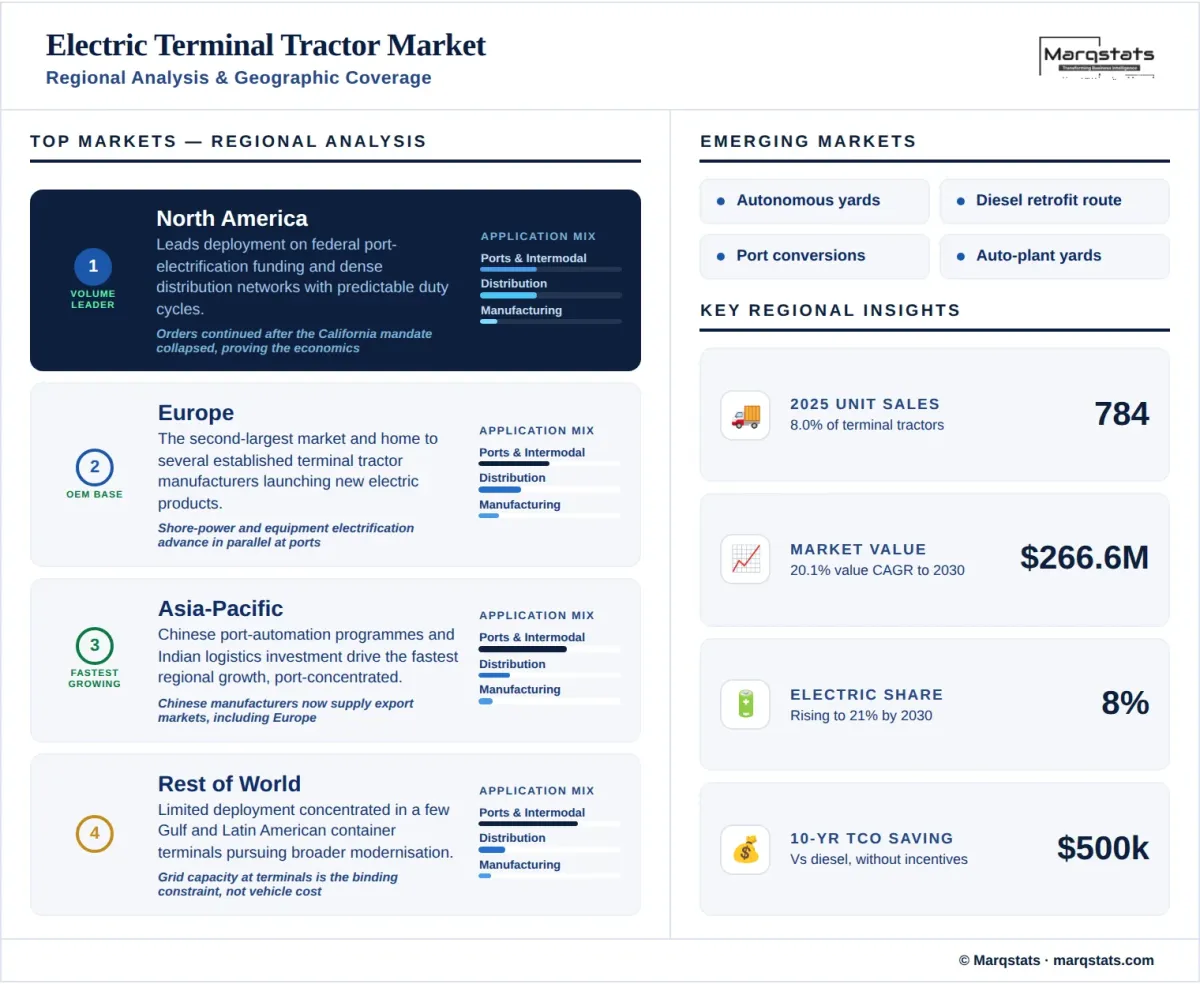
North America leads electric terminal tractor deployment by volume, supported by federal port electrification funding and by the concentration of large distribution operations. The regulatory picture changed materially across 2025 when the California Advanced Clean Fleets rule collapsed, removing what had been the strongest zero-emission purchasing mandate in the region. Demand has nonetheless continued, which is the clearest available evidence that the economic case now stands independently of regulatory compulsion.
Europe is the second-largest market, with established terminal tractor manufacturers headquartered in the region introducing new electric products through 2025 and with port authorities pursuing shore-power and equipment electrification in parallel. Asia-Pacific grows fastest, driven by Chinese port automation programmes and Indian logistics investment, and a Chinese manufacturer made its European terminal tractor debut through a port operator partnership. Rest of World deployment remains limited and concentrated in Gulf and Latin American container ports.
By Geography
North America
North America is the largest regional market for electric terminal tractors by unit volume. Federal port electrification funding has financed terminal conversions at scale, and the concentration of large retail and e-commerce distribution networks provides a second demand base with predictable duty cycles. The collapse of the California zero-emission fleet mandate across 2025 removed the region's strongest regulatory driver, and continued order intake since then is the market's most useful evidence that purchasing now rests on operating economics.
Europe
Europe hosts several of the established terminal tractor manufacturers and is the second-largest market by volume. One manufacturer launched a third-generation electric product in March 2025 with approximately 30% additional range and a modular battery architecture, and an automated range in August 2025. Another unveiled its latest electric terminal tractor in September 2025 and operates a diesel-to-electric retrofit parts business that extends electrification beyond new sales. European autonomy certification advanced in March 2025.
Asia-Pacific
Asia-Pacific is the fastest-growing region, driven by Chinese port automation programmes that pair equipment electrification with terminal operating system upgrades, and by Indian logistics infrastructure investment expanding container handling and warehouse capacity. Chinese manufacturers supply both domestic demand and increasingly export markets, with one making its European terminal tractor debut through a partnership with an international port operator. Regional deployment is concentrated in container ports rather than in distribution applications.
Rest of World
Rest of World deployment remains limited and concentrated in a small number of Gulf and Latin American container terminals pursuing electrification alongside broader port modernisation. Grid capacity at terminal sites is the principal constraint in these markets, frequently more binding than vehicle capital cost, and several operators have deferred electric procurement pending substation upgrades. Growth from a very small base is expected to accelerate as port operators standardise equipment specifications across international terminal portfolios.
How Competition Is Evolving
The terminal tractor market is moderately concentrated, with the largest established manufacturer holding roughly 16% of global parent-market share and a further group of European and North American manufacturers accounting for much of the remainder. The electric segment shows a different structure, with a North American specialist manufacturer holding a dominant position in its home market and stating that it expects to capture more than 25% of all new terminal truck orders and deliveries by the end of 2026, a share measured against the full all-fuel market rather than the electric segment alone.
Operating evidence has become the principal competitive asset. That same manufacturer reports more than 1,900 trucks in service having accumulated 33.8 million operational miles, with many units surpassing 30,000 hours on original battery packs, and holds a single-shift plant capacity of 2,400 trucks per year. Fleet-scale durability data of that kind resolves the residual-value and battery-life questions that have slowed commercial vehicle electrification elsewhere, and it is difficult for later entrants to replicate quickly.
Established manufacturers are responding through product generation rather than through price. One introduced a third-generation electric terminal tractor in March 2025 with approximately 30% additional range and a modular 100 to 266 kilowatt-hour battery architecture, followed by an automated range in August 2025 and an autonomy partnership. Another unveiled its latest electric product in September 2025 and has built a diesel-to-electric retrofit parts business, an approach that monetises the existing installed base rather than competing solely for new sales.
Autonomy is emerging as a parallel competitive axis rather than a substitute for electrification. A European developer achieved machinery directive certification in March 2025 using pre-certified safety software, and specialist developers are pursuing autonomous electric yard trucks for distribution applications. Because terminal yards are enclosed, mapped and access-controlled, they are the most commercially tractable environment for autonomous freight, and the operators most willing to fund autonomy are frequently the same ones already funding electrification.
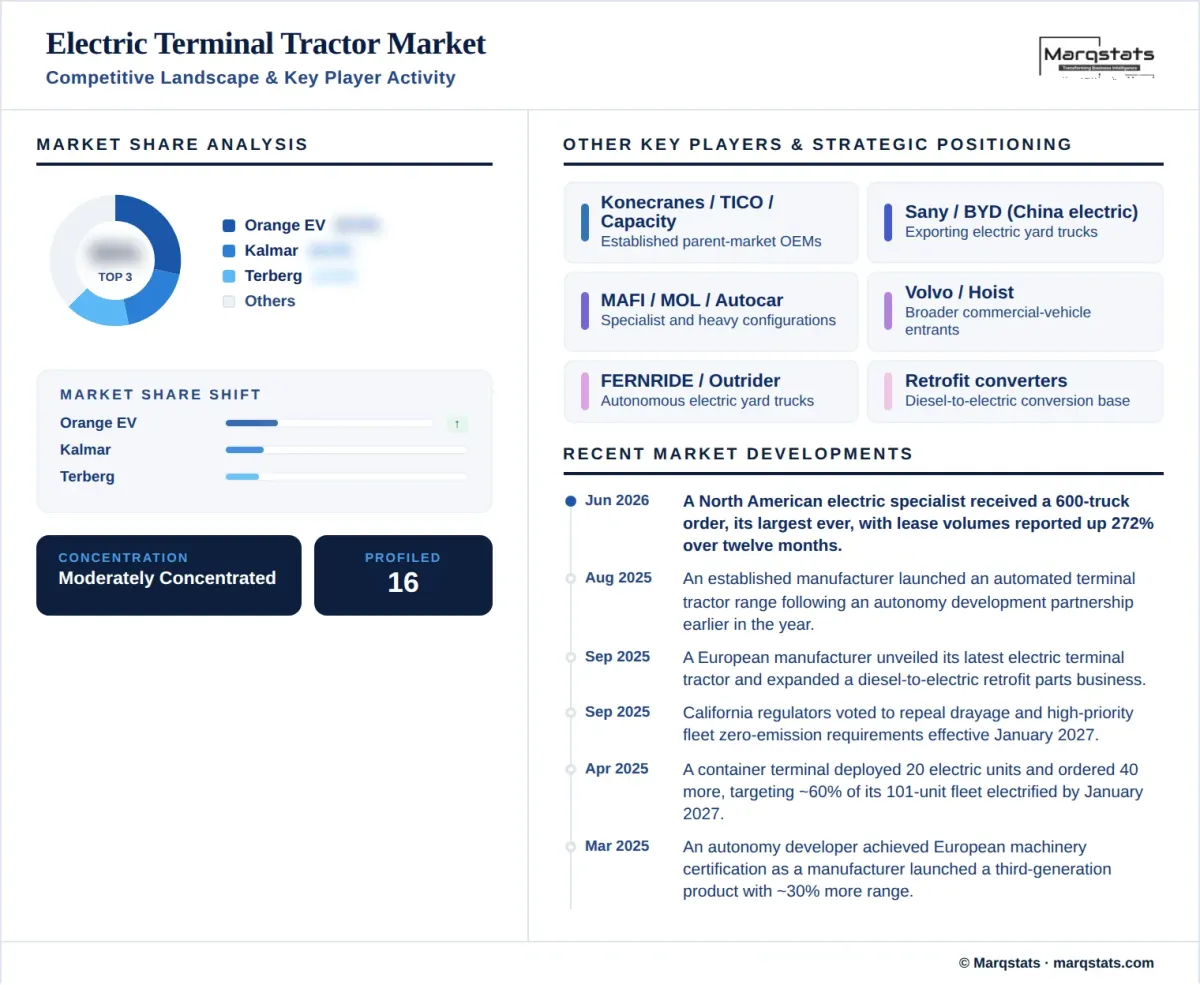
Companies Covered
The report profiles 16+ companies with full strategy and financials analysis, including:
Recent Market Activity
Table of Contents
Coverage & Segmentation
This report provides a comprehensive assessment of the electric terminal tractor market across a 2025 base year, historical data from 2021 to 2025, and forecasts spanning 2026 to 2030. Market sizing is presented in new unit sales and complemented by value analysis in United States dollars. Segmentation covers six dimensions. Only battery-electric units are counted; hydrogen fuel cell prototypes are noted and excluded on volume grounds, and retrofit conversions are excluded from new sales while being discussed as an adjacent activity.
The scope covers demand drivers, restraints and structural trends, with particular focus on the divergence between parent-market and electric-segment growth rates, the shift from incentive-driven to economics-driven purchasing, the collapse of the California zero-emission fleet mandate and its consequences, autonomy convergence, and port electrification funding. Broader commercial vehicle electrification context is available in the Middle East EV Charging Station Market report. An extended forecast to 2035 is available under customization, alongside terminal-level deployment analysis on request.