Market Snapshot
Key Takeaways
Market Overview & Analysis
Report Summary
The global container handling equipment market comprises machinery used to move, stack, and load or unload standardized shipping containers at ports, terminals, and intermodal yards, spanning ship-to-shore gantry cranes, rubber-tyred and rail-mounted gantry cranes, straddle carriers, reach stackers, empty container handlers, terminal tractors, forklifts, and automated stacking cranes and guided vehicles. This study segments the market by equipment type, propulsion, and automation level, with a 2025 base year, historical coverage from 2021 to 2025, and forecasts to 2030. Market size is stated as equipment sales revenue in United States dollars, including associated automation and control systems sold as part of terminal equipment packages.
Container throughput is the fundamental demand driver underlying this market, since every additional unit of trade volume a port must handle eventually requires either higher equipment utilisation on the existing fleet or new equipment purchases to expand capacity. Ports facing sustained throughput growth without corresponding land availability for physical expansion are increasingly investing in higher-density automated stacking systems rather than simply adding conventional yard cranes, a shift that is changing the equipment mix even in markets where overall throughput growth has moderated. Average dwell time, the length of time a container sits in the yard before onward transport, is a second, less visible demand driver: ports actively working to reduce dwell time invest disproportionately in yard equipment and automation capable of faster container retrieval, independent of headline throughput volume.
The market's two major structural transitions, automation and electrification, are related, yet distinct: automation primarily affects yard equipment and control systems, changing how containers are moved and stacked within the terminal, while electrification affects the propulsion of nearly every equipment type, from gantry cranes already largely grid-powered to terminal tractors and forklifts increasingly shifting from diesel to battery power. A terminal can pursue either transition independently of the other, and this report tracks both dimensions separately rather than treating them as a single combined trend. Empty container handling represents a further distinct demand pool within the market: a substantial share of all container moves at major ports involve empty containers being repositioned rather than loaded cargo, sustaining demand for dedicated empty handlers and high-stacking equipment even during periods when loaded-container throughput growth moderates.
Market Dynamics
Key Drivers
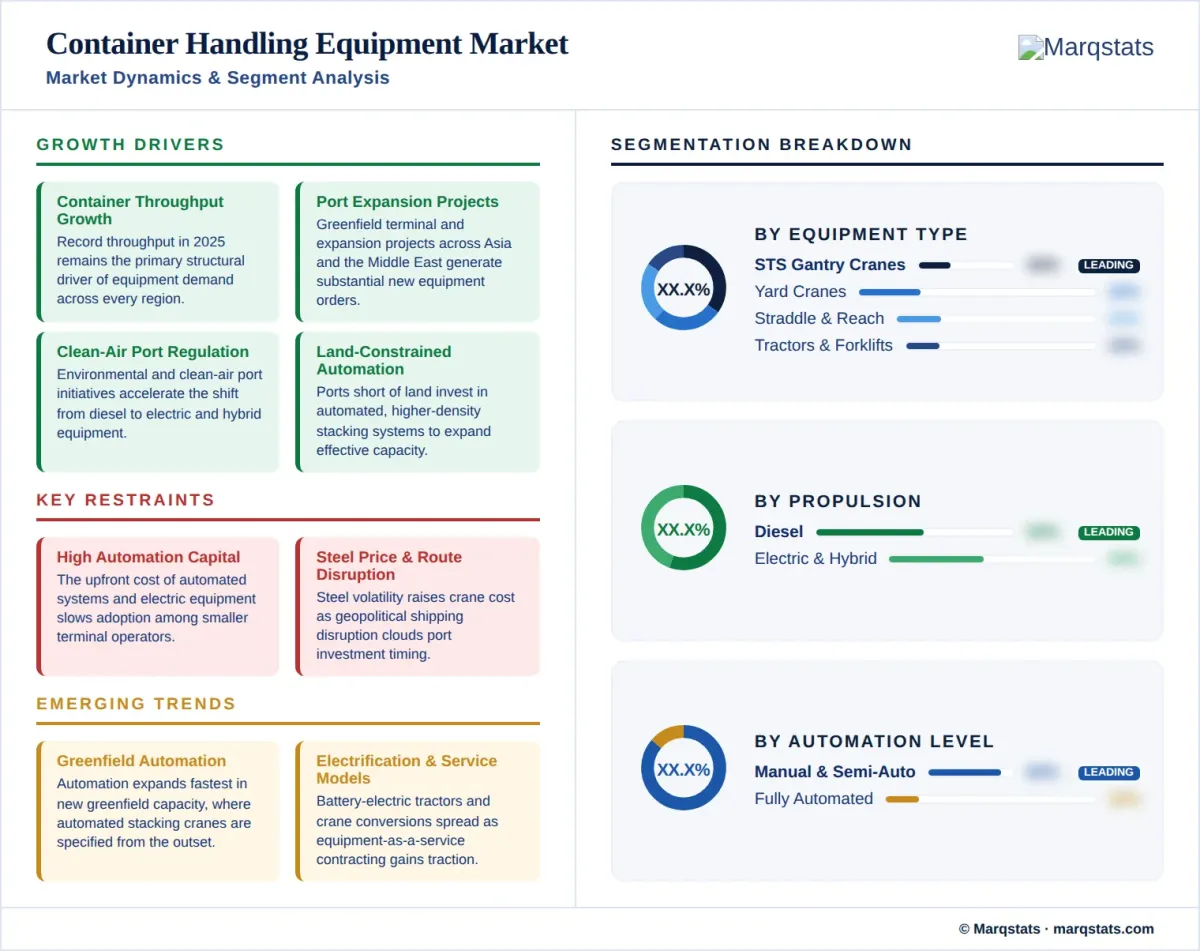
- Sustained global container throughput growth is the primary structural driver of equipment demand across every region.
- Major port expansion and greenfield terminal projects in Asia and the Middle East are generating substantial new equipment orders.
- Environmental regulation and clean-air port initiatives are accelerating the shift from diesel to electric and hybrid equipment.
- Land-constrained ports are increasingly investing in automated, higher-density stacking systems to expand effective capacity.
- Aging equipment fleets in mature ports are driving steady replacement demand independent of throughput growth.
Key Restraints
- High upfront capital cost for automated systems and electric equipment slows adoption among smaller and mid-sized terminal operators.
- Steel price volatility directly affects crane and heavy-equipment manufacturing cost and terminal procurement budgets.
- Geopolitical disruption to major shipping routes creates periodic uncertainty in port investment planning timelines.
Key Trends
- Terminal automation is expanding fastest in new greenfield capacity, where automated stacking cranes are specified from the outset.
- Electrification is advancing across nearly every equipment type, from grid-powered gantry cranes to battery-electric terminal tractors.
- Equipment-as-a-service and performance-based contracting models are gaining traction as an alternative to outright equipment purchase.
- Consolidation among original equipment manufacturers continues, combining crane, yard equipment, and automation software capability.
Market Segmentation
Ship-to-shore gantry cranes represent the largest equipment-type segment by revenue, reflecting their substantial unit cost relative to yard equipment, even though a single terminal typically operates far fewer gantry cranes than yard vehicles. Demand for larger, higher-reach gantry cranes capable of servicing the largest container vessels continues to grow as the global container fleet trends toward bigger ships. A single modern gantry crane represents a multi-million-dollar capital investment, and replacement or expansion decisions are typically planned years in advance alongside broader terminal infrastructure upgrades rather than treated as routine equipment replacement.
Rubber-tyred and rail-mounted gantry cranes used for container stacking within the yard represent the second-largest segment, with rail-mounted systems increasingly specified for new automated yard capacity given their suitability for automated stacking crane operation compared with rubber-tyred alternatives. Rubber-tyred systems retain an advantage in operational flexibility, since they are not fixed to rail infrastructure and can be redeployed within the yard more readily, a consideration that continues to favour them in terminals with variable or seasonal stacking patterns.
Straddle carriers and reach stackers provide flexible container handling and stacking capability without requiring the fixed infrastructure gantry cranes need, making them a common choice for mid-sized terminals and inland container depots where full gantry crane investment is not justified by volume. Reach stackers in particular serve as a versatile, lower-capital-cost entry point for terminals scaling up from manual to semi-mechanised operations, and remain the equipment of choice at many smaller regional ports even as larger hub terminals move toward gantry-crane-dominated operations. Empty container handlers, a specialised sub-category within this segment, are purpose-built for stacking empty containers at height and represent a distinct purchasing decision from general-purpose reach stackers used for loaded containers.
Terminal tractors and forklifts represent the highest-unit-volume equipment category, moving containers within the terminal and to and from external transport, and are the equipment type where electrification has progressed furthest given their comparatively lower power and range requirements relative to cranes. Fleet size in this category scales directly with terminal throughput, meaning replacement and expansion demand for tractors and forklifts tracks short-term volume trends more closely than the multi-year planning cycles that govern gantry crane investment decisions.
Automated stacking cranes and automated guided vehicles represent the fastest-growing equipment-type segment, driven by land-constrained ports seeking higher-density yard operations and labour-cost pressure in markets where skilled crane and vehicle operators are increasingly scarce. This segment carries the highest software and systems-integration content of any equipment category, since automated equipment is only as effective as the terminal operating system coordinating it, giving suppliers with strong automation software capability a meaningful competitive advantage over hardware-only equipment manufacturers.
Diesel propulsion remains the majority of the installed equipment base at roughly 54%, concentrated in yard vehicles and older gantry crane installations, though this share is declining steadily as replacement cycles bring in electric and hybrid alternatives. Diesel retains an advantage in ports lacking reliable grid capacity or shore-power infrastructure, meaning the pace of this transition varies considerably by region depending on local electricity infrastructure as much as on equipment technology availability.
Electric and hybrid propulsion is gaining share fastest in terminal tractors and forklifts, where battery technology has matured sufficiently for full-shift operation, while larger equipment such as ship-to-shore gantry cranes has generally been grid-connected rather than diesel-powered for decades, meaning the propulsion transition is most consequential for yard-level equipment rather than the largest cranes. Rubber-tyred gantry cranes represent an intermediate case, where hybrid diesel-electric and fully battery-electric conversions are both commercially available, and the choice between them often depends on a specific terminal's existing electrical infrastructure and duty-cycle requirements.
Manual and semi-automated operation remains standard across most of the global installed base, particularly in emerging-market ports where labour costs remain low relative to automation capital investment. Semi-automated configurations, where equipment operates automatically within the yard while retaining manual control for edge cases and exceptions, represent a common intermediate step for terminals transitioning toward fuller automation without the capital commitment a greenfield automated terminal requires.
Fully automated equipment, including automated stacking cranes and automated guided vehicle fleets governed by integrated terminal operating systems, represents a smaller, fastest-growing automation category, concentrated in new greenfield terminals and major hub ports in developed markets where labour cost and land constraints most favour automation investment. Retrofitting an existing conventional terminal to full automation is materially more complex and costly than specifying automation from the outset in a greenfield project, which is why the fastest automation adoption continues to concentrate in new capacity rather than existing terminal upgrades.
By Geography
Asia-Pacific
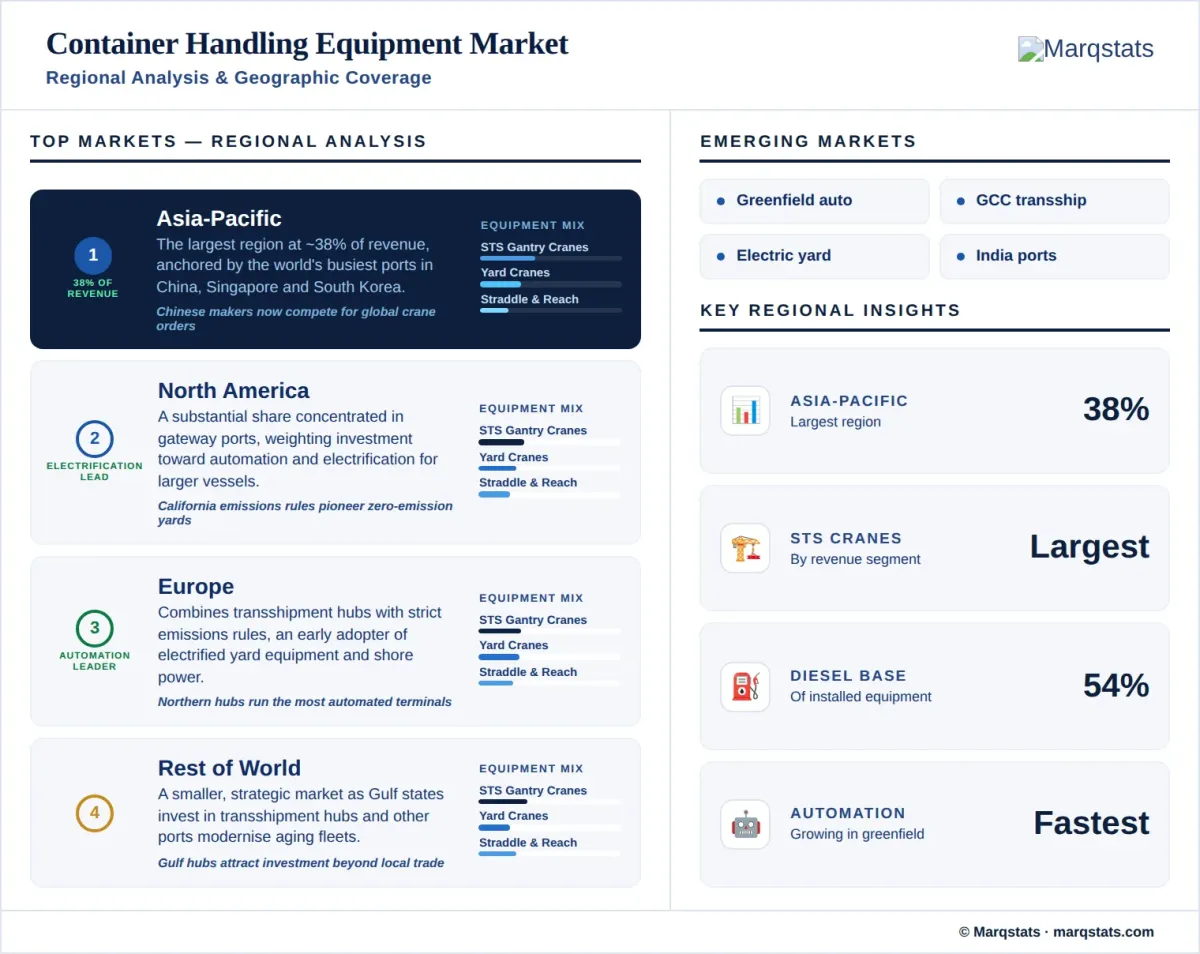
Asia-Pacific holds roughly 38% of global revenue, the largest of any region, anchored by the world's busiest container ports in China, Singapore, and South Korea. Chinese equipment manufacturers have scaled into global top-tier positions on the strength of massive domestic port construction, and are increasingly competing for international orders alongside established European manufacturers. India's port sector is expanding rapidly under large-scale national infrastructure programmes, creating a fast-growing secondary demand pool within the region distinct from the mature, replacement-driven demand pattern of China's most established ports, while Southeast Asian transshipment hubs continue expanding capacity to serve growing intra-regional and China-plus-one manufacturing trade flows.
North America
North America represents a substantial share of global demand, concentrated in major container gateway ports, with equipment investment increasingly weighted toward automation and electrification as West Coast and Gulf Coast terminals modernise to handle larger vessels and meet state-level emissions requirements. California's port-emissions regulations in particular have made the state's major gateway terminals an early proving ground for zero-emission yard equipment, with lessons from these deployments informing procurement decisions at other North American ports.
Europe
Europe combines major transshipment hub ports with some of the world's strictest port-emissions regulations, making the region an early adopter of electrified yard equipment and shore-power infrastructure that enables grid-connected operation of ship-to-shore cranes. Northern European hub ports in particular have led global automation adoption, with several operating among the most heavily automated container terminals anywhere, a track record that continues to attract equipment and automation software suppliers seeking reference installations for prospective customers elsewhere.
Rest of World
The Middle East, Latin America, and Africa represent a smaller, strategically important market, with Gulf Cooperation Council states investing heavily in transshipment hub capacity and African and Latin American ports gradually modernising aging equipment fleets to support rising trade volumes. Several Middle Eastern transshipment hubs have positioned themselves as alternative routing points amid periodic disruption to traditional shipping corridors, a strategic role that has attracted substantial equipment investment beyond what regional trade volumes alone would otherwise support.
How Competition Is Evolving
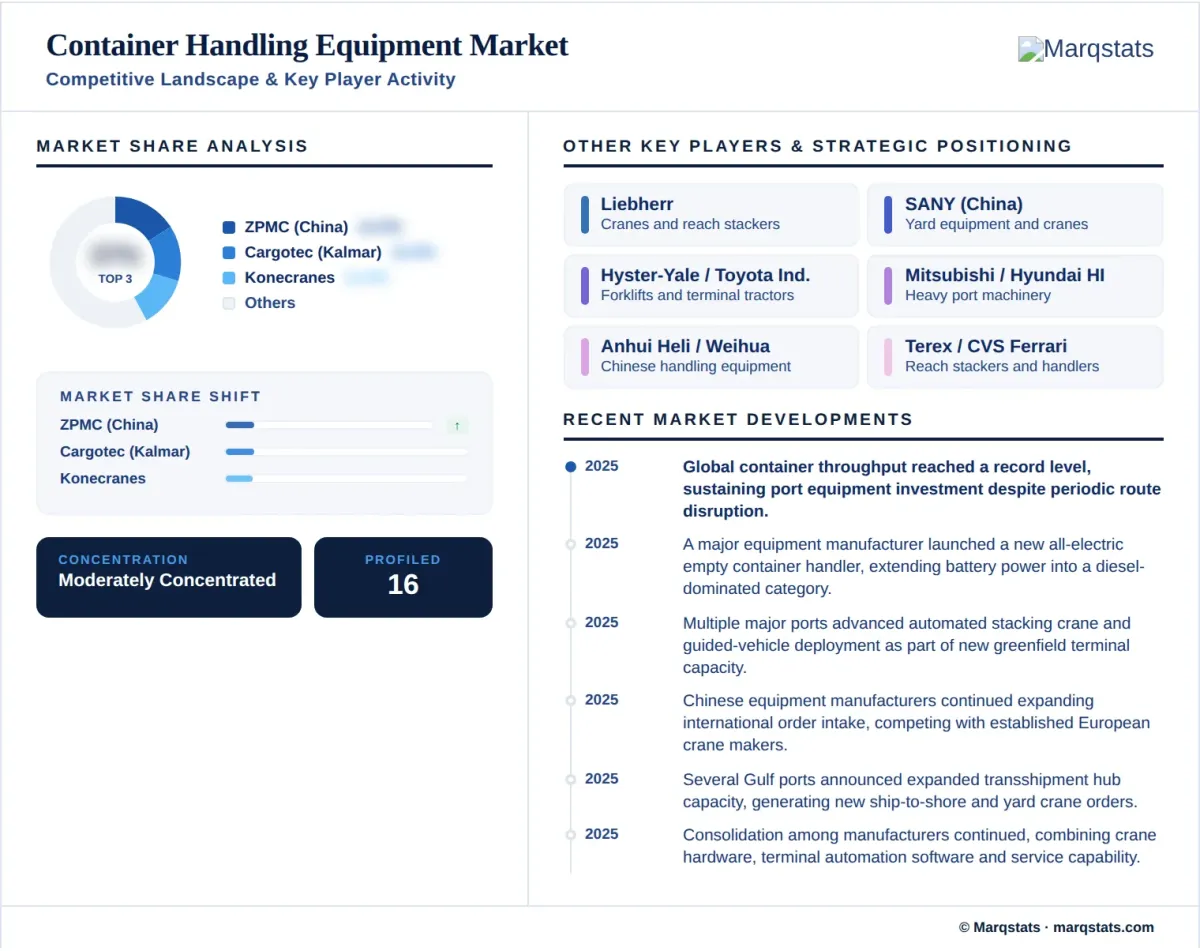
The market is moderately concentrated, with a small number of established European and Chinese manufacturers supplying the large majority of ship-to-shore and yard crane capacity globally, alongside a broader group of specialists competing in terminal tractors, forklifts, and reach stackers. The largest manufacturers increasingly compete on integrated offerings that bundle equipment with automation software and terminal operating systems, rather than on equipment hardware alone. Long product lifecycles, typically two to three decades for a gantry crane, mean the competitive contest for a given terminal is won primarily at the initial procurement and automation-platform decision, after which the incumbent supplier retains a significant advantage on subsequent expansion and upgrade orders, since terminal operating systems and equipment fleets from a single supplier are generally easier to maintain and integrate than a mixed-vendor installation.
Competitive strategy centers on automation and electrification capability, since ports increasingly evaluate equipment suppliers on their ability to deliver an integrated automated terminal solution rather than individual machines. Chinese manufacturers have expanded aggressively into international markets on the strength of domestic manufacturing scale and competitive pricing, while established European manufacturers defend share through automation software depth, service network coverage, and long-standing relationships with major port authorities. Consolidation among original equipment manufacturers has been a recurring feature of the industry, combining crane hardware, terminal automation software, and service capability under single corporate umbrellas better able to fund the research and development automation and electrification both require.
Companies Covered
The report profiles 16+ companies with full strategy and financials analysis, including:
Recent Market Activity
Table of Contents
Coverage & Segmentation
This report provides a comprehensive assessment of the global container handling equipment market across a 2025 base year, historical data from 2021 to 2025, and forecasts spanning 2026 to 2030. Market size is stated as equipment sales revenue in United States dollars, including associated automation and control systems. Segmentation covers three dimensions: equipment type, propulsion, and automation level, alongside regional analysis spanning Asia-Pacific, North America, Europe, and the rest of world.
The scope covers ship-to-shore gantry cranes, rubber-tyred and rail-mounted gantry cranes, straddle carriers, reach stackers, empty container handlers, terminal tractors, forklifts, and automated stacking cranes and guided vehicles, together with the terminal automation and control systems that govern their operation. The study excludes bulk and non-containerized cargo handling equipment, such as grain unloaders and general break-bulk cargo cranes, and general warehouse material handling equipment not specific to container terminal operations, each of which Marqstats covers separately. This scope choice keeps the reported figure focused specifically on container-handling machinery within terminal boundaries, distinct from the broader bulk and general cargo port-equipment category. Country-level detail beyond the four-region split covered here is available under customization, alongside deeper cuts by equipment type, propulsion, or automation level.