Market Snapshot
Middle bar: base-year value × (1 + CAGR), rounded to two decimals. This is a calculated illustration, not a separately researched annual estimate.
The India truck trailer market is estimated at USD 1,228.91 million (INR 10,507.20 crore) in FY2026 and is projected to reach USD 1,854.11 million (INR 16,724.04 crore) by FY2031, a CAGR of 8.57% in US dollars and 9.74% in rupees. New road trailer deliveries rise from 66,000 to 87,385 units over the same period, a 5.77% CAGR. Value compounds ahead of volume because Indian fleets are moving from two-axle to three-axle designs, which lifts the average trailer value from about INR 15.92 lakh to INR 19.14 lakh.
Market size and forecast figures are generated using Marqstats' proprietary estimation framework, updated as of October 2026. The estimate is constructed from road tractor sales, trailer requirements per tractor and fleet replacement demand, valued against published supplier price bands, and is most sensitive to the ratio of trailers to tractors in port and bulk operations.
The market comprises new towed road trailers across flatbed and sidewall trailers, skeletal and container chassis trailers, tipper trailers, tanker and bulker trailers and low-bed, modular and over-dimensional cargo (ODC) trailers. It excludes the powered road tractor, which Indian truck marketing commonly describes as the trailer truck, together with agricultural trailers, light utility trailers and used trailers. Flatbed and sidewall trailers hold the largest share at 31.66% of FY2026 value, while three-axle designs account for 58.96% of value across all trailer types.
Demand for truck trailers in India is anchored in port throughput and in a record year for heavy truck sales. Jawaharlal Nehru Port handled 3,826,820 TEUs between April and August 2026, up 15.45% on a year earlier, and Kandla handled a record 160.11 million tonnes in FY2026. Medium and heavy truck sales reached record levels in FY2026, with Tata Motors at 175,357 units and Ashok Leyland at 142,658, adding road tractors to a fleet that requires trailers.
The supply base is industrialising alongside that demand, although regional fabricators continue to account for the larger part of national volume. Tata International Vehicle Applications delivered more than 7,400 trailers and tippers in FY2026, and SATRAC opened a INR 250 crore plant near Chennai in February 2026.
Key Takeaways
Market Overview & Analysis
Report Summary
The India truck trailer market measures manufacturer revenue from new towed road trailers, which are vehicles without their own engine coupled to a road tractor through a kingpin and fifth wheel or, less commonly, a drawbar. Each trailer combines a frame or deck, axles, suspension, wheels and tyres, brakes, landing gear, lighting and protection devices with any application equipment the duty requires, such as tipping hydraulics, tank vessels or extendable frames.
Measured value excludes the road tractor, GST, wet kits installed on the tractor and used trailers, which confines the series to the towed unit at the point of first sale. Rigid tipper bodies, agricultural trailers and light utility trailers sit outside the scope, with rigid tippers addressed within the Marqstats coverage of Indian truck body building.
No public body in India publishes complete trailer shipments, because vehicle manufacturers report tractor sales within medium and heavy truck figures and axle manufacturers report assemblies that also serve rigid trucks and exports. The market size is a Marqstats estimate anchored on about 66,000 new road trailers entering service in FY2026, valued against supplier price guides such as the INR 10 lakh to INR 18 lakh range that SATRAC publishes for standard flatbed and container trailers.
FY2026, covering April 2025 to March 2026, is the base year, and FY2027 to FY2031 form the forecast period, presented as 2026 to 2030 in the data panel. Values are converted at INR 85.5 per US dollar in FY2026, weakening to INR 90.2 by FY2031, which explains why the dollar CAGR of 8.57% trails the rupee CAGR of 9.74% across the forecast window.
Trailer units grow at about 6% a year, faster than medium and heavy trucks, because container, mining and project cargo favour articulated vehicles over rigid trucks.
India Truck Trailer Market Size and Forecast
Indian manufacturers and fabricators delivered an estimated 66,000 new road trailers in FY2026, and deliveries are forecast to reach 87,385 by FY2031, a 5.77% compound annual growth rate. Volume is the anchor series, and value is derived from volume and an average trailer value that rises from about INR 15.92 lakh in FY2026 to INR 19.14 lakh in FY2031 as three-axle, tipper and low-bed trailers gain share of the mix.
Deliveries rise to 69,871 trailers in FY2027, 74,083 in FY2028, 78,480 in FY2029 and 82,851 in FY2030 before reaching 87,385 in FY2031. Market value moves from USD 1,228.91 million (INR 10,507.20 crore) in FY2026 to USD 1,324.90 million (INR 11,449.80 crore) in FY2027, USD 1,444.52 million (INR 12,617.85 crore) in FY2028, USD 1,574.24 million (INR 13,898.95 crore) in FY2029 and USD 1,708.85 million (INR 15,249.74 crore) in FY2030, ending at USD 1,854.11 million (INR 16,724.04 crore) in FY2031.
FY2027 runs close to trend, with value rising 7.81% to USD 1,324.90 million, slightly below the USD 1,334.23 million implied by the five-year CAGR path, because steel-led price increases are smaller in the first forecast year than in the years that follow.
Axle production provides a cross-check on unit demand rather than a direct measure of it. Kross produced 40,100 axle and suspension assemblies in FY2025 against capacity of 60,000 and planned to raise monthly axle capacity from 5,000 to 7,500 units, but a three-axle trailer consumes three axles and part of that output serves rigid trucks, exports and spares, so axle volumes do not convert directly into trailer counts.
Container Chassis Trailers Grow Fastest With Port Traffic
Skeletal and container chassis trailers are the fastest-growing type in the India truck trailer market, rising from USD 152.84 million, or 12.44% of FY2026 value on 14,520 trailers, to USD 256.50 million and 13.83% of value by FY2031, a CAGR of 10.91%. Growth in the segment follows container traffic at the ports and at the inland container depots that feed them.
Port throughput data support that trajectory across both the western and eastern seaboards. Jawaharlal Nehru Port handled 3,826,820 TEUs between April and August 2026, up 15.45%, and trade press reported record FY2026 throughput at Kandla and Paradip of 160.11 million tonnes and 156.45 million tonnes respectively. Every container that leaves a port by road requires a chassis, and drayage operators run several trips a day between terminals, container freight stations and inland depots, which ties chassis demand closely to box movements.
Rail share and terminal dwell time moderate the link between port volume and chassis demand. A growing share of containers moves by rail on the dedicated freight corridors, and faster terminal turnaround allows each chassis to carry more boxes a year, so container chassis units grow at about 8% a year, below the pace of port traffic. Skeletal trailers are also among the lowest-priced types at about INR 9 lakh each, with supplier listings for 40-foot skeletal trailers ranging from INR 7 lakh to INR 12 lakh.
Trailer Prices Scale With Type, Axle Count and Specification
Truck trailer prices in India scale with trailer type, axle count and specification. The SATRAC price guide places standard flatbed and container trailers at INR 10 lakh to INR 18 lakh, tipper and bulker trailers at INR 15 lakh to INR 25 lakh and low-bed and specialised trailers at INR 25 lakh and above, all excluding the tractor. Average FY2026 values stand at about INR 12 lakh for a flatbed or sidewall trailer, INR 9 lakh for a skeletal trailer, INR 20 lakh for a tipper trailer, INR 22 lakh for a tanker or bulker and INR 40 lakh for a low-bed, modular or ODC trailer.
Tata International Vehicle Applications provides a company-level benchmark, reporting revenue of INR 765.47 crore and profit after tax of INR 37.60 crore in FY2026 on more than 7,400 trailers and tippers, equivalent to roughly INR 10 lakh per unit across a mix that includes rigid tipper bodies. The bill of materials spans the frame or vessel, axles, suspension, tyres, brakes, kingpin, landing gear, lighting and paint, with hydraulics, pneumatic discharge or extendable mechanisms added where the application requires them.
Purchase decisions in the Indian trailer market turn on total cost of ownership rather than invoice price, since the trailer represents only half of the operating vehicle. The full cost covers the trailer, the tractor coupling and wet kit, finance, registration, insurance, maintenance and downtime, net of resale value, and an additional trailer earns a return only where drop-and-hook operations, loading schedules or pooled fleets raise tractor utilisation.
Type Approval and GST Shape the Trailer Supply Base
AIS-113 establishes the type-approval framework for road trailers in India, covering testing, identification, braking, lighting, dimensions and load conditions. Approval of a tractor does not extend to a trailer built by an independent fabricator, and each trailer model must conform to its approved configuration, a requirement that favours manufacturers with engineering teams and testing records even though local fabrication remains common for simpler designs.
Non-agricultural trailers under heading 8716 sit in the 18% GST schedule under Notification 9/2025, effective 22 September 2025, while agricultural self-loading and unloading trailers fall under a separate entry at a lower rate that does not extend to commercial road tipper trailers. The same reform reduced GST on trucks to 18% from 28%, and industry analyses identify that reduction as the principal driver of FY2026 commercial vehicle demand, which in turn fed tractor sales and trailer orders.
Trailer Trucks and Trailers Are Distinct Series in Indian Usage
In Indian truck marketing the term trailer truck usually denotes the powered road tractor rather than the towed trailer, and tractor sales, agricultural tractor sales, trailer axle output and complete trailer deliveries form four distinct series. Conflating them produces widely divergent estimates of market size, and the India truck trailer market counts complete towed trailers only.
Road tractors account for roughly 15% of medium and heavy truck sales in India, and the ratio of trailers to tractors varies with the operating model. Drop-and-hook schedules, pooled fleets and port shuttles allow a single tractor to work with two or three trailers, whereas on most long-haul routes the trailer stays coupled to its tractor and the ratio approaches one. Across the fleet, new trailer demand runs at about 1.15 units per new tractor before replacement of existing trailers, and a combination sold with two trailers counts as two units.
Route Length Decides Between Tipper Trailers and Rigid Tippers
Tipper trailers and rigid tippers compete for the same bulk cargo, and route characteristics determine which configuration operators select. A rigid tipper is a single truck carrying a tipping body and falls within truck body building, whereas a tipper trailer is towed by a road tractor and carries a larger load per trip. Rigid tippers suit short hauls, tight mine roads and sites with poor access, while tipper trailers suit longer paved routes linking mines, ports, plants and stockyards.
Tipper trailers are valued at USD 216.14 million in FY2026, from 9,240 trailers at about INR 20 lakh each, and grow at 8.65% a year through FY2031. That growth tracks coal, ore and aggregate movement and the gradual paving of mining corridors, which extends the range of routes on which articulated vehicles become viable against rigid tippers.
Fleet Operators Drive Trailer Purchasing in India
Trailer demand in India comes from fleet operators rather than individual buyers. Port drayage operators purchase skeletal chassis in batches, steel, cement and fuel companies or the transporters holding their contracts buy flatbeds, bulkers and tankers matched to plant schedules, and project logistics firms acquire low-bed and modular trailers against specific contracts. Small owners running one or two tractors still account for many flatbed purchases from local fabricators, typically financed alongside a tractor loan.
That buyer mix determines how trailer builders compete for orders across the market. Industrial builders win large repeat orders through approved designs, warranty and fleet service, while local builders win single-trailer sales on price, delivery and credit. Finance is frequently the deciding factor, because a lender that accepts a builder's documentation and resale value makes that builder's trailer materially easier to purchase.
Market Dynamics
Key Drivers
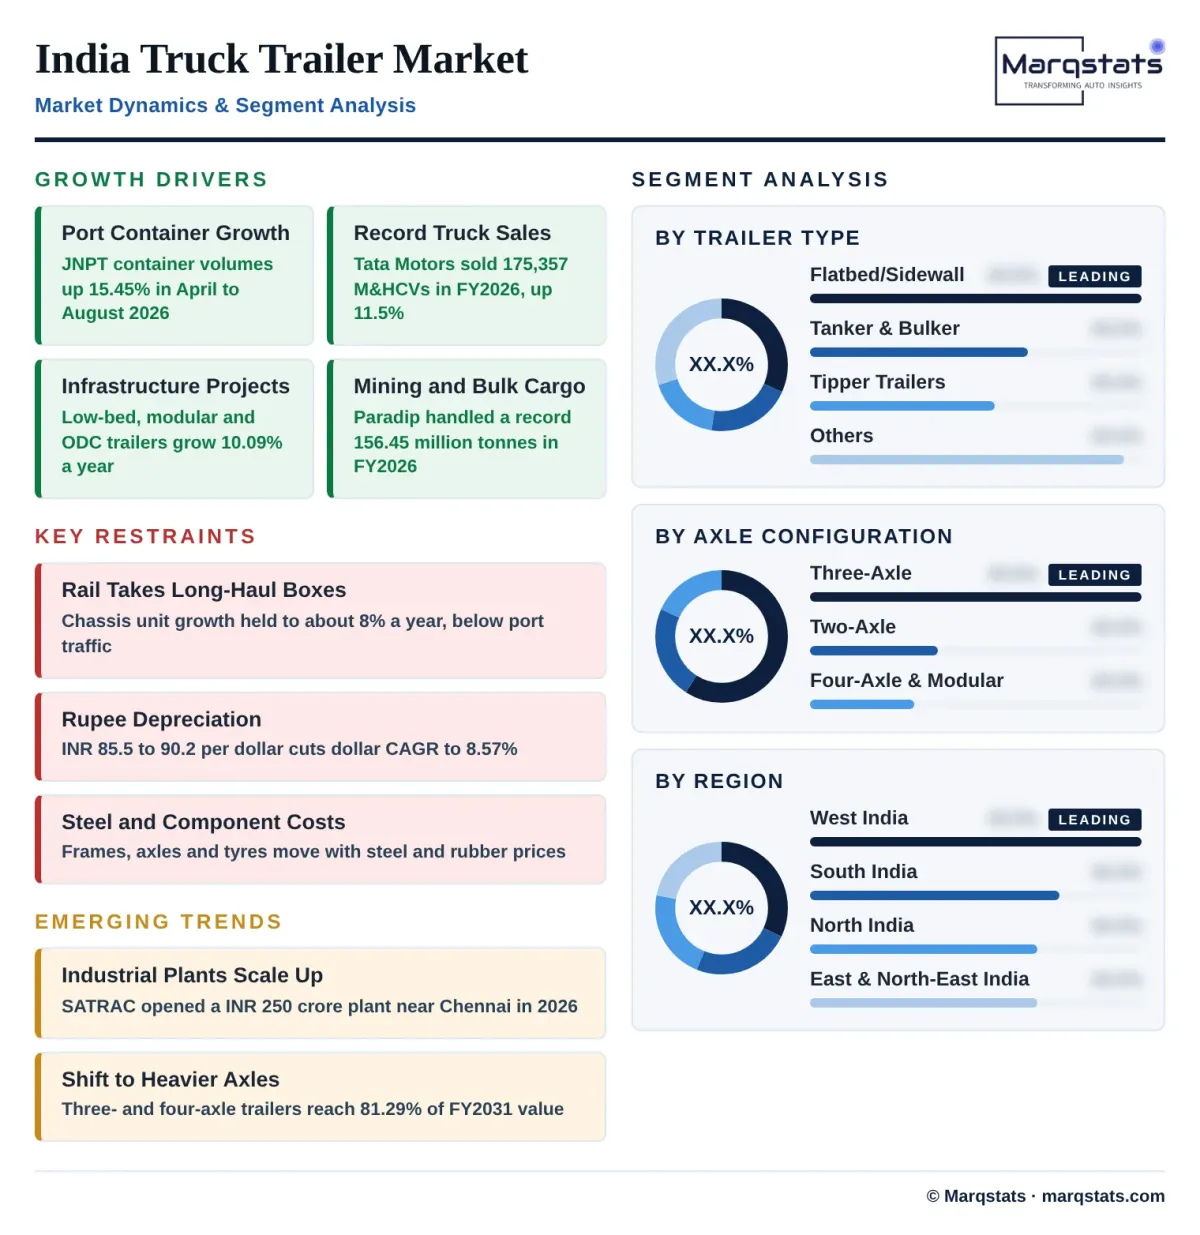
Port container growth, record truck sales and an expanding base of project and mining cargo support the expansion of the India truck trailer market through FY2031.
- Sustained container growth at the western and eastern port gateways. Container volumes at Jawaharlal Nehru Port rose 15.45% between April and August 2026, lifting demand for skeletal and container chassis trailers, which grow at 10.91% a year through FY2031.
- Record medium and heavy truck sales adding road tractors. Tata Motors sold 175,357 and Ashok Leyland 142,658 medium and heavy commercial vehicles in FY2026, up 11.5% and 13.2% respectively, enlarging the tractor fleet that requires trailers.
- Infrastructure and energy projects requiring heavy and over-dimensional haulage. Wind, power, steel and road projects depend on low-bed, modular and ODC trailers for machinery, transformers and wind components, and the segment grows at 10.09% a year from FY2026 to FY2031.
- Mining and bulk cargo moving on longer paved corridors. Paradip handled a record 156.45 million tonnes in FY2026, and coal, ore and aggregate movement supports tipper trailer demand valued at USD 216.14 million in the same year.
- Higher payload designs replacing two-axle trailers on dense cargo. The shift from two-axle to three-axle trailers raises the average trailer value, with three-axle trailers growing at 9.70% a year to FY2031 as operators pursue higher legal payloads.
Key Restraints
Four constraints limit the pace of growth, spanning modal competition from rail, input cost exposure, buyer finance and currency movement.
- Rail competition on the dedicated freight corridors and container services. Rail captures long-haul container volume that would otherwise move by road trailer, which holds container chassis unit growth at about 8% a year against port traffic growth of 15.45% between April and August 2026.
- Steel and component cost exposure between order and delivery. Frames, axles and tyres move with steel and rubber prices, and fixed-price quotes expose builders to input inflation, with steel-led price increases in FY2027 smaller than in the subsequent forecast years.
- Finance and resale conditions favouring established trailer builders. Buyer finance depends on documentation, approved component brands and resale confidence, which favours industrial builders such as Tata International Vehicle Applications, with more than 7,400 units delivered in FY2026, and slows smaller fabricators.
- Rupee depreciation against the US dollar through FY2031. The rupee weakens from INR 85.5 to INR 90.2 per US dollar between FY2026 and FY2031, reducing dollar-denominated growth to 8.57% a year against 9.74% in rupees.
Key Trends
Four trends are reshaping the supply base and moving the market toward industrial production, longer product commitments and heavier configurations.
- Investment in industrial-scale trailer plants across major freight corridors. SATRAC opened a INR 250 crore plant at Sriperumbudur in February 2026 and plans further facilities in Jamshedpur, Pune and Gujarat backed by INR 900 crore of investment.
- Longer warranties emerging as a basis for fleet competition. Tata International Vehicle Applications introduced a three-year trailer warranty after delivering more than 7,400 trailers and tippers in FY2026, and plans new plants in Lucknow and Jamshedpur.
- Integration of couplings, axles and tipping hydraulics by component suppliers. JOST, which completed its acquisition of Hyva in February 2025, offers couplings, landing gear and tipping hydraulics, while Kross began tipping-jack production in January 2026 alongside its axles and suspensions.
- Heavier axle configurations gaining share of market value. Three-axle and four-axle trailers rise from 77.36% of value in FY2026 to 81.29% by FY2031, while two-axle trailers grow at only 4.52% a year over the same period.
Strategic Implications
- Container chassis capacity located near the western and eastern ports aligns trailer production with the fastest-growing segment, which expands at 10.91% a year from USD 152.84 million in FY2026.
- Standardised three-axle platforms built with approved components ease buyer finance and support resale values in a configuration that already holds 58.96% of FY2026 market value.
- Bundled supply of axles, suspensions, couplings and hydraulics, backed by service along the major freight corridors, strengthens component supplier positions following the JOST acquisition of Hyva in February 2025.
- Trailer economics calculated per trip, including tractor utilisation, determine whether an additional trailer earns a return, given a fleet-wide ratio of about 1.15 new trailers per new tractor.
Market Segmentation
Flatbed and sidewall trailers form the largest type at USD 389.05 million, or 31.66% of FY2026 value, from 27,720 trailers at an average of about INR 12 lakh each. The segment grows at 7.62% a year to USD 561.74 million by FY2031, carrying steel, cement bags and general industrial cargo on routes where backhaul flexibility determines fleet choice.
Skeletal and container chassis trailers account for USD 152.84 million, or 12.44% of FY2026 value, and grow fastest of all types at 10.91% a year to USD 256.50 million by FY2031. Port drayage and inland container depot operators form the principal buyer base, purchasing in batches against terminal and container freight station schedules.
Tipper trailers account for USD 216.14 million, or 17.59% of value, from 9,240 trailers at about INR 20 lakh each, and grow at 8.65% a year to USD 327.26 million by FY2031. The segment carries coal, ore and aggregates on routes suited to articulated vehicles, while rigid tipper bodies fall within the India truck body building market.
Tanker and bulker trailers account for USD 254.74 million, or 20.73% of value, and grow at 7.11% a year to USD 359.12 million by FY2031. Fuels, chemicals, cement and powders require approved vessels and discharge systems, which sustains a group of specialised suppliers with application engineering capability.
Low-bed, modular and ODC trailers account for USD 216.14 million, or 17.59% of value, from only 4,620 trailers at about INR 40 lakh each, and grow at 10.09% a year to USD 349.49 million by FY2031. The segment carries machinery, transformers and wind components, and engineering capability and permitting matter more to its buyers than volume pricing.
Two-axle trailers account for USD 278.23 million, or 22.64% of FY2026 value, from 20,592 trailers, and grow at only 4.52% a year to USD 346.99 million by FY2031. The configuration loses share as operators move dense cargo to heavier designs, although it remains the economic choice for light and bulky loads.
Three-axle trailers form the largest configuration at USD 724.61 million, or 58.96% of value, from 39,600 trailers, and grow at 9.70% a year to USD 1,151.39 million by FY2031. The configuration carries higher legal payloads on highway routes and absorbs most of the share released by two-axle designs.
Four-axle and modular trailers account for USD 226.07 million, or 18.40% of value, from 5,808 trailers, and grow at 9.49% a year to USD 355.73 million by FY2031. Hydraulic modular axle lines are counted within complete trailer assemblies rather than as separate units, consistent with the exclusion of separately sold axle assemblies.
Axle choice is an operating decision that balances payload against tare weight and running cost. Additional axles spread the load, protect road surfaces and permit heavier legal payloads, but they add weight, tyres and maintenance, and for dense cargo such as steel, coal and cement the extra payload typically recovers the cost of a third axle within the life of the trailer. For light, bulky cargo a two-axle trailer remains the lower-cost option, which is why two-axle trailers retain about a fifth of market value through FY2031.
By Geography
West India
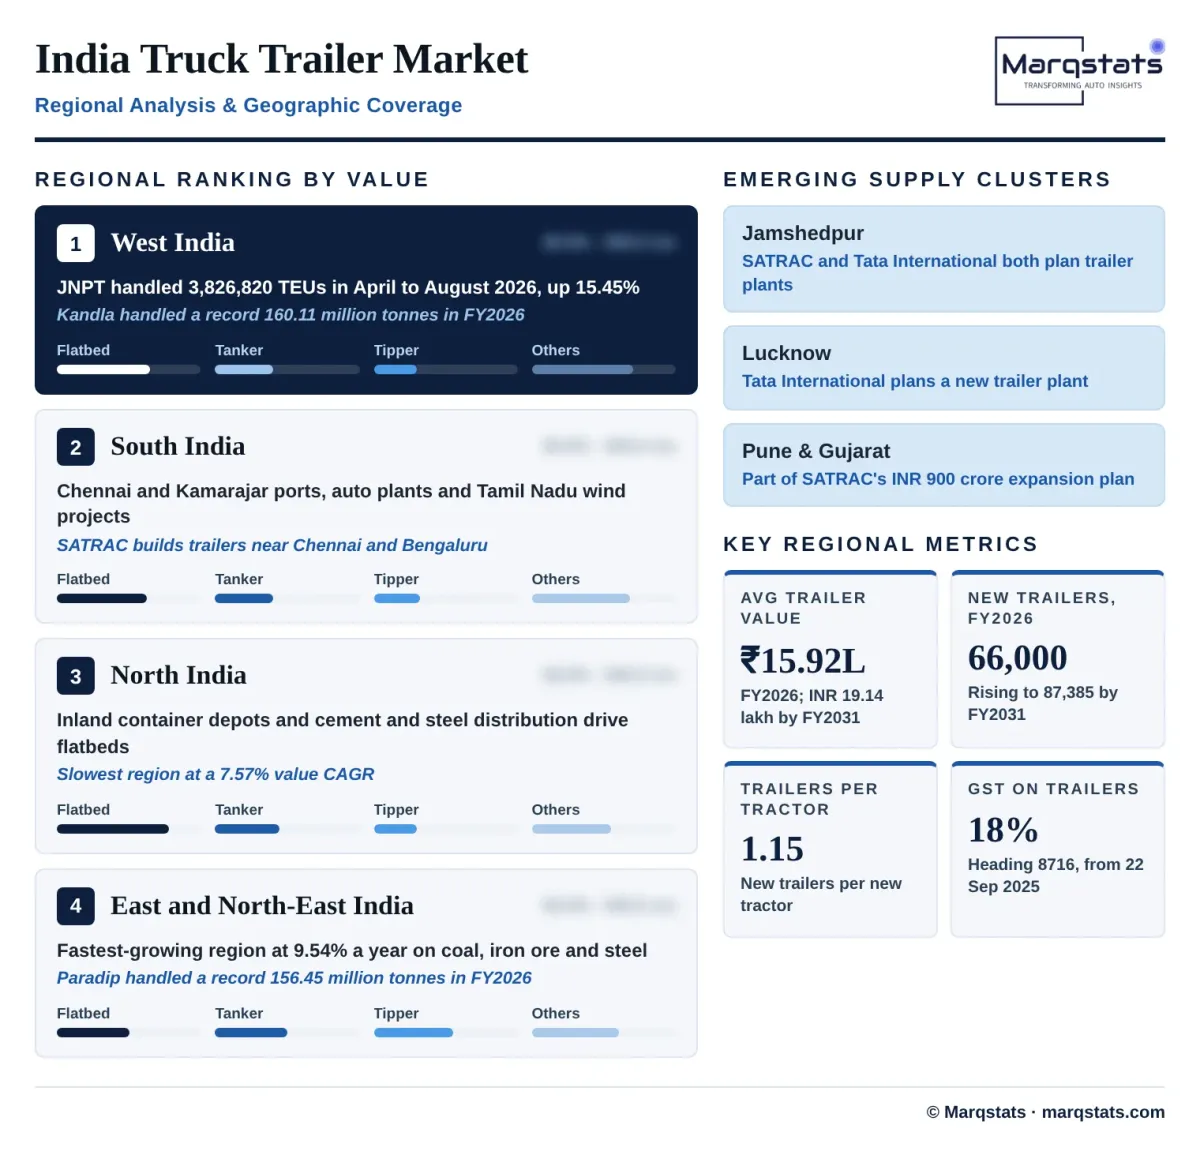
West India is the largest region at USD 393.25 million, or 32.00% of FY2026 value, and grows at 8.91% a year to USD 602.59 million by FY2031. Jawaharlal Nehru Port, Kandla and Mundra drive container chassis demand, and Gujarat and Maharashtra form the major industrial bases of the region. Regional values are modelled allocations, because trailer registrations by state are not published.
South India
South India accounts for USD 294.94 million, or 24.00% of value, and grows at 8.12% a year to USD 435.72 million by FY2031. Chennai and Kamarajar ports, automotive manufacturing plants and wind projects in Tamil Nadu support demand, and SATRAC builds trailers near Chennai and Bengaluru, including at the INR 250 crore Sriperumbudur plant opened in February 2026.
North India
North India holds USD 270.36 million, or 22.00% of value, and grows at 7.57% a year to USD 389.36 million by FY2031, the slowest rate among the four regions. Inland container depots, cement and steel distribution and long-haul general cargo drive demand for flatbed and container trailers across the region.
East and North-East India
East and North-East India accounts for USD 270.36 million, or 22.00% of value, and grows fastest of the four regions at 9.54% a year to USD 426.44 million by FY2031. Paradip and Haldia ports, coal and iron ore in Odisha and Jharkhand and the regional steel plants support tipper, bulker and low-bed demand, and both SATRAC and Tata International Vehicle Applications plan plants in Jamshedpur.
How Competition Is Evolving
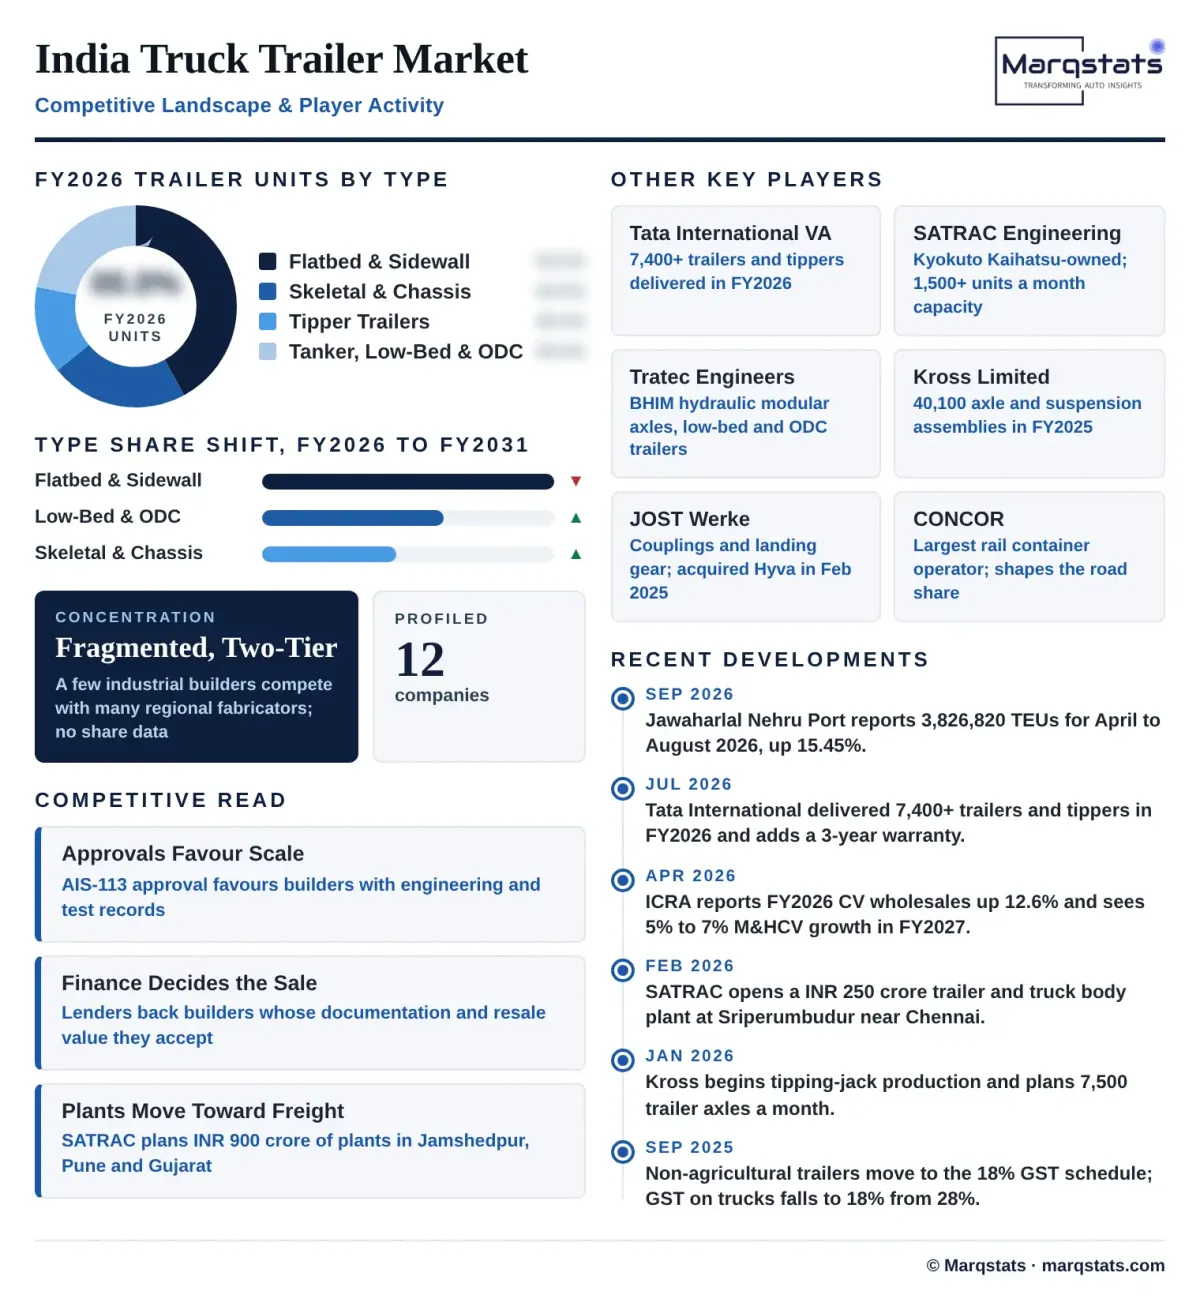
The India truck trailer market is fragmented, with a small group of industrial manufacturers competing against a large base of regional fabricators. Concentration ratios and organised-sector shares could not be sourced from public disclosures, so competitive position is assessed by supplier type rather than by market share.
Tata International Vehicle Applications, formerly the Tata DLT business, delivered more than 7,400 trailers and tippers in FY2026 on revenue of INR 765.47 crore. SATRAC, owned by Kyokuto Kaihatsu Kogyo, reported prior-year revenue of INR 550 crore and capacity of more than 1,500 units a month across Chennai and Bengaluru, while Tratec Engineers builds BHIM hydraulic modular axles and low-bed, wind and ODC trailers, and Grover Petro and Auto Industries builds skeletal and application-specific trailers.
Component suppliers and tractor manufacturers shape the terms of competition. Kross supplies trailer axles, suspensions and now tipping jacks, and JOST, which completed its acquisition of Hyva in February 2025, supplies couplings, landing gear and hydraulics. Tata Motors, Ashok Leyland, Daimler India Commercial Vehicles, VE Commercial Vehicles and Mahindra and Mahindra supply the tractors, while Container Corporation of India, the largest rail container operator, influences how many boxes move by road rather than rail.
Competition turns on type approvals, finance acceptance, delivery time, warranty and spare-parts availability along the freight corridors. Industrial scale is rising gradually, with SATRAC planning facilities in Jamshedpur, Pune and Gujarat backed by INR 900 crore of investment and Tata International Vehicle Applications planning plants in Lucknow and Jamshedpur, yet industrial builders still deliver a minority of national trailer volume and regional fabricators near ports, mines and industrial towns remain the default supplier for single-tractor owners.
Companies Covered
Companies covered in the report include:
Recent Market Activity
Table of Contents
Coverage & Segmentation
Coverage spans new truck trailers sold in India across West India, South India, North India and East and North-East India. FY2026 is the base year, FY2022 to FY2026 the historical period and FY2027 to FY2031 the forecast period, presented as 2026 to 2030 in the data panel. Value is expressed in USD million of manufacturer revenue converted from rupees, with rupee values shown alongside, and excludes the tractor, GST, wet kits and used trailers, while volume is measured in new trailers delivered.
Segmentation runs across five trailer types and three axle configurations, and twelve companies are profiled across trailer builders, component suppliers, tractor manufacturers and the national rail container operator. Road tractors, agricultural trailers, light utility trailers, rigid tipper bodies and separately sold axle assemblies fall outside the scope. Truck volumes draw on company and broker data, port data on port authority releases, prices on supplier guides and company reports, and regulatory content on AIS-113 and national tax notifications.