Market Snapshot
Middle bar: base-year value × (1 + CAGR), rounded to two decimals. This is a calculated illustration, not a separately researched annual estimate.
The global electric scooter and motorcycle market is estimated at 6,218,393 units in 2025 and is projected to reach 10,343,063 units by 2030, registering a volume CAGR of 10.71% over 2026–2030. In value terms the market is estimated at USD 10.13 billion in 2025 and is projected to reach USD 18.43 billion by 2030, a CAGR of 12.72%. The market comprises new road-registered battery electric scooters, mopeds and motorcycles across four motor power bands. Growth is driven by India, Southeast Asia and Latin America, which lift the market outside China from 2,712,193 units in 2025 to 6,081,714 units by 2030, a CAGR of 17.53%.
Market size and forecast figures are generated using Marqstats' proprietary estimation framework, updated as of October 2026.
Asia Pacific accounts for 89.68% of 2025 volume, with China alone at 56.38% and India at 20.60%. The 1.1–3.0 kW band is the dominant power segment at 44.82% of units, while the above-5.0 kW band carries 15.91% of units and 30.21% of value. Value grows faster than volume because the average selling price rises from USD 1,629 in 2025 to USD 1,782 by 2030 as the mix moves toward higher-power motorcycles.
Key Takeaways
Market Overview & Analysis
Report Summary
The global electric scooter and motorcycle market covers new battery electric two-wheelers that require registration for road use, from sub-1.0 kW urban mopeds to motorcycles above 5.0 kW. The market is estimated at 6,218,393 units in 2025, up 7.93% on 5,761,764 units in 2024, and remains 31.54% below the 2022 level of 9,083,473 units. That 2022 peak was concentrated in China, where registered electric moped and motorcycle sales reached 7,632,700 units before resetting to 4,810,500 in 2023 and 3,506,200 in 2025. Pedal-assist electric bicycles, stand-up kick scooters and electric three-wheelers sit outside the perimeter, as do internal combustion and hybrid two-wheelers.
China's domestic electric two-wheeler sales reached 58.77 million units in 2025, up 16.6% on 2024, which is 9.45 times the entire global electric scooter and motorcycle market. The gap is definitional. Electric bicycles certified under GB 17761 account for approximately 55,260,800 of the Chinese total, leaving 3,506,200 road-registered electric mopeds and motorcycles in scope. Market sizes that fold electric bicycles into the electric scooter count therefore overstate the motorised market roughly tenfold, and they also distort brand rankings, since the volume leaders in China earn most of their units from bicycles rather than registered scooters.
Demand outside China is the growth engine. China grows at 3.98% a year to 4,261,349 units by 2030, while the rest of the market more than doubles from 2,712,193 to 6,081,714 units. India adds 1,661,700 units over the forecast period, the largest single-country increment, and Southeast Asia rises from 600,480 units in 2025 to 1,355,277 units by 2030, a CAGR of 17.68%. Value follows mix: USD 10.13 billion in 2025 rises to USD 18.43 billion by 2030, and the average selling price climbs from USD 1,629 to USD 1,782 as buyers in India, Vietnam and Latin America move into 3.1 kW and above products.
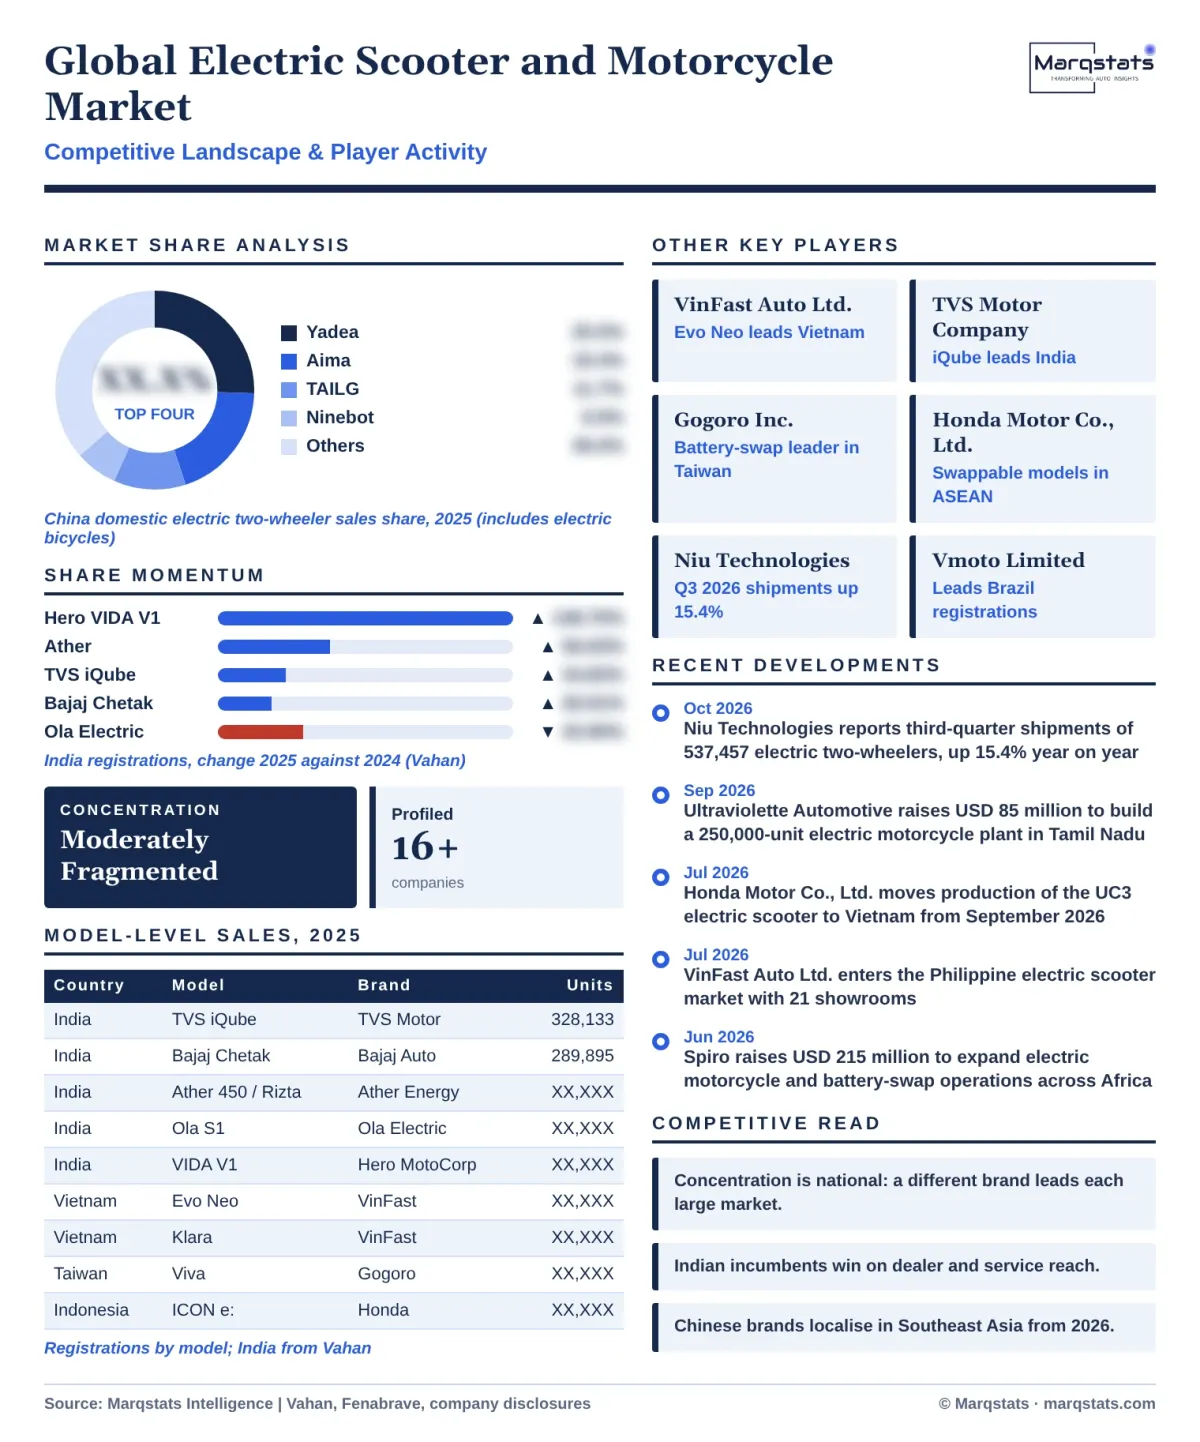
Model-level registration data show that the market is concentrated within countries even where it is fragmented globally. In India, TVS Motor Company Limited's iQube registered 328,133 units in 2025, up 34.83%, followed by Bajaj Auto Limited's Chetak at 289,895 units, Ather Energy Limited at 224,424 units and Ola Electric Mobility Limited at 194,356 units. Those four nameplates took 77.19% of Vahan electric two-wheeler registrations, and Hero MotoCorp Limited's VIDA V1 more than doubled to 108,654 units, a 148.70% increase on 43,688 units in 2024. Ola Electric was India's volume leader in 2024 with 340,386 units and lost 42.90% of its volume in a single year, owing to service backlogs and a shift in buyer preference toward established motorcycle brands.
Vietnam is a single-brand market at model level. VinFast Auto Ltd.'s Evo Neo took 23.38% of tracked Vietnamese electric two-wheeler registrations in 2025, and the five VinFast nameplates Evo Neo, Motio, Klara, Evo Grand and Evo 200 together took 51.37%. Yadea Group Holdings Ltd. followed with 5.84% across the Voltguard and Vekoo, and the Pega eSmart AI and Go-S added 5.18%. The Evo Neo is a 1.5 kW scooter priced at approximately USD 698, against USD 1,682 for the 2.8 kW Klara, so the price ladder inside one brand spans both of the two largest power bands.
Taiwan shows the opposite pattern, a mature battery-swap market in contraction. Gogoro Inc. models took 48.43% of tracked new electric scooter licences in 2025, and KYMCO's Ionex CoolOne and i-One took 18.54%. The Gogoro Viva, previously the volume model, fell 58.46% year on year as subsidy reductions and a weak commuter replacement cycle reduced demand. In Indonesia, Uwinfly led with 17.32% of tracked registrations, Honda Motor Co., Ltd.'s ICON e:, EM1 e: and CUV e: together took 13.62%, and Yadea held 12.87%. Brand-level evidence in Brazil, where Vmoto Limited held 29.88% of Fenabrave-registered electric motorcycles in 2025, confirms that importers of Chinese platforms, rather than domestic incumbents, lead most emerging markets.
India's second tier is small and specialised. Greaves Electric Mobility's Ampere registered 31,282 units in 2025, BGauss 18,829, Kinetic Green 13,086 and Revolt Motors 11,320, the last being the only motorcycle-first brand in the top ten. Together the top five nameplates took 85.28% of Vahan registrations, so the long tail of more than 100 registered brands shares less than 15% of the market. The concentration is a product of dealer networks: TVS, Bajaj and Hero sell electric scooters through existing petrol showrooms, which removes the service-access objection that held back first-time buyers in 2023 and 2024.
Smaller Southeast Asian markets repeat the pattern of one importer-led brand. TAILG took 33.37% of tracked Philippine registrations in 2025 and Honda's EM1 e: 20.41%, while Deco led Thailand with 32.81% and Em Bike followed with 21.01%. In Malaysia, Yadea Group Holdings Ltd. held 49.31% of tracked registrations, ahead of TAILG and Vmoto Limited. Thailand grows at 27.68% a year and the Philippines at 15.24% a year to 2030, so brand positions established in 2025 carry into a market several times larger.
Value is concentrated where power and price are highest. Asia Pacific holds 89.68% of units and 82.13% of value, at an average selling price of approximately USD 1,492, while Europe holds 1.06% of units and 5.73% of value. South America and North America sell at approximately USD 2,632 and USD 2,940 per unit, reflecting imported mid-power scooters and premium motorcycles. A supplier sizing its addressable market on units alone therefore overweights China and underweights Europe by a factor of roughly five.
Market Dynamics
Key Drivers
Five conditions drive the electric scooter and motorcycle market, and policy instruments in India and Vietnam matter more than consumer preference.
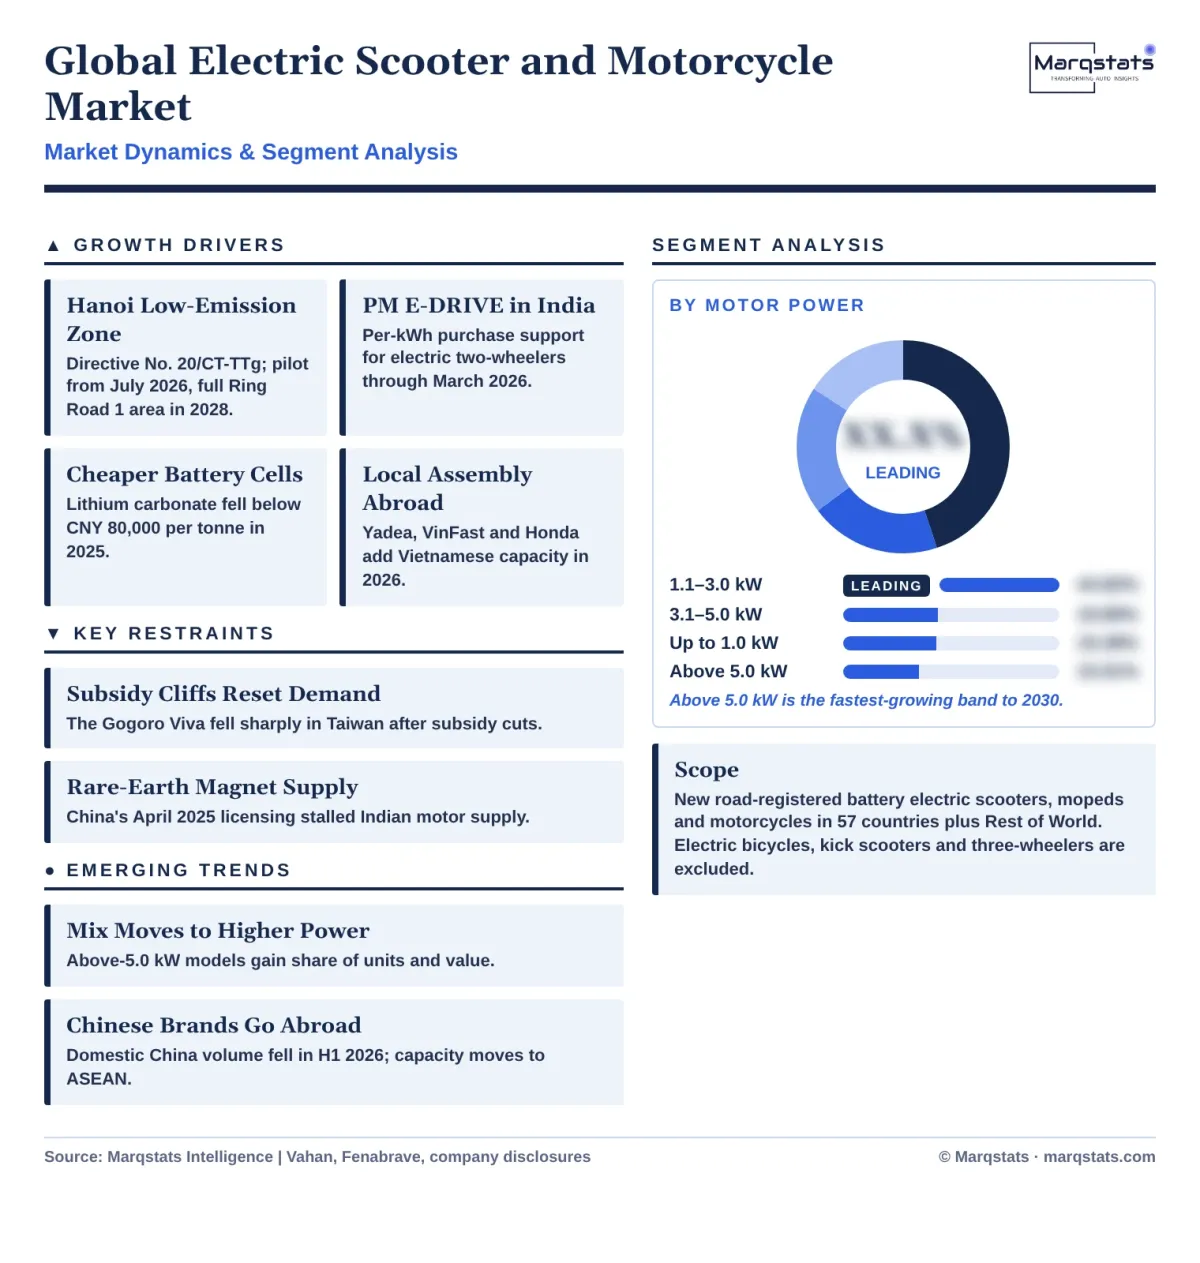
- Urban low-emission zones in Vietnam. Prime Ministerial Directive No. 20/CT-TTg of July 2025 targeted petrol motorcycles inside Hanoi's Ring Road 1, and Hanoi converted it into a phased low-emission zone: an 11-street pilot from 1 July 2026, a 3.6 km² zone in 2027 and the full Ring Road 1 area in 2028. Vietnam grows from 460,000 units in 2025 to 865,144 by 2030, a 13.47% CAGR, and VinFast Auto Ltd. committed VND 13.25 trillion to a Ha Tinh plant with capacity of 2 million units a year.
- Purchase incentives in India. The PM Electric Drive Revolution in Innovative Vehicle Enhancement (PM E-DRIVE) scheme supported electric two-wheelers at INR 5,000 per kWh in fiscal 2024-25, capped at INR 10,000 per vehicle, halving in fiscal 2025-26. India accounts for 20.60% of 2025 volume and grows at 18.09% a year, supported by state road-tax waivers in Maharashtra, Tamil Nadu and Delhi.
- Falling battery costs. Battery-grade lithium carbonate fell below CNY 80,000 per tonne in 2025 from more than CNY 550,000 in November 2022, cutting the largest single cost item in an electric scooter. Lower pack costs allow 3.1–5.0 kW scooters to approach petrol parity, which lifts that band from 19.89% of units in 2025 to 24.75% by 2030.
- Running-cost advantage for delivery and ride-hailing fleets. Commercial riders cover 100 to 150 km a day, where electric operation saves more than half of fuel cost per kilometre. Battery-swap operators such as Gogoro Inc. in Taiwan, Spiro in Africa and Gachaco in Japan remove the battery from the purchase price, converting the vehicle into a subscription.
- Localised manufacturing in Southeast Asia and Latin America. Yadea Group Holdings Ltd. committed USD 100 million to a plant in Bac Ninh, Vietnam, in February 2026, and Honda Motor Co., Ltd. moved production of the UC3 to Vietnam from September 2026. Local assembly cuts import duty, which supports Indonesia growing at 37.45% a year and Brazil at 27.49% a year.
Key Restraints
Four constraints limit adoption, and each is specific to a country rather than general to the technology.
- Subsidy withdrawal resets demand. Taiwan's electric scooter market contracted after subsidy reductions, with the Gogoro Viva falling 58.46% in 2025, and India's PM E-DRIVE support for electric two-wheelers is scheduled to end in March 2026. Taiwan grows at only 5.23% a year to 2030, the slowest rate among the large markets.
- Rare-earth magnet export controls. China's April 2025 export licensing for rare-earth elements and magnets interrupted motor supply to Indian manufacturers, and Bajaj Auto Limited cut Chetak production in August 2025. Manufacturers in India, Vietnam and Indonesia depend on Chinese neodymium magnets for most hub and mid-drive motors, so a repeat of the 2025 licensing delay would stall output within weeks.
- After-sales service gaps. Ola Electric Mobility Limited's registrations fell 42.90% in 2025, from 340,386 to 194,356 units, as service complaints rose and buyers shifted to TVS Motor Company Limited, Bajaj Auto Limited and Hero MotoCorp Limited. Service density, rather than vehicle specification, decides brand choice once early adopters have bought.
- Price gap against petrol commuters. The global average selling price of USD 1,629 in 2025 remains above that of a 110 cc petrol commuter motorcycle in India, Indonesia and Vietnam, where the petrol entry segment sells below USD 1,200. The up-to-1.0 kW band, the cheapest segment, grows at only 5.20% a year, because low-power products compete directly with second-hand petrol motorcycles.
Key Trends
Four shifts show where the market is moving and which companies benefit.
- The mix moves to higher power. The above-5.0 kW band rises from 989,134 units in 2025 to 2,158,482 by 2030, adding 1,169,348 units, and its share of value rises from 30.21% to 35.81%. India supplies 46.90% of above-5.0 kW volume in 2025, with 463,930 units, led by Ather Energy Limited and Bajaj Auto Limited.
- Japanese incumbents enter through swappable batteries. Honda Motor Co., Ltd. launched the ICON e:, CUV e: and EM1 e: in Indonesia, the Activa e: and QC1 in India, and consolidated the Gachaco battery-swap joint venture in Japan in April 2026. The Honda nameplates already took 13.62% of tracked Indonesian registrations and 20.41% in the Philippines in 2025.
- Chinese brands go abroad as volume at home flattens. China's domestic electric two-wheeler sales fell 12.6% in the first half of 2026 to 28.25 million units, after the new GB 17761-2024 standard took effect in September 2025. Yadea Group Holdings Ltd., TAILG and Niu Technologies are adding capacity in Vietnam, Indonesia and Latin America, and TAILG filed for a Hong Kong listing in January 2026.
- Capital moves to performance motorcycles. Ultraviolette Automotive raised USD 85 million in September 2026 for a 250,000-unit plant in Tamil Nadu, and Matter raised USD 25 million in August 2026. Investors are funding the above-5.0 kW band, which grows at 16.89% a year, rather than low-speed scooters.
Market Segmentation
The 1.1–3.0 kW band is the dominant segment and the volume base of the market. It accounts for 2,787,700 units in 2025, 44.82% of the total, and reaches 4,072,390 units by 2030 at a 7.87% CAGR, while its share eases to 39.37%. Mainstream commuter scooters such as the VinFast Evo Neo and most Chinese electric mopeds sit in this band, at an average selling price of approximately USD 1,306.
The 3.1–5.0 kW band is the largest source of incremental volume. It grows from 1,236,682 units in 2025 to 2,560,076 by 2030, adding 1,323,394 units at a 15.66% CAGR, and lifts its share from 19.89% to 24.75%. Indian family scooters including the TVS iQube, Bajaj Chetak and Hero VIDA V1 compete here, where petrol parity on purchase price is closest.
The up-to-1.0 kW band is the declining share. It holds 1,204,877 units in 2025, 19.38% of the total, and grows only 5.20% a year to 1,552,115 units, with its share falling to 15.01% by 2030. Low-speed mopeds in China, Africa and South Asia dominate the band, at an average selling price of approximately USD 755.
The above-5.0 kW band is the fastest-growing and highest-value segment. It holds 989,134 units in 2025, 15.91% of units and 30.21% of value, and grows at 16.89% a year to 2,158,482 units and 20.87% of volume by 2030. Taiwan, where above-5.0 kW models make up 73.48% of volume, and India, with 463,930 units in 2025, anchor the band, at an average selling price of approximately USD 3,094.
By Geography
Asia Pacific
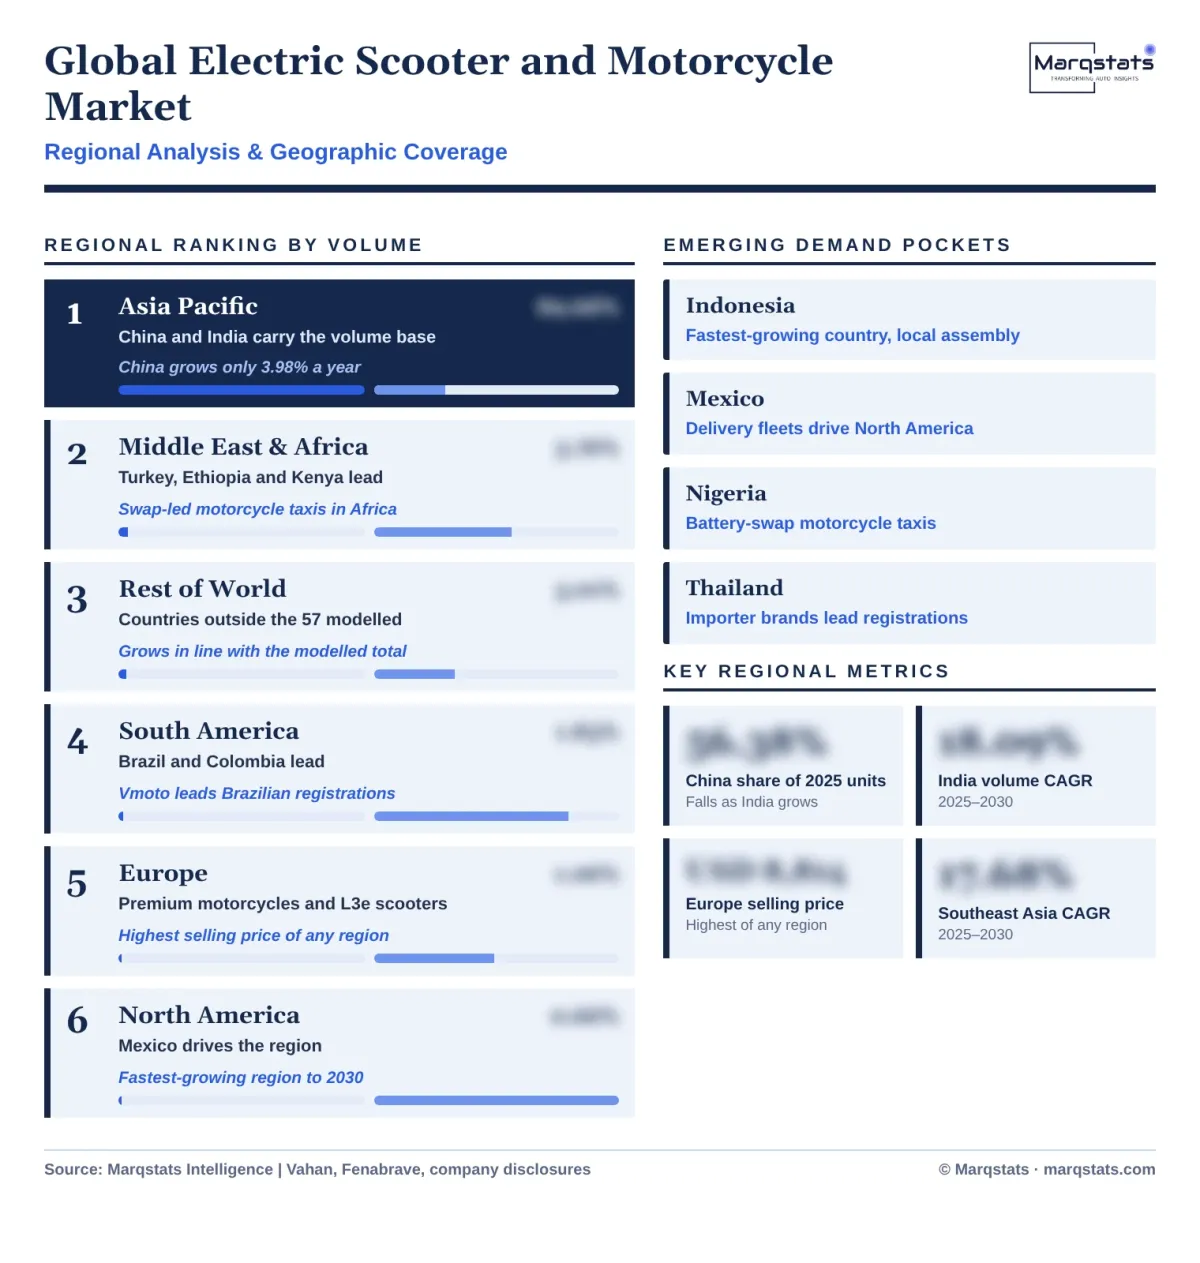
Asia Pacific is the volume centre of the global electric scooter and motorcycle market, with 5,576,910 units in 2025 and 89.68% of volume. Its share falls to 85.25% by 2030 as the region grows at 9.59% a year, slower than every other region, because China grows at only 3.98%. India (1,281,230 units), Vietnam (460,000 units) and Taiwan (180,000 units) follow China, and Indonesia is the fastest-growing country at 37.45% a year. Japan, with 9,000 units in 2025, grows at 22.97% a year as Honda Motor Co., Ltd. and Yamaha Motor Co., Ltd. scale swappable-battery scooters through Gachaco, and the Philippines reaches 121,957 units by 2030.
Middle East & Africa
Middle East & Africa is the second-largest region by volume, with 233,562 units in 2025 and 3.76% of the total, rising to 5.26% by 2030 at an 18.43% CAGR. Turkey leads with 110,790 units, followed by Ethiopia with 46,750 units and Kenya with 25,280 units. Battery-swap fleets for motorcycle taxis, led by Spiro, which raised USD 215 million in June 2026, drive growth in East and West Africa, and Nigeria grows at 35.54% a year.
South America
South America is the second-fastest-growing region, rising from 113,967 units in 2025 to 363,104 by 2030, a 26.08% CAGR, with its share lifting from 1.83% to 3.51%. Brazil, with 55,000 units in 2025, and Colombia, with 27,290 units, account for most regional volume. Vmoto Limited held 29.88% of Fenabrave-registered electric motorcycles in Brazil in 2025, a market where Voltz held 62.4% in 2022 before its decline.
Europe
Europe is a small, high-value region, with 65,801 units in 2025, 1.06% of volume, and USD 0.58 billion in value, 5.73% of the global total. The regional average selling price of approximately USD 8,814 reflects premium motorcycles and L1e/L3e scooters sold through dealers. France (17,210 units), Spain (9,080 units) and Italy (8,890 units) lead, and the region grows at 16.00% a year to 138,178 units by 2030. European buyers pay the highest prices in the market for 11 kW-class motorcycles that sit in the above-5.0 kW band.
North America
North America is the fastest-growing region, at a 32.85% CAGR from 40,810 units in 2025 to 168,885 by 2030, lifting its share from 0.66% to 1.63%. Mexico accounts for 35,240 units in 2025 and grows at 34.49% a year, driven by urban delivery fleets and imported Chinese commuter models. The United States (4,200 units) and Canada (1,370 units) remain niche, premium motorcycle markets.
Rest of World
Rest of World covers countries outside the 57 markets modelled individually, with 187,343 units in 2025 and 3.01% of volume. The aggregate grows in line with the modelled countries at 10.71% a year to 311,608 units by 2030, and is a Marqstats estimate built from the difference between global and country-level registrations.
How Competition Is Evolving
The global market is moderately fragmented, and concentration is national rather than global. In China, Yadea Group Holdings Ltd. held 25.5% of 2025 domestic electric two-wheeler sales, Aima Technology Group Co., Ltd. 19.4%, Tailg Technology Co., Ltd. 11.7% and Ninebot Limited 6.9%, a combined 63.5% on a base that includes electric bicycles. In India, the top four nameplates took 77.19% of Vahan registrations in 2025, and in Vietnam VinFast Auto Ltd. held 51.37% of tracked registrations. No company holds first place in more than two of the five largest national markets.
Competitive strategy splits by origin. Chinese manufacturers compete on cost and scale: Yadea sold 16.27 million two-wheelers in 2025, Aima 10.95 million and Ninebot 4.09 million, and Niu Technologies shipped 537,457 units in the third quarter of 2026, up 15.4%. Indian incumbents compete on dealer and service reach: TVS Motor Company Limited, Bajaj Auto Limited and Hero MotoCorp Limited together gained share in 2025 while the venture-backed Ola Electric Mobility Limited lost 42.90% of its volume. Japanese incumbents, led by Honda Motor Co., Ltd., enter through battery-swap platforms rather than fixed-battery products.
Brand rankings in China depend on the category counted. Aima Technology Group Co., Ltd. reported 24.9% of first-quarter 2026 retail sales, Luyuan Group Holding (Cayman) Limited sold approximately 3.5 million units in 2025, Jiangsu Xinri E-Vehicle Co., Ltd. approximately 2.2 million and Niu Technologies 1.11 million in China. Each of these totals includes electric bicycles, and the registered electric moped and motorcycle share of each company's volume differs widely, so national rankings on the full electric two-wheeler basis do not translate directly into rankings in the global market.
Battery-swap operators form a second competitive layer. Gogoro Inc. runs the largest swap network in Taiwan and licenses its platform to partner manufacturers, Honda's Gachaco serves Japan, and Spiro operates swap stations for motorcycle taxis in Kenya, Uganda, Rwanda and Nigeria. The operator owning the battery captures recurring energy revenue, which shifts value from the vehicle sale to the subscription in fleet-heavy markets.
The competitive question to 2030 is whether the Indian and Vietnamese national champions can hold share once Chinese brands localise. Yadea's USD 100 million Bac Ninh plant, VinFast's 2-million-unit Ha Tinh plant and Honda's transfer of UC3 production to Vietnam all target the same Southeast Asian commuter segment between 2026 and 2027. Capital markets activity confirms the shift: Ather Energy Limited listed in India in May 2025, TAILG filed for a Hong Kong listing in January 2026, and Ultraviolette Automotive raised USD 85 million in September 2026.
Companies Covered
Companies covered in the report include:
Recent Market Activity
Table of Contents
Coverage & Segmentation
The global electric scooter and motorcycle market comprises new road-registered battery electric scooters, mopeds and motorcycles, sized in units and in USD at manufacturer selling prices. The market is segmented by motor power into four bands: up to 1.0 kW, 1.1–3.0 kW, 3.1–5.0 kW and above 5.0 kW. Geographic coverage spans Asia Pacific, Middle East & Africa, South America, Europe, North America and Rest of World, with 57 countries modelled individually.
The base year is 2025, the historical period is 2021–2025 and the forecast period is 2026–2030. Electric bicycles certified under GB 17761 or EN 15194, stand-up kick scooters, electric three-wheelers and used-vehicle transactions are excluded, as are internal combustion and hybrid two-wheelers. Brand and model analysis draws on national registration series, including Vahan in India and Fenabrave in Brazil, and on company disclosures. Country values are converted to USD at annual average exchange rates, and model-level data cover India, Vietnam, Taiwan, Indonesia, Thailand, the Philippines, Malaysia and Brazil.