Market Snapshot
Middle bar: base-year value × (1 + CAGR), rounded to two decimals. This is a calculated illustration, not a separately researched annual estimate.
The Africa electric two-wheeler market is estimated at USD 108.5 million in 2025 and is projected to reach USD 625.0 million by 2030, at a CAGR of 41.94%. The single published continental estimate puts 2025 at approximately 70,000 units — a modelled figure rather than a registration count — and Marqstats forecasts 500,000 by 2030. No continental penetration rate is computable. Kenya, the only country with an auditable series, ran at 15.02% of new motorcycle registrations and about 36% of continental units.
Market size and forecast figures are generated using Marqstats' proprietary estimation framework, updated as of August 2026.
The single most important thing to understand about this market is how thinly it is measured. Africa has no equivalent of the industry associations that publish motorcycle registrations in India or Europe. Exactly one continental two-wheeler sales series exists — the International Energy Agency's Global EV Outlook — and essentially every other appearance of the 70,000 figure in circulation is a republication of it rather than an independent observation. The only other continental count, from a pan-African industry body, is a combined two- and three-wheeler stock figure and is not comparable. The Agency's number is a modelled aggregation built from national data where it exists and company-reported deployment where it does not, and Kenya is the only country on the continent with an auditable annual electric two-wheeler series.
That thinness also makes a continental penetration rate uncomputable, and this report declines to publish one. The only available denominator is the same source's statement that 9,000 units represented 0.5% of Africa's two-wheeler market in 2024 — which would put both sides of the ratio in one hand, and would divide a 2026-edition numerator by a 2025-edition denominator. On this model's own reconstructed 2024 that arithmetic implies a 2.00% share against the source's published 0.5%, a fourfold contradiction. Kenya's 15.02% is the only penetration figure on the continent computable from independent numerator and denominator, and it is used throughout in place of a continental one.
Two further errors are corrected here. The first is a break in the series presented as growth: the 2025 edition of the Outlook put Africa at 9,000 units for 2024, and the 2026 edition put it at 70,000 for 2025. A 7.8-fold jump in twelve months with no published reconciliation is a change in method or country coverage, not a market event. The second is the widely repeated claim that Uganda has overtaken Kenya at more than 30,000 units. Every Uganda source below that figure contradicts it — a pan-African industry body counted 3,200 two- and three-wheelers in stock in May 2025, and reporting on the government's own e-mobility strategy put the fleet near 5,000 a year later. The one Ugandan figure that exceeds it, an energy ministry estimate of 40,000, carries no method and contradicts that strategy document eightfold. The likeliest origin of the 30,000 is a manufacturer's publicly stated order book, restated as sales.
What is real, and what makes the market commercially interesting, is the financing structure underneath it. Swap batteries are being underwritten as an infrastructure asset rather than as vehicle inventory. One development lender advanced USD 10 million of five-year senior secured debt to fund the acquisition of more than 600 swap cabinets and 25,000 batteries and no vehicles at all; how many cabinets are live has never been disclosed. A guarantee-backed facility for a second operator enumerates 15,700 motorcycles and 31,400 batteries separately within a borrowing base. The battery, not the motorcycle, is the bankable asset, and that is why capital is reaching this market from institutions that have never financed a vehicle fleet.
Key Takeaways
Market Overview & Analysis
Report Summary
This report sizes the Africa electric two-wheeler market — battery-electric motorcycles and mopeds, sold or deployed across the continent. Electric three-wheelers are excluded, which matters because several widely quoted operator figures combine the two. Battery swapping is treated as a segment dimension of this market rather than as a separate market, because in most African deployments the swap network is the commercial product and the motorcycle is the customer-acquisition device.
Demand is almost entirely commercial. The buyer is a motorcycle-taxi rider — a boda boda operator in Uganda and Kenya, an okada rider in Nigeria — running 150 to 200 kilometres a day and more at the margin of profitability, for whom the vehicle is a means of production rather than a consumer good. That single fact governs everything else in the market. It makes daily cash cost, not purchase price, the decisive variable; it makes lease-to-own the dominant sales channel; and it makes network density a hard constraint, because a rider who cannot find a working swap station loses more than a day's savings.
The market is also unusually young and unusually thinly evidenced. Most operators were founded after 2019, most disclosure is voluntary, and much of what circulates as market data is company self-reporting with no audit. This report therefore states its evidence grade throughout: which figures are published registrations, which are modelled estimates, which are company claims, and which are targets presented as achievements. Readers who need a single point estimate will find one; readers who need to know how much weight it will bear will find that too.
Market Dynamics
Key Drivers
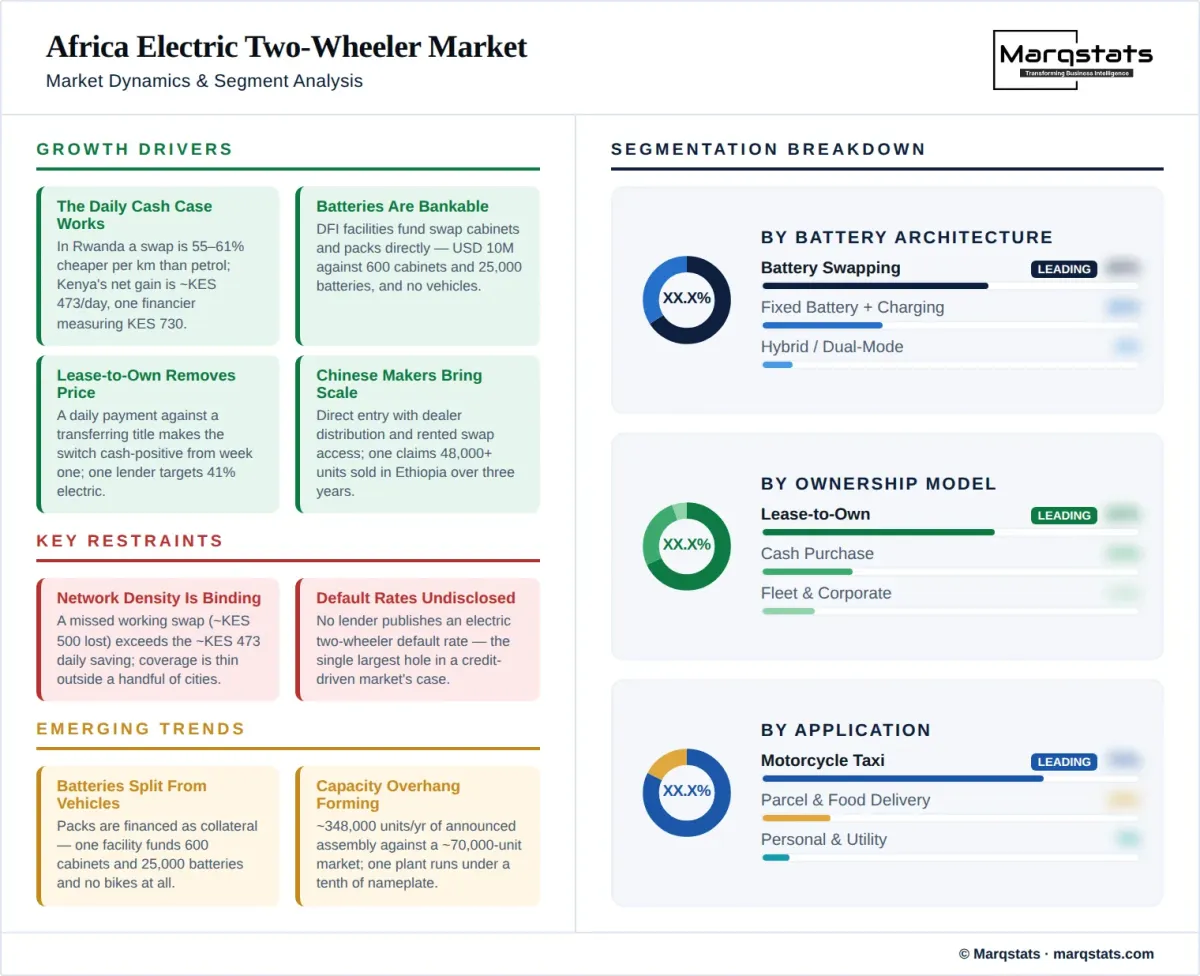
The daily arithmetic works, and it works in cash. In Rwanda a swap costs RWF 2,450 and delivers roughly 75 kilometres, against petrol at RWF 2,938 a litre for 35 to 40 kilometres — Marqstats derives RWF 32.7 per kilometre electric against RWF 73.5 to 83.9 petrol, making electric 55% to 61% cheaper. At 200 kilometres a day that is a saving on the order of RWF 8,000 to 10,000. In Kenya the equivalent energy saving is about KES 650 a day against KES 177 of additional lease cost, a net gain of roughly KES 473, and one financier reports a measured average of KES 730.
Development finance is underwriting the asset base. Named facilities from 2023 to 2026 include a guarantee-backed borrowing base enumerating motorcycles and batteries separately, announced in August 2023; USD 10 million of five-year senior secured debt against swap cabinets and batteries in September 2025; and a USD 30 million debt package for electric motorcycles and batteries at a consumer lender in July 2026. This is patient, asset-backed capital of a kind the sector could not raise from venture markets alone.
Lease-to-own financing removes the purchase-price barrier entirely. The dominant channel is a daily or weekly payment against a title that transfers at the end of term, sold by consumer lenders with existing motorcycle books. One lender has financed more than 600,000 two- and three-wheeler loans across five countries, overwhelmingly petrol, and set a 2025 target of making 41% of its Kenyan motorcycle financing electric.
Chinese manufacturers are bringing scale pricing and dealer distribution. One entered Kenya in 2026 with five models, dealer distribution, no local assembly and a rented swap network. Another claims a top-three African position by units without publishing a figure. Neither raises African venture capital, so neither appears in the funding trackers that shape most coverage of this sector.
Key Restraints
Network density is the binding operational constraint, and its failure mode erases the entire economic case. A Kenyan rider who cannot find a working swap station loses about KES 500 — larger than the KES 473 daily net saving the switch is supposed to deliver. Coverage is thin outside a handful of cities, and one operator's reported station count in Rwanda moved from roughly 350 to just over 300 within a month in mid-2026, which cannot both be right.
No lender anywhere discloses a default rate on electric two-wheeler consumer lending. This is the largest single hole in the investment case for a market whose dominant sales channel is credit to informal-sector borrowers. Portfolio quality is the variable that would determine whether the financing structure scales or stalls, and it is unpublished.
Residual values are unmeasured and may never form. Under battery-as-a-service the rider never owns the pack, the fleet is too young to have produced a resale cohort, and lenders repossess rather than resell. Kenya has a deep and liquid used market for petrol motorcycles and nothing equivalent for electric ones.
Import duty treatment is less favourable than it is usually described. Uganda reinstated a 25% import duty on finished electric motorcycles in mid-2024 — the opposite of the direction its policy is generally reported as taking — and duty and value-added tax treatment varies sharply between neighbouring markets.
Key Trends
Batteries are being separated from vehicles on the balance sheet. The clearest evidence is a facility funding the acquisition of more than 600 swap cabinets and 25,000 batteries and no motorcycles at all. What is not yet evidenced anywhere is a ring-fenced battery vehicle with its own balance sheet — the structure is asset-backed lending against battery collateral, not securitisation, and the distinction matters for how far it can scale.
Company reporting is diverging from country evidence, and the gap is widening. One operator's country claims cannot be reconciled with its own continental claim or with a competitor's: 22,000 in Kenya plus 28,000 in Rwanda leaves only half of its stated 100,000 for five other markets, while a competitor claims to lead the same Rwandan capital nine to one on a much smaller fleet.
A capacity overhang is forming ahead of demand. Announced African assembly capacity is roughly five times current continental sales, and utilisation at one manufacturer runs at under a tenth of nameplate. Expect consolidation, contract assembly and idle lines before expansion.
Battery chemistry and pack size are not converging. Sourced packs range from 1.44 kWh to 4.0 kWh with lithium iron phosphate common among the venture-backed operators, while imported product at the low end of the market may still be lead-acid. A battery is not a standard unit in this market and battery counts cannot be compared between operators.
Market Segmentation
No operator or authority publishes a segment volume split for this market — by battery architecture, by financing model or by application. The rankings in this section are Marqstats analyst judgements built from operator footprints, product design and financing structure, and no segment share or unit count should be inferred from them.
The dominant architecture among the venture and development-finance-backed operators, and the one the financing structure is built around. The rider buys energy by the swap rather than owning the pack, which removes the largest single component of vehicle cost from the purchase decision and moves it onto an operator balance sheet that a lender can underwrite. Between 2.0 and 3.75 packs circulate per vehicle depending on the operator — a range Marqstats derives from a guarantee-backed borrowing base at the low end and one operator's February 2026 disclosure at the high end.
The architecture of outright ownership, and of most imported product. One Nairobi-assembled model ships with two 3.24 kWh packs charged at home or at public points rather than swapped, and is explicitly not a swap-network product. This segment carries a higher purchase price, no recurring energy subscription, and a genuine residual value question that the swap model does not face because the rider owns nothing to resell.
A category evidenced by a single product: one Chinese-owned brand's flagship accepts both an integrated pack and a swappable one, served by its own parent's network. Separately, and by a different company, a second Chinese manufacturer entered Kenya in 2026 with a swap-only product and rented access to an existing operator's network rather than building one — a distinct strategy for entering a market before any network of your own exists. No unit figure is published for either, so this segment is identified rather than sized.
The dominant channel, and the reason purchase price is not the binding constraint it appears to be. A rider pays daily or weekly against a title that transfers at the end of term. In Kenya the incremental lease cost of an electric machine over a petrol one runs around KES 177 a day against energy savings of roughly KES 650, which is what makes the switch cash-positive from week one.
A minority of volume, concentrated in the imported and lower-specification end of the market where a machine can be bought outright for less than a financed premium product. Trade reporting in October 2025 put one operator's Kenyan pricing at KES 195,000 cash against KES 295,000 financed for the same model — a spread that tells you how much of the sector's economics is credit rather than hardware.
Delivery platforms, logistics operators and corporate fleets buying or leasing in blocks rather than one machine at a time. Smaller in units than rider-owned volume but commercially significant, because fleet buyers accept range and network limitations that an independent rider cannot, and they generate the utilisation data that lenders need.
The overwhelming majority of demand across East and West Africa, and the duty cycle the entire product category is engineered around — 150 to 200 kilometres a day and more, urban, return-to-base, high daily mileage and thin margins. It is also why daily cash cost dominates: a rider financing a machine out of daily takings cannot absorb a bad day.
A smaller but faster-professionalising segment evidenced in Nairobi, Lagos and Addis Ababa, where platform and postal operators can mandate vehicle type and guarantee utilisation. Delivery duty cycles are shorter and more predictable than taxi work, which suits smaller packs and denser but shallower networks.
The smallest segment on the continent and the least evidenced. Personal two-wheeler ownership in most African markets is a secondary market for used petrol machines, and no operator in this research reports a meaningful private-buyer share.
By Geography
Kenya
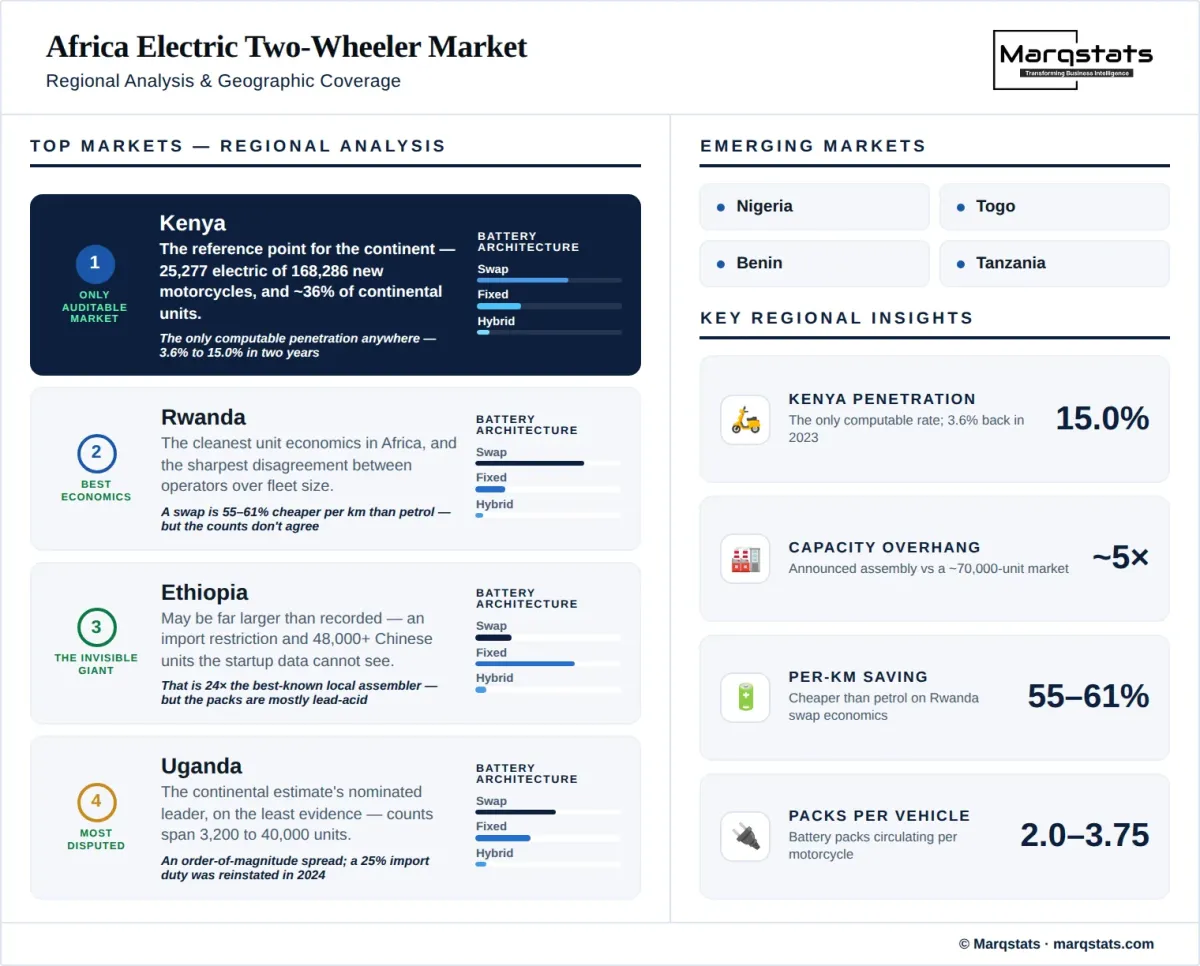
The only auditable market on the continent and the reference point for everything else in this report. New motorcycle registrations were 168,286 in 2025 of which 25,277 were electric — a 15.02% share, four times the modelled continental rate, and roughly 36% of continental electric units on this model. The new-registration trajectory is documented rather than estimated: 3.62% in 2023, 7.07% in 2024, 15.02% in 2025. But Kenya also demonstrates the continental data problem in miniature. Four official or semi-official values circulate for its cumulative electric vehicle stock — and two of them, 24,754 and 39,324, were published on the same day, 3 February 2026, around the same policy launch, with 35,000-plus and 43,324 alongside them. If the best-documented market on the continent cannot agree with itself to within 75% on a stock figure, the confidence attaching to any continental estimate should be set accordingly. Note also that two Kenyan registration series circulate and do not reconcile, and that the 15.3% share as published does not recompute from its own numerator and denominator.
Rwanda
The cleanest unit economics in Africa and the sharpest disagreement between operators. A swap costing RWF 2,450 for roughly 75 kilometres against petrol at RWF 2,938 a litre for 35 to 40 makes electric 55% to 61% cheaper per kilometre on a Marqstats derivation. But one operator claimed 25,000 motorcycles in Rwanda on 1 June 2026 and 28,000 a month later, while a competitor claims to lead the same capital nine to one on a 6,000-vehicle two-country fleet. Both cannot be true, and no Rwandan registration series exists to settle it.
Uganda
The market the continental estimate nominates as the largest, and the one where the evidence least supports it. Counts for 2025 and 2026 range from 3,200 to 40,000 depending on source, spanning more than an order of magnitude — and they are not even the same measure, since the 3,200 is a two- and three-wheeler stock snapshot while the disputed 30,000 is presented as annual two-wheeler sales. Reporting on the national e-mobility strategy put the electric fleet near 5,000 and under 1% of the total in May 2026. Uganda also reinstated a 25% import duty on finished electric motorcycles in mid-2024, which is inconsistent with the picture of a market pulled forward by policy.
Ethiopia
The market that may be much larger than the continental figure records, and for a reason that has nothing to do with the startups. Ethiopia restricts imports of internal-combustion vehicles — a vehicle-import measure, not the fuel-import ban it is frequently described as — and one Chinese manufacturer stated in June 2026 that it had sold more than 48,000 electric motorcycles there over three years. That is 24 times the deployed fleet of the best-known local assembler. Its product is described as using graphite batteries, which almost certainly means lead-acid, so the units may not belong in a lithium market at all; but the episode shows that dealer-sold imported product is invisible to the way this sector is measured.
West Africa
Togo and Benin form the second cluster, built around one operator's regional footprint and financed through a guarantee-backed borrowing base that enumerated 15,700 motorcycles and 31,400 batteries separately. Nigeria sits alongside them on operator footprint alone: it has no published electric two-wheeler unit series at all, and its named financing is a state-backed facility and a venture round rather than the guarantee structure used to the west. On a single retailer's price estimates — the weakest evidence in this study — the Nigerian electric premium appears to be roughly zero against the 10% to 115% observed in Kenya, which would make it the easiest conversion on the continent if it could be confirmed.
How Competition Is Evolving
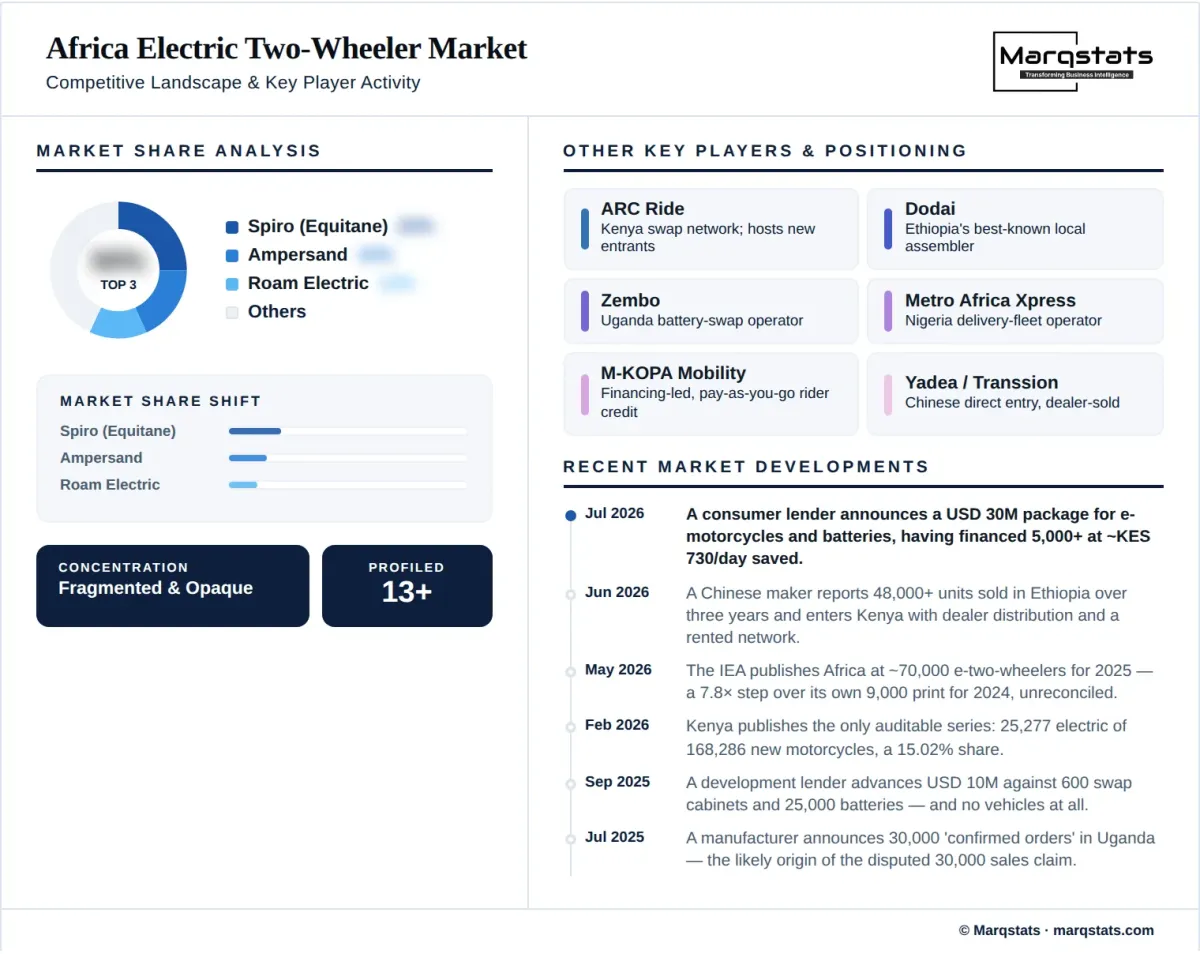
No continental league table is supportable from published evidence, and this report does not construct one. Company disclosures are voluntary, inconsistent in what they count, and in several cases mutually contradictory. A defensible ranking exists for Kenya alone, where national registration data gives one operator 5,390 of 9,368 electric units between January and August 2025 — a 57.5% share on a Marqstats derivation. That same data disproves the widely repeated claim that the operator holds 21% of Kenya's motorcycle market: against all motorcycle registrations its actual share is about 5.5%.
The disclosure problems are worth stating plainly, because they shape what any reader can safely conclude. One operator's country claims break its own continental claim — 22,000 in Kenya plus 28,000 in Rwanda leaves half of a stated 100,000 for five other markets, and the 100,000 figure counts electric vehicles including three-wheelers rather than two-wheelers alone. The same operator's Rwandan swap-station count fell from roughly 350 to just over 300 between consecutive monthly reports, which networks do not do. A second operator has never published an achieved fleet number at all — every figure located is a target or a financed plan — and is more accurately described as a development-finance-backed pilot at 27 stations than as a scale operator. A third markets its ability to turn batteries into bankable financial assets, with a retention statistic aimed squarely at underwriters rather than at riders.
Against that fragmented and partly self-reported field sit two structural forces. The first is Chinese direct entry: manufacturers arriving with dealer distribution, scale pricing and rented access to somebody else's swap network, raising no African venture capital and therefore appearing in none of the databases through which this sector is usually observed. The second is a capacity overhang — roughly 348,000 units a year of announced African assembly capacity against a continental market near 70,000, with one manufacturer running at 7% to 9% of nameplate. A market that is five times over-built at the factory gate while its riders wait for swap stations is not short of manufacturing; it is short of demand density and working capital.
Companies Covered
Companies covered in the report include:
Recent Market Activity
Table of Contents
Coverage & Segmentation
This study covers battery-electric two-wheelers — motorcycles and mopeds — sold or deployed in Africa. Electric three-wheelers are excluded, which is a material exclusion because several widely quoted operator figures combine the two and at least one continental stock estimate includes three-wheelers while the sales series used here does not. Battery swapping is treated as a segment dimension rather than a separate market. Lead-acid two-wheelers are outside scope, a boundary that matters in Ethiopia, where the largest reported volumes are described in terms suggesting lead-acid chemistry, and in Tanzania, where a reported fleet of about 10,000 scooters is described as mostly lead-acid. This report is the electric child of the Marqstats all-powertrain Africa Two-Wheeler Market report and the continental parent of the East African country reports; the boundaries are stated so the four do not overlap.
Market value is measured at vehicle retail price in United States dollars. Unlike the single-country reports in this series, no local-currency series is published alongside it, because there is no single local currency: Kenya, Rwanda, Uganda, Ethiopia, Nigeria, Togo and Benin all price in their own, and exchange-rate risk in this market sits with the operator across several currencies at once rather than with the market as a whole. The base year is 2025, the historical period 2021 to 2025 and the forecast period 2026 to 2030. Unit volumes for 2025 are the published continental estimate; volumes for 2021 to 2024 are a Marqstats reconstruction on that same basis and are not the source's own back-series, which sits on a narrower definition.