Market Snapshot
Middle bar: base-year value × (1 + CAGR), rounded to two decimals. This is a calculated illustration, not a separately researched annual estimate.
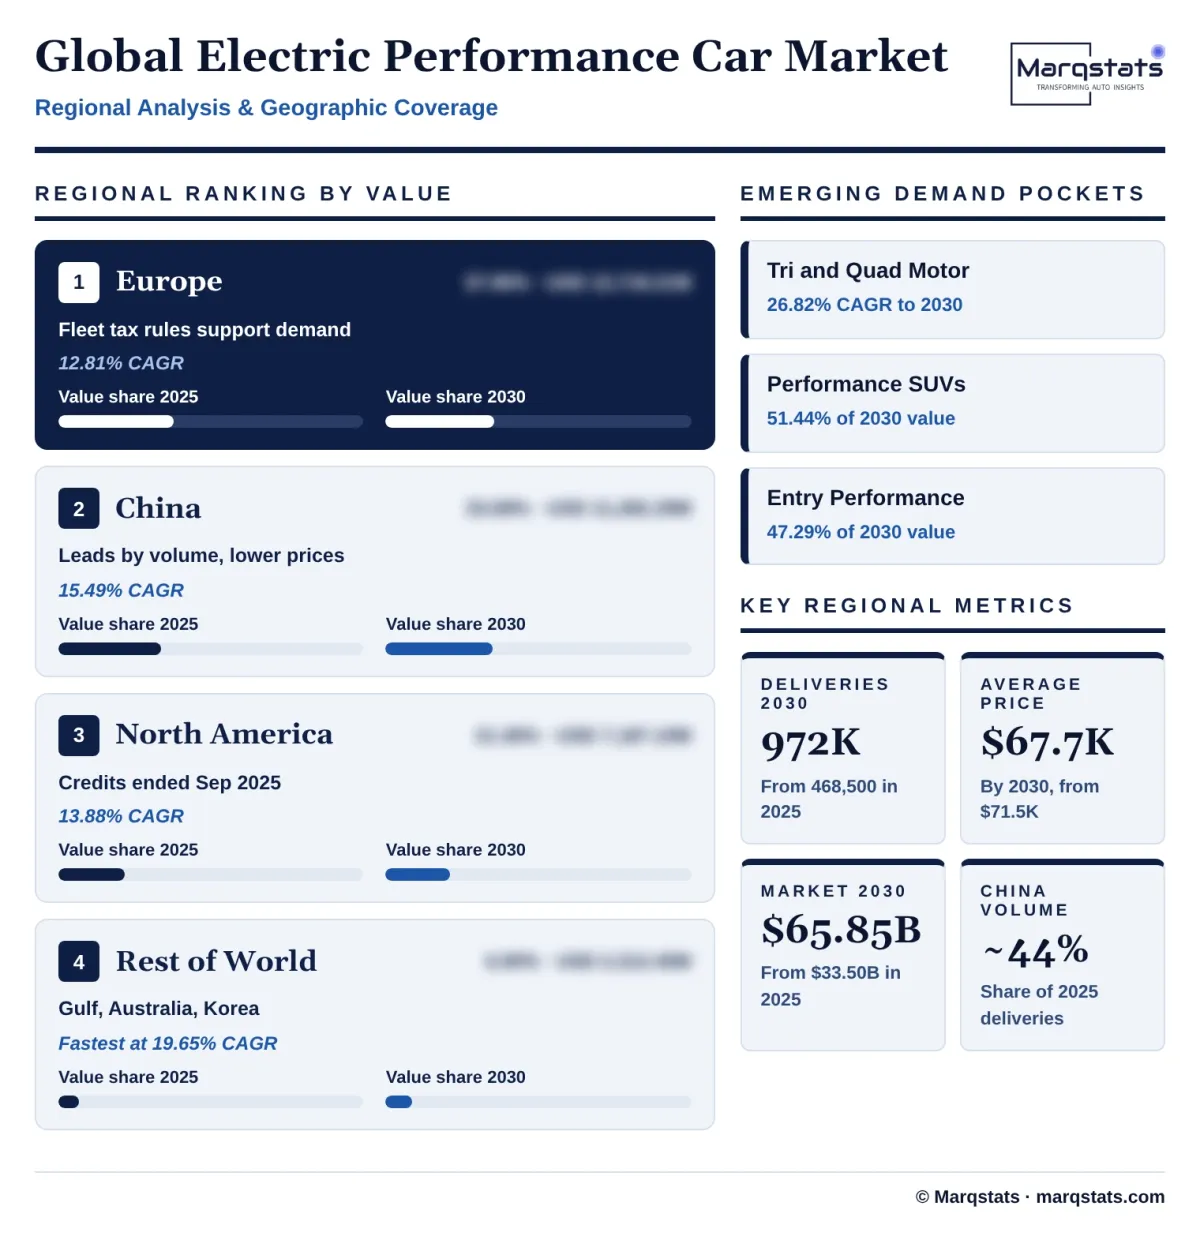
The global electric performance car market size is estimated at USD 33,500.00 million in 2025 and is projected to reach USD 65,850.00 million by 2030, growing at a CAGR of 14.47% over 2026 – 2030. Deliveries rise from about 468,500 cars to 972,000, a 15.72% annual rate, while the average ex-factory price eases from about USD 71,504 to USD 67,747 as Chinese makers offer very high power at mainstream premium prices.
Marqstats defines the market as the ex-factory wholesale value of road-legal battery electric and dedicated performance plug-in hybrid passenger cars that deliver at least 300 kW of system power, accelerate from 0 to 100 km/h in 4.0 seconds or less, use thermal management rated for repeated high-load driving and sit in a carmaker's performance trim or sub-brand. Mainstream electric cars, utility crossovers without performance hardware, track-only prototypes and conversions are excluded. The market overlaps with the Marqstats global electric luxury car study for performance models priced above about USD 50,000, so the two markets should not be added together.
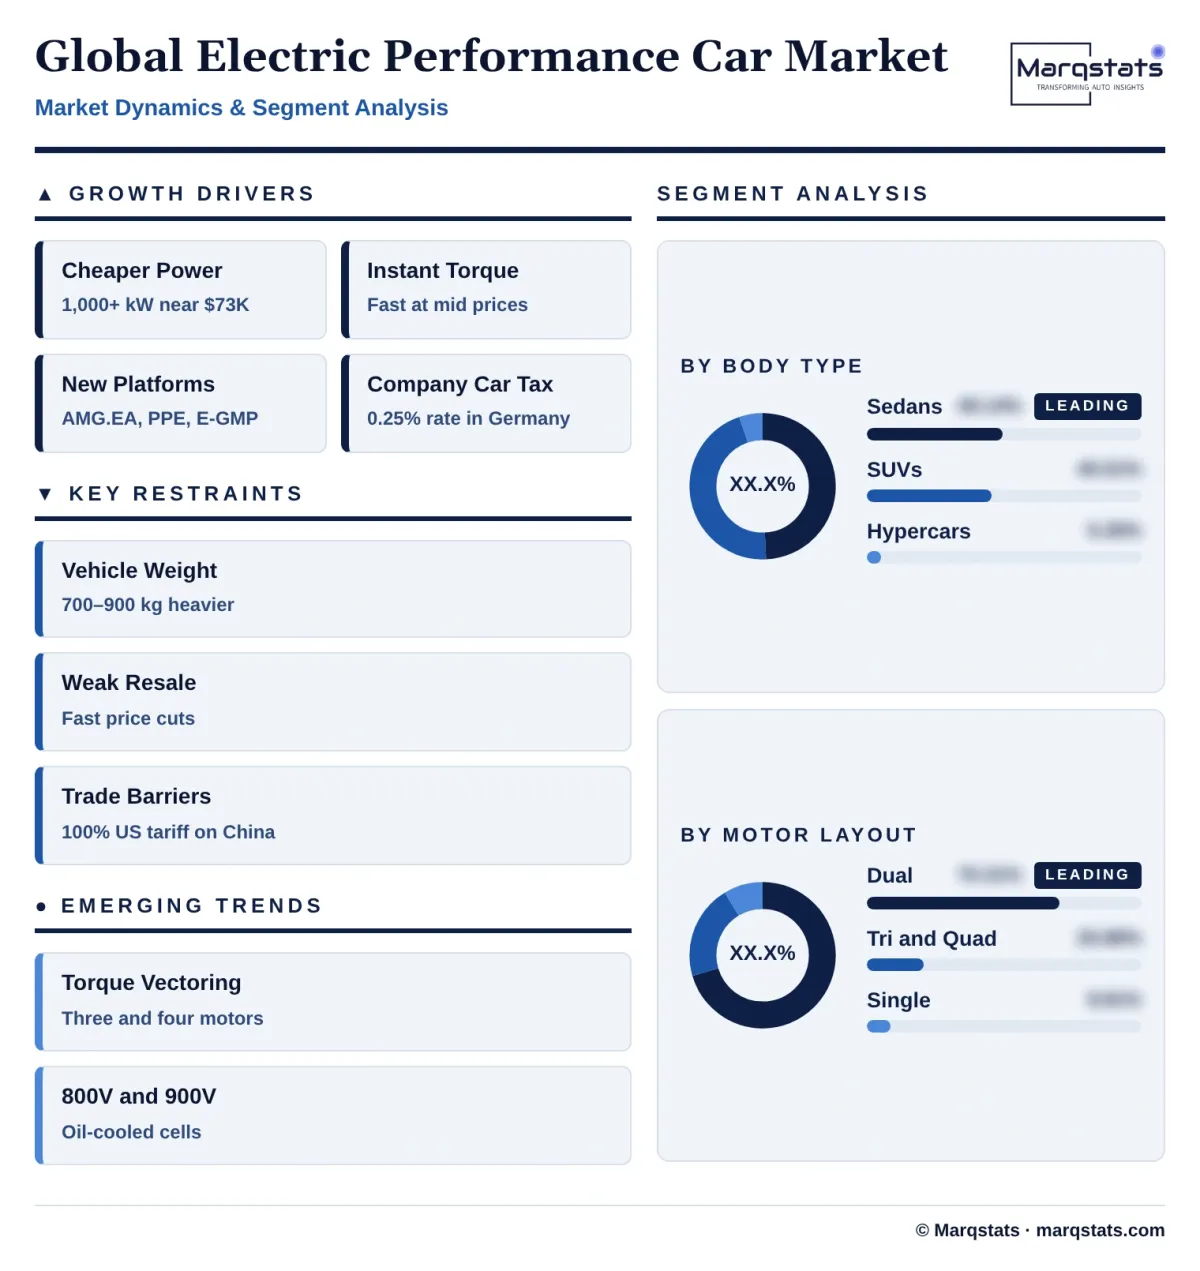
Performance sedans and fastbacks account for an estimated 49.14% of 2025 value, dual-motor all-wheel-drive cars for 70.31% and entry performance models priced at USD 50,000 to 80,000 for 42.72%. China accounts for about 44% of 2025 deliveries, while Europe is the largest region by value at 37.96%. The study segments the market by body type, motor layout, price tier and region.
Key Takeaways
Market Overview & Analysis
Report Summary
Marqstats sizes the global electric performance car market as the ex-factory value of high-output electric passenger cars delivered to customers. In 2025 about 468,500 cars qualified, worth an estimated USD 33,500.00 million at an average ex-factory price of about USD 71,504. The market sits within a global electric car market of more than 20 million cars a year, and within a premium electric segment of nearly 3 million cars, but includes only models with the power, acceleration, cooling and chassis hardware for repeated high-performance driving.
Four groups compete. European premium makers sell performance versions of electric platforms, including Porsche with the Taycan and Macan Electric, BMW M with the i4 M60, i5 M60 and i7 M70, Mercedes-AMG with its new AMG.EA platform and Audi Sport with the RS e-tron GT. Chinese makers, led by Xiaomi, BYD's Yangwang and Denza brands, Zeekr and Lotus, offer very high power at lower prices. Korean makers sell the Hyundai Ioniq 5 N and Ioniq 6 N and Kia GT models. Specialist and US makers include Tesla, Lucid, Polestar and Bugatti Rimac.
Performance is defined by more than acceleration. Repeated launches and fast laps generate heat in the battery, motors and inverters, so qualifying cars use liquid-cooled or oil-cooled cells, high-voltage architectures and cooling systems that prevent the car from cutting power after a few hard runs. Brakes, tyres and suspension are uprated to cope with vehicle weights of up to 2.4 tonnes, and software controls torque at each wheel.
The market grew from about 184,200 cars worth USD 14,180.00 million in 2021 to 248,500 cars in 2022, 335,000 in 2023 and 401,800 in 2024, worth USD 29,330.00 million. Marqstats expects about 538,000 deliveries worth USD 38,200.00 million in 2026, 624,000 in 2027, 728,000 in 2028 and 845,000 in 2029.
The market has shifted in the last two years. Chinese performance sedans and SUVs have taken volume from European sports sedans, Tesla has retired its Model S and Model X flagships, and European makers have moved toward shared multi-energy platforms and plug-in hybrids. At the same time, new flagships such as the Mercedes-AMG GT 4-Door Coupé with 860 kW and 600 kW charging show that European makers continue to invest at the top of the market.
Weight shapes the economics of using these cars hard. A 2,360 kg electric sedan braking from 250 km/h must shed about 55% more energy than a 1,520 kg petrol sports car, so friction brakes reach very high temperatures despite regenerative braking. Marqstats estimates tyre and brake costs of about USD 4.85 per track kilometre for a heavy electric performance sedan, against about USD 2.10 for a lightweight petrol sports car. Carmakers respond with 430 to 440 mm carbon-ceramic brakes, active rear steering, active aerodynamics and software that splits torque between the rear wheels.
Global Electric Performance Car Market Size and Forecast
The global electric performance car market grows from USD 33,500.00 million in 2025 to USD 65,850.00 million in 2030, a CAGR of 14.47%. Marqstats expects USD 43,840.00 million in 2027, USD 50,560.00 million in 2028 and USD 57,970.00 million in 2029. Growth is slower than the 23.98% a year recorded between 2021 and 2025, when the first wave of electric performance models launched.
Volume grows faster than value. Deliveries grow at 15.72% a year while value grows at 14.47%, because the average ex-factory price falls from about USD 71,504 in 2025 to USD 67,747 in 2030. Lower battery and power electronics costs, and a larger share of Chinese models priced well below European equivalents, drive the decline.
China is the swing factor. Marqstats estimates Chinese performance deliveries rise from about 206,000 in 2025 to about 442,000 in 2030. A five-point lower adoption rate in China would cut 2030 market value by about USD 3,400 million, while a USD 1,000 change in the global average price moves 2025 value by about USD 468.50 million.
The mix shifts toward SUVs, multi-motor cars and entry performance models. SUVs and crossovers rise from 45.51% to 51.44% of value, tri-motor and quad-motor cars from 20.88% to 34.85%, and entry performance models from 42.72% to 47.29%. Dedicated coupes and hypercars, including the Bugatti Rimac Nevera, Yangwang U9 and MG Cyberster, rise from 5.36% to 6.74% of value.
Marqstats tracks four indicators to monitor the forecast: deliveries of Chinese performance models, the price gap between Chinese and European performance cars, the launch timing of new European performance platforms, and incentives for electric company cars in Germany and the United Kingdom. Faster price cuts by Chinese makers would raise volume but lower average prices, while delays to European launches would slow value growth.
Regional growth differs. China grows from about 206,000 deliveries to about 442,000 by 2030 and its value share rises from 33.68% to 35.20%, while Europe's share eases from 37.96% to 35.29% as fleet incentives mature. North America grows at 13.88% a year despite the loss of federal credits, helped by new models from Hyundai, Kia, BMW, Mercedes-AMG and Porsche, and the Rest of World rises from 6.90% to 8.61% of value as Chinese makers expand in the Gulf, Australia and Southeast Asia.
Market Dynamics
Key Drivers
Six forces are expanding demand for high-output electric cars.
- Lower-cost high power. Chinese makers combine in-house motors, silicon carbide inverters and local battery supply to offer more than 1,000 kW at prices close to mainstream premium cars, widening the buyer base.
- Instant torque appeals to buyers. Electric motors deliver full torque from standstill, so even mid-priced electric cars match the acceleration of expensive petrol sports cars, and carmakers use performance trims to lift margins on shared platforms.
- New performance platforms. Mercedes-AMG's AMG.EA platform, Porsche's Premium Platform Electric, BMW's Neue Klasse and Hyundai's E-GMP give carmakers dedicated hardware for high-output cars.
- Company car tax rules. Germany taxes electric company cars at 0.25% of list price a month for cars up to EUR 100,000 and offers accelerated depreciation, and the UK applies low benefit-in-kind rates, supporting fleet purchases of electric performance models.
- Faster charging. 800V and 900V architectures allow 10% to 80% charging in 11 to 18 minutes, reducing a key drawback for long-distance performance driving.
- Motorsport and track records build demand. Nürburgring lap records by the Xiaomi SU7 Ultra and YU7 GT, the Porsche Taycan Turbo GT and others give electric performance cars credibility with enthusiasts and support pricing.
Key Restraints
Five constraints limit how fast electric performance cars can grow.
- Weight. Large battery packs add 700 to 900 kg compared with petrol sports cars, raising tyre and brake wear and limiting repeated track performance.
- Weak resale values. Fast-changing technology and price cuts by new entrants reduce residual values for electric performance cars, discouraging private buyers.
- Trade barriers. US tariffs of 100% on Chinese-built electric cars and US connected-vehicle rules keep Chinese performance models out of the United States, while EU countervailing duties raise their prices in Europe.
- Falling support in the United States. Federal clean vehicle credits ended on 30 September 2025 and vehicle greenhouse gas standards were repealed in February 2026, reducing pressure on carmakers to sell high-output electric cars there.
- Charging on track and long trips. Public chargers rarely deliver full speed in hot or cold weather, and few circuits offer high-power charging, limiting use of electric performance cars at track days and on long drives.
Key Trends
Four shifts are changing how electric performance cars are engineered and sold.
- Multi-motor torque vectoring. Three and four-motor layouts control drive torque at each rear wheel, improving cornering without wasting energy in the brakes.
- Oil-cooled cells and higher voltages. Flagship models adopt 800V and 900V systems, silicon carbide inverters and directly cooled cells to sustain power on track.
- Simulated gearshifts and sound. Hyundai's N models and Mercedes-AMG use synthetic engine sound and simulated gearshifts to give drivers feedback.
- Plug-in hybrid performance. Lotus and other makers are adding high-voltage plug-in hybrid and range-extender models alongside battery electric cars to address range and price concerns.
Strategic Implications
- For European premium makers, cost is now a competitive weapon. Shared multi-energy platforms and standard components help defend margins against Chinese rivals offering similar performance at lower prices.
- For Chinese makers, brand and export access matter most. Track records such as the Nürburgring laps of the Xiaomi SU7 Ultra and YU7 GT help build credibility, but tariffs and duties limit access to the United States and raise prices in Europe.
- For suppliers, thermal and chassis systems are the growth areas. Silicon carbide inverters, oil-cooled battery systems, carbon-ceramic brakes, active dampers and e-axles with torque vectoring gain content per car.
- For fleet and leasing companies, residual values are the main risk. Fast price cuts and technology changes require conservative residual assumptions on electric performance cars.
- For tyre and brake makers, heavier cars mean more wear. Specialist tyres and larger carbon-ceramic brakes for 2.3-tonne electric cars create a growing aftermarket.
- For policy makers, company car rules shape the European market. A large share of electric performance cars in Germany and the UK are bought as company cars, so changes to benefit-in-kind rates or depreciation rules would quickly change demand for high-priced electric models.
Market Segmentation
Performance sedans and fastbacks account for an estimated 49.14% of 2025 value, USD 16,460.82 million and about 248,300 cars, rising to USD 27,536.20 million by 2030, a 10.84% CAGR, while their share falls to 41.82%. The Xiaomi SU7 Ultra, Porsche Taycan, BMW i4 M60, Lotus Emeya, Hyundai Ioniq 6 N and the new Mercedes-AMG GT 4-Door Coupé lead the segment.
Performance SUVs and crossovers account for 45.51% of 2025 value, USD 15,245.23 million and about 210,800 cars, and grow at 17.31% a year to USD 33,872.48 million and 51.44% of the market by 2030, led by the Porsche Macan Electric, Polestar 4, Lotus Eletre, Xiaomi YU7 GT and Hyundai Ioniq 5 N.
Dedicated coupes and hypercars account for 5.36% of 2025 value, USD 1,793.95 million and about 9,400 cars, and grow at 19.88% a year to USD 4,441.32 million, including the Bugatti Rimac Nevera, Yangwang U9, Lotus Evija and MG Cyberster.
Dual-motor all-wheel-drive cars account for 70.31% of 2025 value, USD 23,554.69 million, rising to USD 38,854.39 million by 2030, a 10.53% CAGR, while their share falls to 59.00%.
Tri-motor and quad-motor cars account for 20.88% of 2025 value, USD 6,995.03 million, and grow fastest, at 26.82% a year, to USD 22,946.27 million and 34.85% of the market by 2030, led by the Xiaomi SU7 Ultra, Lucid Air Sapphire, Zeekr 001 FR and Mercedes-AMG GT 63.
High-output single-motor rear-drive cars account for 8.81% of 2025 value, USD 2,950.28 million, rising to USD 4,049.34 million by 2030, a 6.54% CAGR.
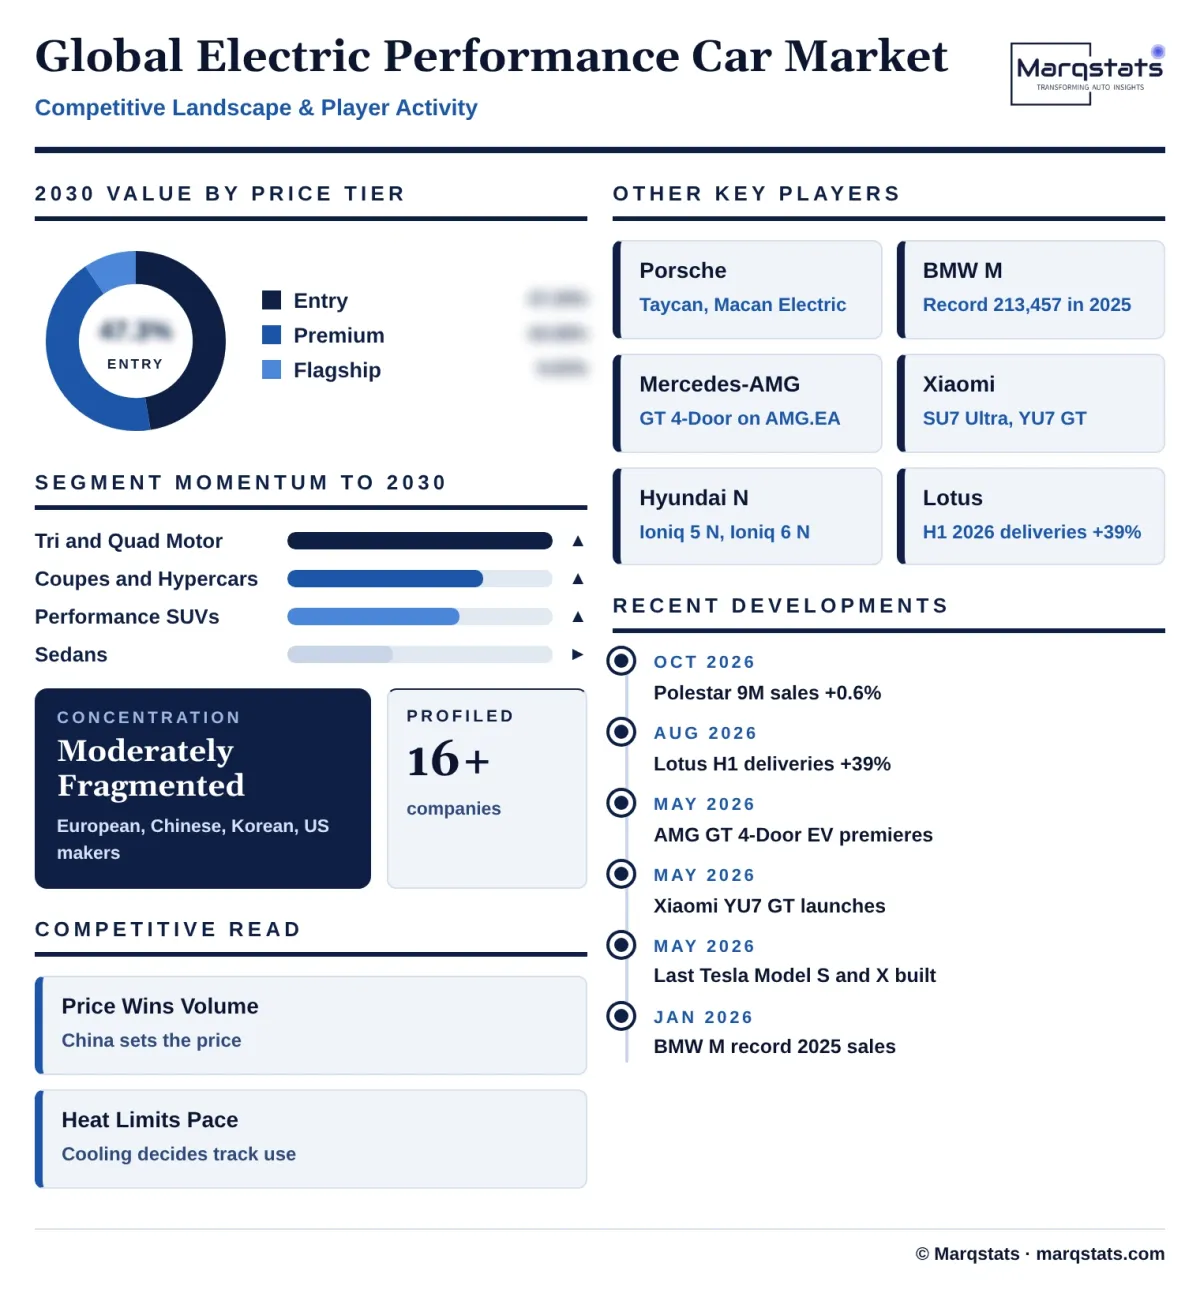
Entry performance models priced at USD 50,000 to 80,000 account for 42.72% of 2025 value, USD 14,311.03 million, and grow at 16.82% a year to USD 31,137.48 million and 47.29% of the market by 2030, led by Chinese performance sedans and SUVs, the Tesla Model 3 Performance and the Hyundai Ioniq 5 N.
Premium performance models priced at USD 80,000 to 150,000 account for 47.11% of 2025 value, USD 15,781.58 million, rising to USD 28,369.70 million by 2030, a 12.45% CAGR, including the Porsche Taycan 4S and Macan Turbo, BMW i5 M60 and Audi RS e-tron GT.
Flagships priced above USD 150,000 account for 10.17% of 2025 value, USD 3,407.39 million, rising to USD 6,342.82 million by 2030, a 13.23% CAGR, including the Lucid Air Sapphire, Porsche Taycan Turbo GT, Mercedes-AMG GT 63 and Bugatti Rimac Nevera R.
By Geography
Europe
Europe is the largest market by value, with an estimated 37.96% of 2025 value, USD 12,718.21 million and about 145,200 cars, rising to USD 23,236.08 million by 2030, a 12.81% CAGR. Germany's low tax rate for electric company cars and accelerated depreciation support fleet purchases, the UK applies low benefit-in-kind rates, and EU fleet CO2 targets, now averaged over 2025 to 2027, keep carmakers selling electric performance models. Battery electric cars reached 17.4% of EU registrations in 2025.
China
China is the largest market by volume, with about 44% of 2025 deliveries, and accounts for 33.68% of 2025 value, USD 11,282.29 million, rising to USD 23,177.59 million by 2030, a 15.49% CAGR. Xiaomi, BYD's Yangwang and Denza brands, Zeekr and others offer very high power at lower prices than European rivals, supported by local battery, motor and power electronics supply.
North America
North America accounts for 21.45% of 2025 value, USD 7,187.10 million, rising to USD 13,764.97 million by 2030, a 13.88% CAGR. Tesla, Lucid, Porsche, BMW, Mercedes-AMG, Hyundai and Kia lead, but the end of federal clean vehicle credits in September 2025, the repeal of vehicle greenhouse gas standards in 2026 and the end of Tesla Model S and Model X production weigh on growth, and 100% tariffs block Chinese-built models.
Rest of World
The Rest of World accounts for 6.90% of 2025 value, USD 2,312.40 million, and grows fastest, at 19.65% a year, to USD 5,671.36 million by 2030, led by the Gulf states, Australia, South Korea and Southeast Asia, where Chinese performance models are expanding.
How Competition Is Evolving
The electric performance car market is moderately fragmented. European premium makers, Chinese technology and car companies, Korean makers and specialist US and European brands compete across price tiers from about USD 50,000 to more than USD 2 million.
European makers are defending positions with new platforms and shared architectures. BMW M delivered a record 213,457 cars in 2025, combining electric models such as the i4 M60 with petrol and hybrid models, while Porsche Taycan deliveries fell about 22% in 2025 and the company took heavy charges as it rebalanced its electric plans. Mercedes-AMG premiered the electric GT 4-Door Coupé on its AMG.EA platform in May 2026.
Chinese makers compete on price and technology. Xiaomi's SU7 Ultra and YU7 GT deliver very high power with track records at the Nürburgring, and BYD, Zeekr and Lotus offer high-output sedans, SUVs and hypercars. Lotus delivered 3,904 cars in the first half of 2026, up 39%.
Specialist and US makers face mixed conditions. Tesla ended Model S and Model X production in May 2026, Lucid sells the Air Sapphire as its flagship, and Polestar increased retail sales 34% to about 60,119 cars in 2025 but grew only 0.6% in the first nine months of 2026.
Competition will be decided by price, thermal performance and brand credibility. Makers that combine sustained track performance, fast charging and competitive prices will gain share as performance moves into the mainstream premium price range.
Suppliers play a growing role. CATL supplies high-discharge battery packs for Chinese flagships, Bosch, ZF, BorgWarner and GKN supply e-axles and inverters, and brake and damper specialists supply carbon-ceramic brakes and adaptive suspension. Carmakers that develop motors, inverters and battery packs in-house, such as Xiaomi, BYD, Tesla and Lucid, can push power higher at lower cost, while European makers increasingly share platforms across brands to spread development costs.
Companies Covered
Companies covered in the report include:
Recent Market Activity
Table of Contents
Coverage & Segmentation
The study covers the global electric performance car market, with 2025 as the base year, 2021 – 2025 as the historical period and 2026 – 2030 as the forecast period. Values are ex-factory wholesale prices in US dollars at constant 2025 exchange rates, and volumes are customer deliveries. The market is segmented by body type, motor layout, price tier and region. Performance models priced above about USD 50,000 are also included in the Marqstats global electric luxury car study.
Mainstream electric cars, crossovers without performance hardware, light commercial vehicles, track-only prototypes, used cars and aftermarket conversions are excluded. Segment value splits, 2030 regional deliveries and regional values are Marqstats estimates built on carmaker delivery and financial disclosures, registration data and price benchmarks.