Market Snapshot
Key Takeaways
Market Overview & Analysis
Report Summary
Indonesian vehicle distribution is one of the most concentrated channel structures in the region and it is being contested for the first time by entrants that do not need the incumbent network. The group holding 51% of the car market built that position over decades of franchised coverage. The brands taking share fastest arrived within three years and paired distribution rights with local assembly from the start.
The measure is the gross margin captured between the factory gate and the retail customer by sole distributors, multi-brand dealer groups and manufacturer-owned sales subsidiaries, covering new vehicle margin, finance and insurance commission, and the parts and service attachment that follows a new vehicle sale. Vehicle retail value is excluded and sized separately at USD 10.33 billion for passenger cars alone, as is assembly value added at USD 1,947.00 million. Used vehicle retail and standalone aftermarket are excluded.
The analysis is written for distributors deciding whether to add an entrant brand to an existing portfolio, entrants weighing a franchised network against direct retail, financiers sizing the commission pool attached to vehicle sales, and investors who need channel margin kept distinct from the vehicle value it is earned on.
Indonesia Car Dealership Market Size and Forecast
Channel margin is estimated at USD 924.34 million in 2025 and USD 1,277.83 million by 2030, an increase of USD 353.49 million. Distribution volume moves from 803,687 to an estimated 1,020,000 vehicles at 4.88%, an increase of 216,313 units, while blended margin per vehicle rises from IDR 19.32 million to IDR 21.05 million, or USD 1,150 to USD 1,253 at a constant IDR 16,800 per USD.
The volume base is the association headline total of 803,687 units, and that is a deliberate departure from the passenger car panel built on this cluster. That panel separates out 195,000 commercial vehicles, an estimated 24.26% of the headline total, and counts 608,687 passenger cars, because brand shares are distorted by the combined base. A distribution panel does not separate them, because the same dealer groups retail both and the 51% share reported by the largest group is measured on the combined base.
Margin compounds 1.81 points ahead of volume at 6.69% against 4.88%, and the mechanism is brand mix rather than pricing. Margin per vehicle differs by more than three times across tiers, from an estimated IDR 9.5 million on an entry passenger vehicle to an estimated IDR 29.0 million on a commercial vehicle, so a shift toward richer tiers lifts the pool faster than the unit count.
The panel is built bottom-up by brand tier rather than by applying a single margin rate. In 2025 an estimated 210,000 entry passenger units carried IDR 9.5 million each, 300,000 mainstream passenger units IDR 21.0 million, 98,687 Chinese and new-entrant units IDR 16.0 million, and 195,000 commercial vehicles IDR 29.0 million. That construction is what makes the mix effect visible rather than assumed.
Half the Market Sits With One Group
PT Astra International reported a 51% share of the domestic car market in 2025 and a 78% share of the national motorcycle market through PT Astra Honda Motor. Divisional net profit held at IDR 11,365 billion, effectively flat against the prior year, through a period in which national car sales contracted. A distribution position that holds its earnings while its market shrinks is a structural position rather than a cyclical one.
Sole distributors and agents account for an estimated USD 471.41 million of channel margin in 2025, 51.00% of the pool, falling to an estimated 44.99% by 2030 at a 4.05% compound rate. The share reconciles with the reported market share rather than coinciding with it, because the sole distribution model is how that group holds its position: distribution rights granted brand by brand and held across the full national network.
Multi-brand dealer groups account for an estimated 33.00% of channel margin, and this is where the entrants are landing. Indomobil Group distributes Leapmotor while having invested in the Purwakarta plant that assembles it, partnered Hongqi in August 2026 to add a third new-energy brand alongside Leapmotor and Suzuki, and manufactures and sells Suzuki through its own subsidiaries.
The incumbent brands themselves are still the volume. Daihatsu retailed 84,959 units between January and July 2026, up 9%, with the Gran Max Pickup at 29,099 units or 34%, Sigra at 19,427 or 23% and the Gran Max Minibus at 14,698 or 17%. Suzuki sold more than 64,000 units in 2025 with the Carry at 47% of retail and the XL7 at 20%. Both portfolios are commercial and entry-led rather than premium.
The Entrants Bought Assembly and Distribution Together
Every significant Chinese entrant paired distribution with local assembly rather than importing through an agent. Leapmotor began assembly at an Indomobil-invested plant at Purwakarta in August 2026 with initial capacity of about 10,000 units a year rising to 34,000, and launched through the Indomobil distributor at IDR 499 million for the B10 and IDR 618 million for the C10.
XPeng went further and bought its assembler. In May 2026 it acquired 90.1% of an Indonesian assembler from a listed retailer, which retained 9.9% and continues to handle distribution, sales and aftersales while the assembler focuses on manufacturing. XPeng targets 25 network locations nationwide and has delivered more than 1,000 locally produced vehicles.
The same pattern repeats across the cohort. Geely's EX2 is assembled at a Purwakarta contract plant at 46.5% local content and took more than 1,500 pre-orders at an introductory IDR 229 million, Polytron is built at the same plant on 2025 production of 531 units against wholesale of 455 and retail of 353, running 154 units in January 2026, and Farizon entered through Arista Group with assembly from August 2026.
Ownership of the distribution relationship is therefore the contested asset rather than the showroom. Channel margin from Chinese and new-entrant brands grows from an estimated USD 93.99 million to an estimated USD 316.07 million at a 27.45% compound rate, the fastest tier, reaching an estimated 24.73% of the pool. A distributor that lands two of these brands changes its own trajectory more than a decade of incumbent growth would.
The Showroom Is Not the Only Format Any More
Direct and brand-store retail grows at 38.36% from an estimated USD 27.74 million to an estimated USD 140.66 million, reaching an estimated 11.01% of channel margin by 2030. Leapmotor opened its first Indonesian dealership inside a Stellantis brand house in North Jakarta, operating alongside Citroen and Jeep with sales, test drives and aftersales in one facility.
Chery's LEPAS opened its first showroom anywhere in the world in Jakarta in January 2026, displaying its flagship alongside a guide robot, as the start of a global integrated brand and dealership rollout. A market that receives a brand's first global store is being treated as a proving ground rather than as a follower market.
Motor shows function as a retail channel here rather than as promotion. The February 2026 event drew 579,337 visitors across 35 four-wheel and 26 two-wheel brands against a transaction target above IDR 8 trillion, and GAC took 2,095 orders there, led by the Aion UT at 997 and the Aion V at 552. Honda filled a 100-unit allocation in one day at the mid-year show, taking 132 reservations against it at IDR 438 million, and another 100-unit allocation in three days in January.
Two-wheeler distribution shows the format shift at its most compressed. One entrant opened 20 electric motorcycle dealerships in a single week in July 2026 across seven cities, having signed seven dealer partners in February, and holds fleet supply agreements covering 20,000 vehicles by 2028 across two operators.
Where the Margin Actually Comes From
New vehicle gross margin accounts for an estimated USD 601.86 million in 2025, 65.11% of the pool, falling to an estimated 61.00% by 2030 at a 5.31% compound rate. It remains the largest stream and the slowest, which is the central economic fact of vehicle retail in a price-competitive market.
Finance and insurance commission accounts for an estimated 22.00% of the pool, rising to an estimated 24.00% at an 8.56% rate, and parts and service attachment from an estimated 12.89% to an estimated 15.00% at 9.98%. Together the non-vehicle streams move from an estimated 34.89% of channel margin to an estimated 39.00%.
Customer mix pulls in the same direction. Fleet and corporate margin grows at 10.25% and government and institutional at 12.73%, against 4.79% for retail private buyers, as fleet supply agreements and state procurement scale. Fleet demand also carries different economics, since a 20,000-vehicle supply agreement is negotiated once rather than sold one customer at a time.
The practical consequence for a distributor is that volume growth of 4.88% understates the opportunity and margin growth of 6.69% overstates how much of it comes from selling more cars. The difference is attachment, mix and channel, and a distributor that grows units without growing attachment will underperform this panel.
Market Dynamics
Key Drivers
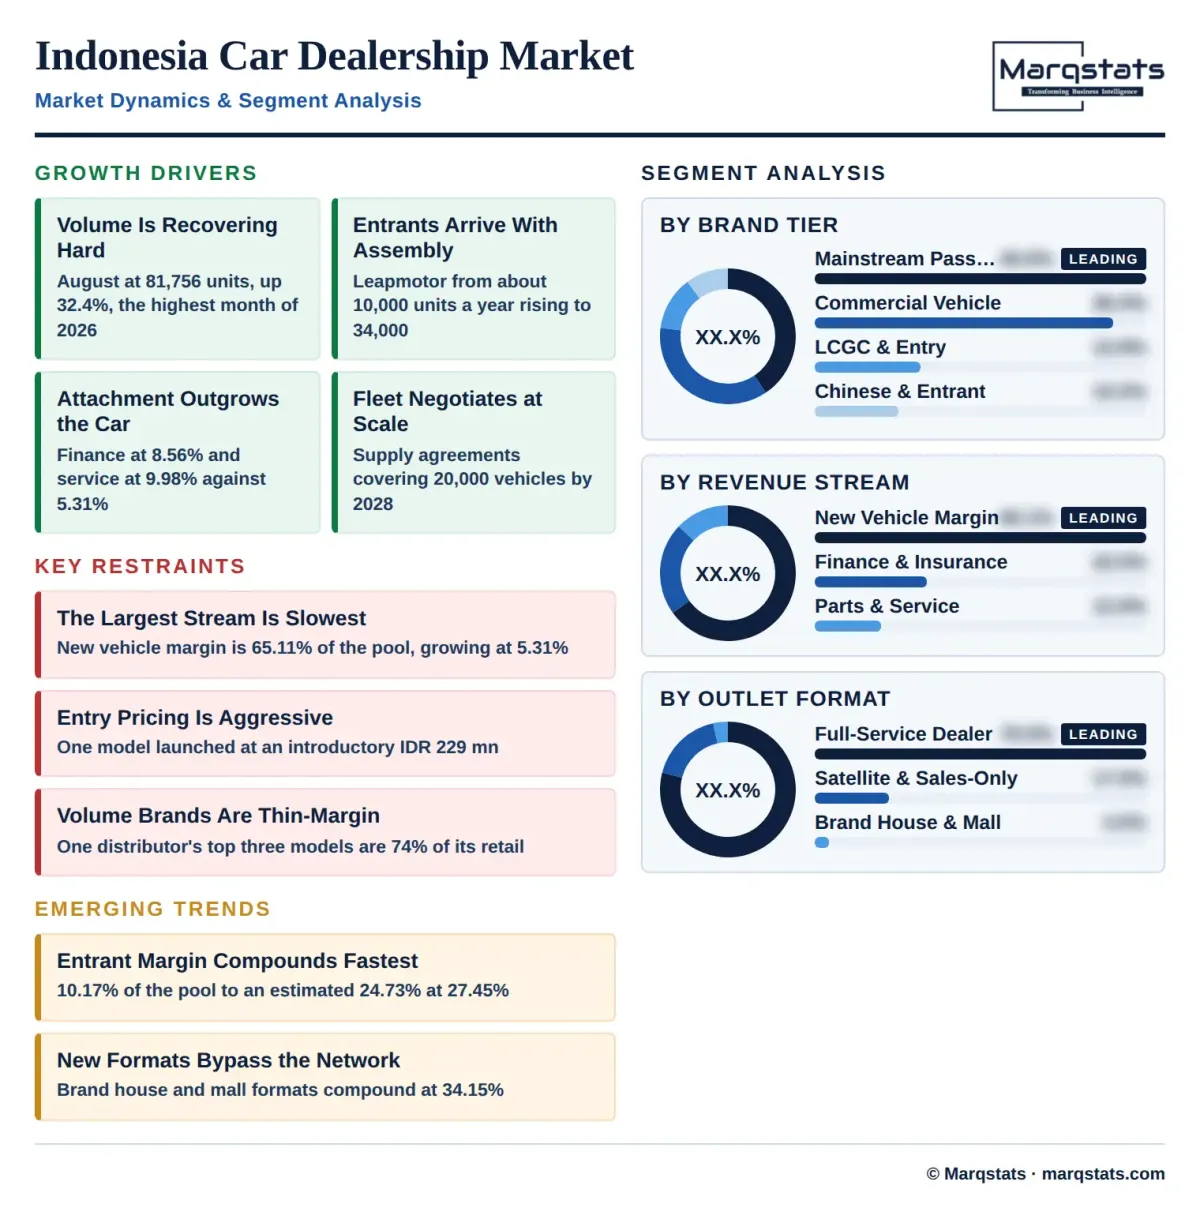
- National sales reached 81,756 units in August 2026, up 32.4% and the highest month of the year, taking January to August to 599,491 units, up 20.1% against an 850,000-unit target.
- New entrants are arriving with distribution and assembly together, with Leapmotor at about 10,000 units a year rising to 34,000 and Mazda at above 10,000 units on more than IDR 400 billion.
- Finance, insurance and aftersales attachment grow at 8.56% and 9.98% against 5.31% for new vehicle margin, enriching the pool independently of volume.
- Fleet demand is scaling through multi-year agreements, including supply commitments covering 20,000 vehicles by 2028 across two operators.
- Motor shows convert directly, with 579,337 visitors and a transaction target above IDR 8 trillion in February 2026 and 2,095 orders taken by a single brand.
Key Restraints
- New vehicle gross margin, the largest stream at an estimated 65.11% of the pool, grows slowest at 5.31% as entrants compete on price.
- Entry pricing from new brands is aggressive, with one model launched at an introductory IDR 229 million against more than 1,500 pre-orders.
- Volume brands are commercial and entry led, with one distributor's top three models at 74% of its retail and another's single model at 47%, both thin-margin categories.
- Direct and brand-store retail grows at 38.36%, which bypasses the franchised network that incumbent distributors have spent decades building.
Key Trends
- Chinese and new-entrant brands grow channel margin at 27.45%, reaching an estimated 24.73% of the pool from an estimated 10.17%.
- Sole distributors and agents fall from an estimated 51.00% of channel margin to an estimated 44.99% as multi-brand and direct models take share.
- Brand house and mall formats grow at 34.15%, reaching an estimated 11.00% of channel margin from an estimated 3.50%.
- Government and institutional buyers grow at 12.73% and fleet and corporate at 10.25%, against 4.79% for retail private buyers.
Market Segmentation
Mainstream passenger brands generated an estimated USD 375.00 million of channel margin in 2025, 40.57% of the pool and the largest tier, reaching an estimated USD 397.02 million or 31.07% by 2030 at a 1.15% compound rate. The tier carries an estimated 300,000 units at roughly IDR 21.0 million of margin each, and it grows slowest because entrant pricing lands directly on it.
Commercial vehicles generated an estimated USD 336.60 million in 2025, 36.42% of the pool, reaching an estimated USD 442.86 million or 34.66% by 2030 at a 5.64% compound rate. An estimated 195,000 units carry roughly IDR 29.0 million of margin each, the richest tier per unit, and Gran Max pickups alone accounted for 29,099 units of one distributor's January to July 2026 retail. Truck distribution sits behind capacity of 75,000 units a year at one manufacturer, built on about USD 112.5 million with local content between 44.35% and 71.85%.
Chinese and new-entrant passenger brands generated an estimated USD 93.99 million in 2025, 10.17% of the pool, reaching an estimated USD 316.07 million or 24.73% by 2030 at a 27.45% compound rate, the fastest tier. BYD alone reached 9.6% of national sales in August 2026 on 7,870 units, up 207.2%, with Jaecoo at 4.0% on 3,300 units and Geely at 2.6% on 2,121.
Low cost green car and entry passenger brands generated an estimated USD 118.75 million in 2025, 12.85% of the pool, reaching an estimated USD 121.88 million or 9.54% by 2030 at a 0.52% compound rate, effectively flat. An estimated 210,000 units carry roughly IDR 9.5 million each, the thinnest margin per vehicle, exemplified by a model at 19,427 units and 23% of one distributor's retail.
Sole distributors and agents captured an estimated USD 471.41 million in 2025, 51.00% of channel margin, easing to an estimated USD 574.92 million or 44.99% by 2030 at a 4.05% compound rate. The share reconciles with the 51% of the domestic car market reported by the largest group in 2025, which also held 78% of motorcycles.
Multi-brand dealer groups captured an estimated USD 305.03 million in 2025, 33.00% of channel margin, reaching an estimated USD 383.35 million or 30.00% by 2030 at a 4.68% compound rate. One group distributes Leapmotor, partners Hongqi and manufactures and sells Suzuki, holding three new-energy brands alongside a legacy franchise.
Manufacturer-owned sales subsidiaries captured an estimated USD 120.16 million in 2025, 13.00% of channel margin, reaching an estimated USD 178.90 million or 14.00% by 2030 at an 8.29% compound rate. One entrant restructured into this model in May 2026 by acquiring 90.1% of its assembler while the seller retained 9.9% and kept distribution.
Direct and brand-store retail captured an estimated USD 27.74 million in 2025, 3.00% of channel margin, reaching an estimated USD 140.66 million or 11.01% by 2030 at a 38.36% compound rate, the fastest model. It covers brand houses, mall formats and manufacturer-operated outlets that bypass the franchised network entirely, a route available to brands whose local production is already established, such as one with more than 180,000 vehicles built since 2017 and exports to 22 countries on 119% year on year export growth.
New vehicle gross margin accounted for an estimated USD 601.86 million in 2025, 65.11% of the pool, reaching an estimated USD 779.48 million or 61.00% by 2030 at a 5.31% compound rate, the slowest stream. It thins because entrant pricing lands on the mainstream tier, with one model launched at an introductory IDR 229 million.
Finance and insurance commission accounted for an estimated USD 203.35 million in 2025, 22.00% of the pool, reaching an estimated USD 306.68 million or 24.00% by 2030 at an 8.56% compound rate. The stream grows faster than vehicle margin because attachment rates rise with fleet and institutional volume rather than with unit count alone.
Parts and service attachment accounted for an estimated USD 119.13 million in 2025, 12.89% of the pool, reaching an estimated USD 191.67 million or 15.00% by 2030 at a 9.98% compound rate, the fastest stream. Only the attachment that follows a new vehicle sale is counted here, with standalone aftermarket excluded as a separate market.
Full-service dealerships captured an estimated USD 730.23 million in 2025, 79.00% of channel margin, reaching an estimated USD 894.48 million or 70.00% by 2030 at a 4.14% compound rate. The format carries sales, service and parts under one roof and remains the backbone of incumbent coverage across the archipelago.
Satellite and sales-only outlets captured an estimated USD 161.76 million in 2025, 17.50% of channel margin, reaching an estimated USD 242.79 million or 19.00% by 2030 at an 8.46% compound rate. The format is how entrants reach 25 network locations without building full workshops, and how established groups extend into secondary cities.
Brand house and mall formats captured an estimated USD 32.35 million in 2025, 3.50% of channel margin, reaching an estimated USD 140.56 million or 11.00% by 2030 at a 34.15% compound rate. One entrant opened inside a group brand house in North Jakarta alongside two other marques, and another opened its first global showroom in Jakarta in January 2026.
Retail private buyers generated an estimated USD 657.28 million of channel margin in 2025, 71.11% of the pool, reaching an estimated USD 830.59 million or 65.00% by 2030 at a 4.79% compound rate. The category is the most exposed to entrant price competition and to the motor show order intake that increasingly sets the retail calendar.
Fleet and corporate buyers generated an estimated USD 203.35 million in 2025, 22.00% of the pool, reaching an estimated USD 331.24 million or 25.92% by 2030 at a 10.25% compound rate. Supply agreements covering 20,000 vehicles by 2028 across two operators show the scale at which this channel now negotiates.
Government and institutional buyers generated an estimated USD 63.71 million in 2025, 6.89% of the pool, reaching an estimated USD 116.00 million or 9.08% by 2030 at a 12.73% compound rate, the fastest customer type. State procurement of commercial vehicles drives it, and the margin per transaction is thinner than retail but the volume per order is far larger.
By Geography
Jakarta and Greater Jabodetabek
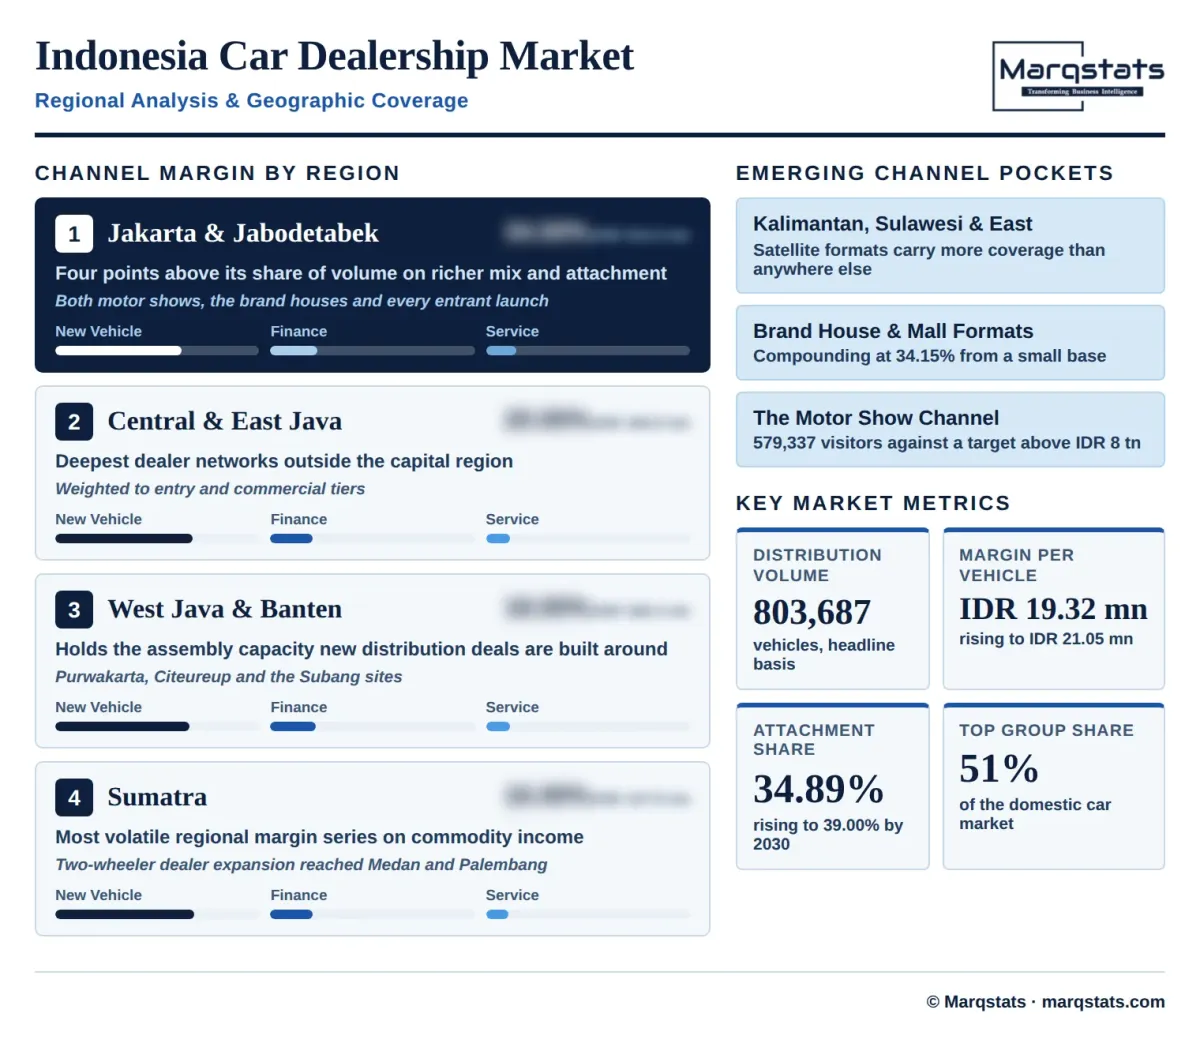
Jakarta and the surrounding metropolitan area account for an estimated USD 314.28 million of channel margin in 2025, 34.00% of the total, four points above the region's 30.00% share of passenger car volume because brand mix and attachment rates are both richer here. Both major motor shows, the brand house formats and every entrant launch sit in this region.
Central and East Java
Central and East Java account for an estimated USD 184.87 million, 20.00% of channel margin. The cluster is weighted toward entry and commercial tiers, which carry thinner and richer margin respectively, and its dealer networks are the deepest outside the capital region.
West Java and Banten
West Java and Banten account for an estimated USD 166.38 million, 18.00% of channel margin, and hold most of the assembly capacity that new distribution agreements are now built around, including the Purwakarta and Citeureup plants and the Subang sites.
Sumatra
Sumatra accounts for an estimated USD 147.89 million, 16.00% of channel margin. Commodity income drives purchase cycles more sharply than elsewhere, which makes the island the most volatile regional margin series, and two-wheeler dealer expansion reached Medan and Palembang in July 2026.
Kalimantan, Sulawesi and Eastern Indonesia
Kalimantan, Sulawesi and eastern Indonesia account for an estimated USD 110.92 million, 12.00% of channel margin. Logistics cost and network density make full-service formats harder to justify here, so satellite and sales-only outlets carry a higher share of coverage than in any other cluster, with Makassar reached in the July 2026 expansion.
How Competition Is Evolving
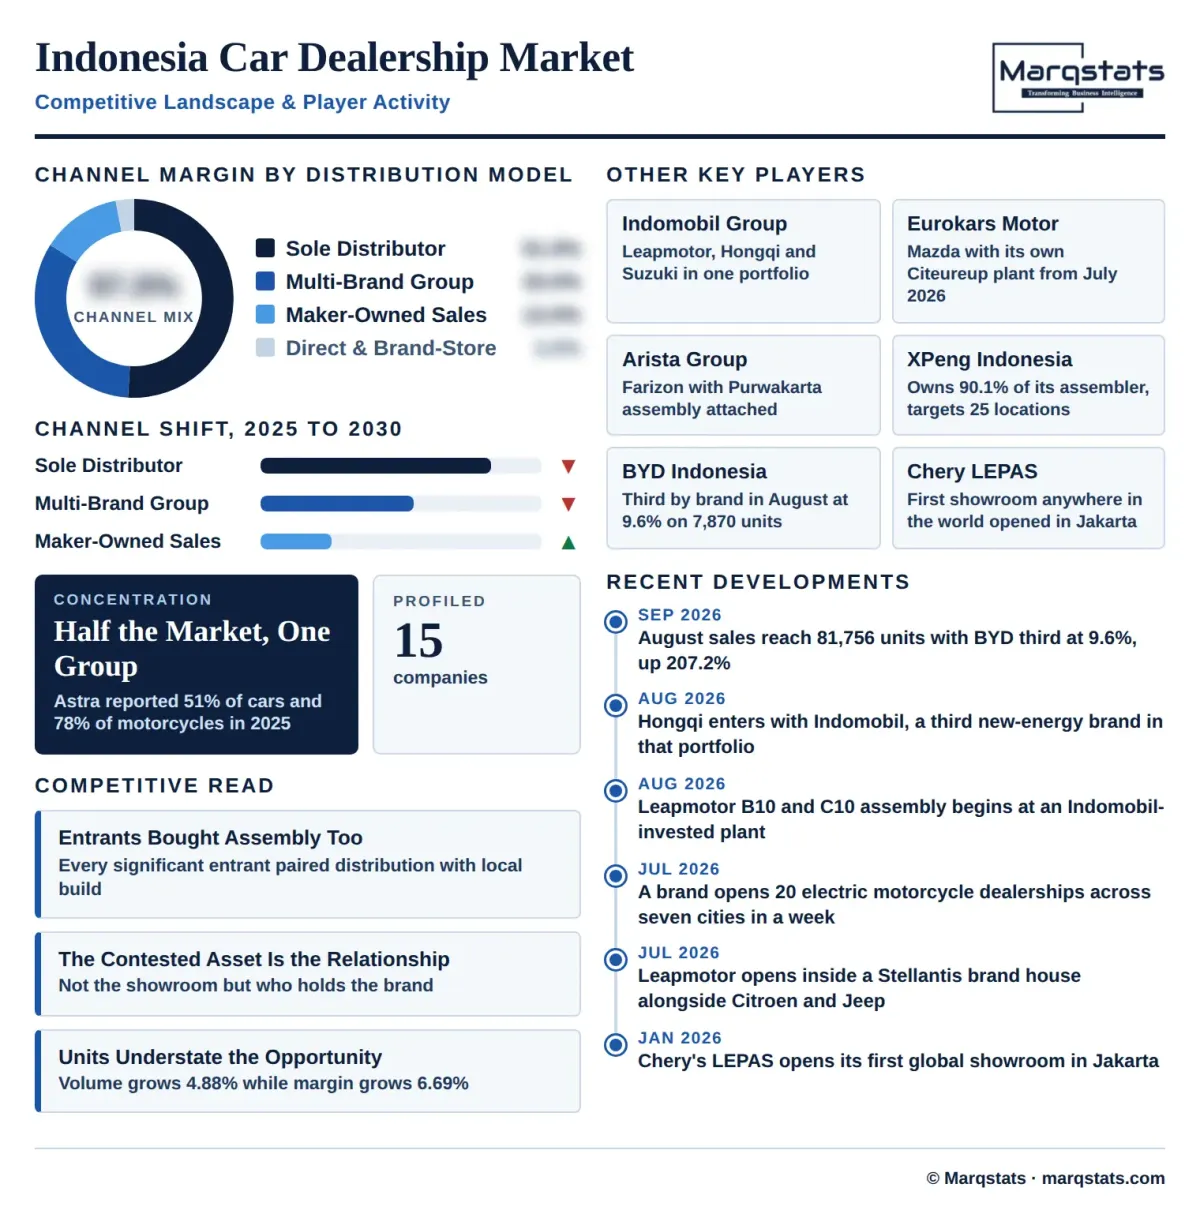
The structure is one dominant group, one challenger platform and a widening field of entrants. PT Astra International reported 51% of the domestic car market in 2025 and 78% of motorcycles through PT Astra Honda Motor, with divisional net profit steady at IDR 11,365 billion through a contracting year. Its brands remain the volume: Daihatsu retailed 84,959 units between January and July 2026, up 9%, with July alone at 12,750 and up 13.6%.
Indomobil Group is the principal multi-brand platform for new entrants and has assembled a portfolio rather than a franchise. It distributes Leapmotor and invested in the Purwakarta plant assembling it, partnered Hongqi in August 2026 to add the E-HS9 as a third new-energy brand, and manufactures and sells Suzuki, which sold more than 64,000 units in 2025 with 88% produced locally and 60% of its passenger buyers choosing hybrids.
Below them the entrants are choosing different routes to the same customer. Eurokars holds Mazda with its own Citeureup plant and prices from IDR 499 million for the CX-30 through IDR 599 million for the CX-5 to IDR 850 million for the Mazda6e, sitting alongside premium electric entries such as the Suzuki e VITARA at IDR 755 million to 758 million; Arista Group holds Farizon with Purwakarta assembly; XPeng owns 90.1% of its assembler while its former parent keeps distribution and targets 25 locations; and Chery's LEPAS opened its first global showroom in Jakarta. Every one of them arrived with an assembly plan attached, which is what separates this entry wave from every previous one.
Companies Covered
The report profiles 15+ companies with full strategy and financials analysis, including:
Recent Market Activity
Table of Contents
Coverage & Segmentation
The analysis measures the gross margin captured between the factory gate and the retail customer on new vehicle distribution in Indonesia from 2021 to 2030, with 2025 as the base year and 2026 to 2030 as the forecast period, covering brand tier, distribution model, revenue stream, outlet format and customer type, with five regional clusters. Vehicle retail value is excluded and sized separately at USD 10.33 billion for passenger cars alone, as is assembly value added at USD 1,947.00 million, because channel margin sits inside the vehicle price rather than alongside it. Used vehicle retail, standalone aftermarket, and vehicle financing balance sheet income are excluded, with only the commission earned at point of sale counted. Values are expressed in USD at a disclosed constant IDR 16,800 per USD.
Coverage spans four brand tiers, four distribution models, three revenue streams, three outlet formats and three customer types. Distribution volume is carried as the unit series at 803,687 vehicles in 2025 on the association headline basis, which deliberately includes commercial vehicles because the same dealer groups retail both and published group shares are measured on that combined base. Blended margin per vehicle is carried as a derived series at IDR 19.32 million. Fifteen entities are profiled across distribution groups, manufacturer sales subsidiaries and entrant brands.