Market Snapshot
Key Takeaways
Market Overview & Analysis
Report Summary
The EV insurance market comprises motor insurance premiums written worldwide on battery-electric and plug-in hybrid passenger cars and light commercial vehicles, spanning third-party liability, own-damage, comprehensive and battery-specific cover. This study segments the market by coverage type, vehicle type, distribution channel, policyholder type, pricing model and region, with a 2025 base year, historical coverage from 2021 to 2025, and forecasts to 2030. Market size is stated as gross written premium.
Scope excludes electric two-wheelers and three-wheelers, which matters for comparison against Asian market studies. Those categories number in the tens of millions across India and Southeast Asia and carry regulated tariffs measured in hundreds of rupees, so including them would raise unit counts substantially while adding little premium. Readers comparing against studies with wider vehicle scope should expect materially higher parc figures and broadly similar premium totals.
The estimate divergence in this market is the widest Marqstats has documented, and it is not analytical disagreement. Published base-year figures range from roughly USD 75 billion to USD 177 billion, with growth rates from 15% to above 40%. The spread follows from three undisclosed choices: whether the figure covers premium written on electric vehicles specifically or the motor portfolios of insurers active in electric vehicles; whether two-wheelers are included; and whether the base year is 2024 or 2025 during a period when the parc grew about 38%.
This report therefore derives rather than estimates. Gross written premium is computed as insured parc multiplied by average annual premium per vehicle within each region, both stated explicitly, so a reader who disagrees with either input can substitute and recompute. On that basis a figure near USD 177 billion for 2025 would require average global premium above USD 2,200 per electric vehicle, which is above the United States average and roughly five times the Chinese level, and no regional evidence supports it.
Market Dynamics
Key Drivers
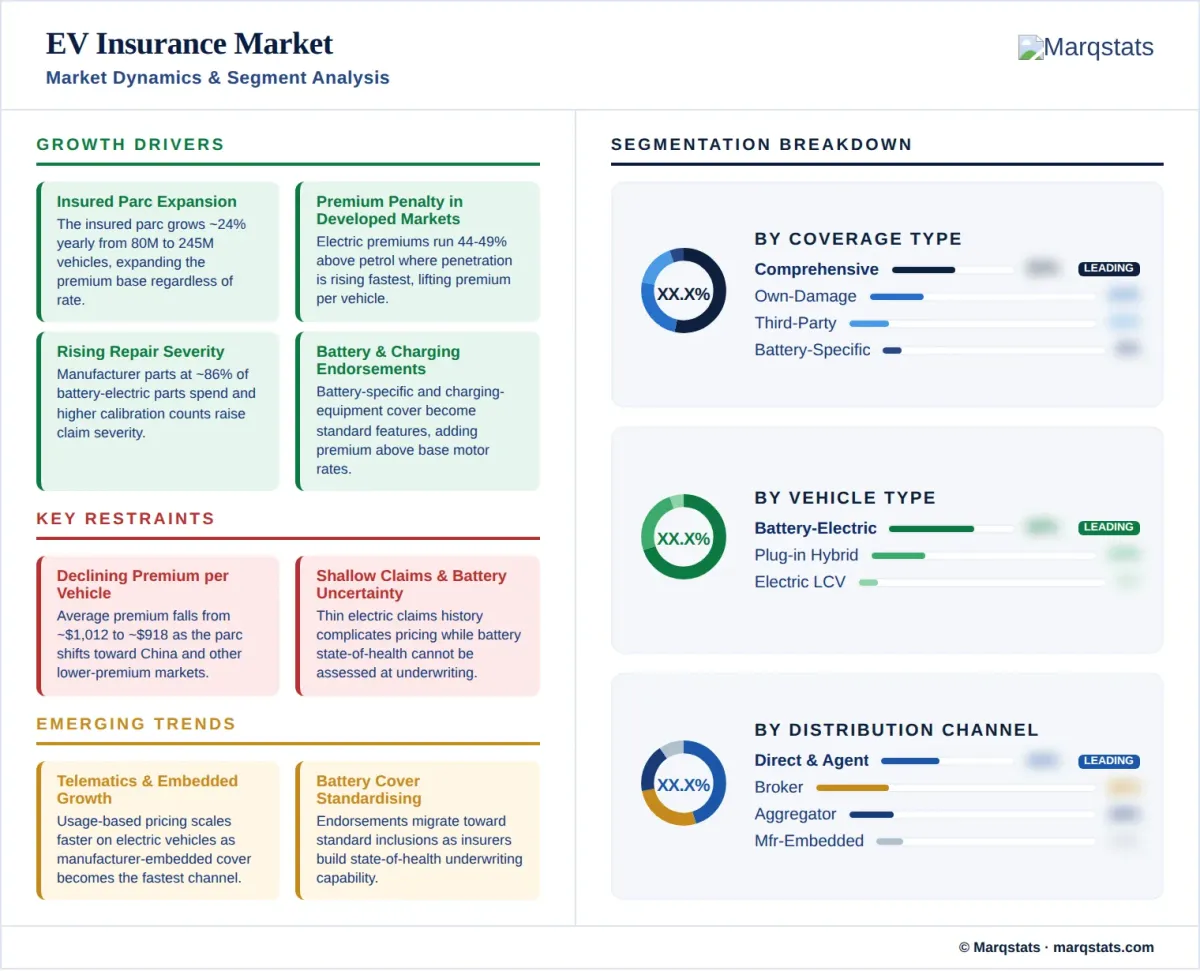
- The insured electric parc grows at a 23.59% CAGR from 80.0 million to 245.0 million vehicles, expanding the premium base regardless of rate movement.
- Electric vehicle premiums run roughly 44% to 49% above petrol equivalents in developed markets, lifting premium per vehicle where electric penetration is rising fastest.
- Repair severity is climbing, with manufacturer parts at about 86% of battery-electric parts spend and higher calibration counts per repairable estimate.
- Battery-specific cover and charging equipment endorsements are becoming standard product features, adding premium above base motor rates.
- Connected vehicle data is standard rather than optional on electric vehicles, enabling usage-based pricing at scale without aftermarket hardware.
Key Restraints
- Average premium per vehicle declines from about USD 1,012 to about USD 918 as the parc shifts toward China and other lower-premium markets.
- Claims experience on electric vehicles remains shallow relative to combustion, complicating reserving and pricing for insurers with limited electric exposure.
- Battery state-of-health cannot be assessed reliably at underwriting in most markets, leaving residual value and total loss thresholds uncertain.
- Repair network capacity for high-voltage systems constrains claim cycle times, raising loss adjustment expense and courtesy vehicle costs.
Key Trends
- Usage-based and telematics pricing is scaling faster on electric vehicles than combustion, because connectivity requires no aftermarket installation.
- Manufacturer-embedded insurance is growing, with vehicle makers offering captive or partnered cover at point of sale using their own telematics data.
- Battery-specific endorsements are migrating from optional add-ons toward standard policy inclusions as regulators formalise electric vehicle products.
- Insurers are building battery state-of-health assessment capability to price own-damage risk and to contest inflated pack replacement claims.
Market Segmentation
Third-party liability is compulsory across effectively all markets and covers the entire insured parc, though it represents a minority of premium in developed markets where comprehensive uptake is high. Several jurisdictions apply reduced third-party rates to electric vehicles as an adoption incentive, with one major Asian regulator mandating a 15% discount. Comprehensive cover dominates premium in North America and Western Europe, where financed and leased vehicles require it contractually.
Own-damage is where the electric premium penalty is concentrated, reflecting battery value, elevated repair severity and limited claims history. Battery-specific cover has emerged as a distinct product addressing depreciation treatment, thermal event exclusions and charging-related damage, and it is migrating from optional endorsement toward standard inclusion as regulators formalise electric vehicle products. Charging equipment cover protects home installations that fall outside conventional motor policies.
Battery-electric vehicles account for the majority of the insured parc and a growing share of premium, and they carry the highest own-damage loading of any category because the battery represents the largest single concentration of value in the vehicle. Replacement costs of USD 9,000 to USD 21,000 frequently exceed the total loss threshold on older vehicles, which is why insurers write off electric vehicles at lower damage levels than comparable combustion models.
Plug-in hybrids carry both a combustion powertrain and a high-voltage system, so they present the risk characteristics of both and command premiums above conventional hybrids while below battery-electric equivalents on battery exposure. Electric light commercial vehicles are a small share of the parc with materially higher premium per unit, reflecting commercial liability limits, higher utilisation and greater annual mileage, and they are typically written on fleet rather than personal lines terms.
Direct insurer distribution and traditional agent and broker channels together account for the majority of global electric vehicle premium, with the balance varying sharply by market. Broker distribution dominates commercial and fleet electric vehicle cover everywhere. Personal lines distribution has shifted toward direct and digital channels faster for electric vehicles than for combustion, because electric vehicle buyers skew younger, higher-income and more digitally engaged than the motor insurance average.
Digital aggregators have captured a growing share of personal lines electric vehicle premium, particularly in markets where price comparison is culturally established. Manufacturer-embedded insurance is the faster-growing channel, with vehicle makers offering captive or partnered cover at point of sale using proprietary telematics data unavailable to conventional insurers. That data advantage allows tighter risk selection and is the principal reason embedded distribution is expanding faster in electric vehicles than in combustion.
Personal lines account for the substantial majority of global electric vehicle premium, reflecting the passenger car composition of the parc. The segment carries the sharpest premium penalty relative to combustion, since private buyers compare directly against the petrol equivalent they would otherwise have purchased, and premium differentials of 44% to 49% in the United States have become a recognised barrier to adoption independent of vehicle price.
Commercial and fleet policies account for a smaller share of premium and a growing one, driven by corporate fleet electrification and by ride-hailing and delivery operators converting to electric. Fleet buyers price total cost of ownership rather than premium in isolation, so higher insurance cost is weighed against lower fuel and maintenance expenditure, and the net calculation frequently favours electric even where premium alone does not.
Conventionally rated policies priced on vehicle, driver and territory characteristics account for the majority of electric vehicle premium and will continue to do so across the forecast. Rating for electric vehicles remains constrained by shallow claims history relative to combustion, which leads several insurers to load conservatively rather than price precisely, and that conservatism is itself a component of the observed premium penalty.
Usage-based pricing grows faster than conventional rating and does so more readily on electric vehicles than combustion, because connectivity is factory-standard and requires no aftermarket device. Pilots in several markets indicate discounts of 12% to 18% for low-mileage drivers, and electric vehicles are disproportionately second household vehicles used for short urban journeys, which makes them structurally favourable candidates. Manufacturer-embedded programmes have the strongest data position.
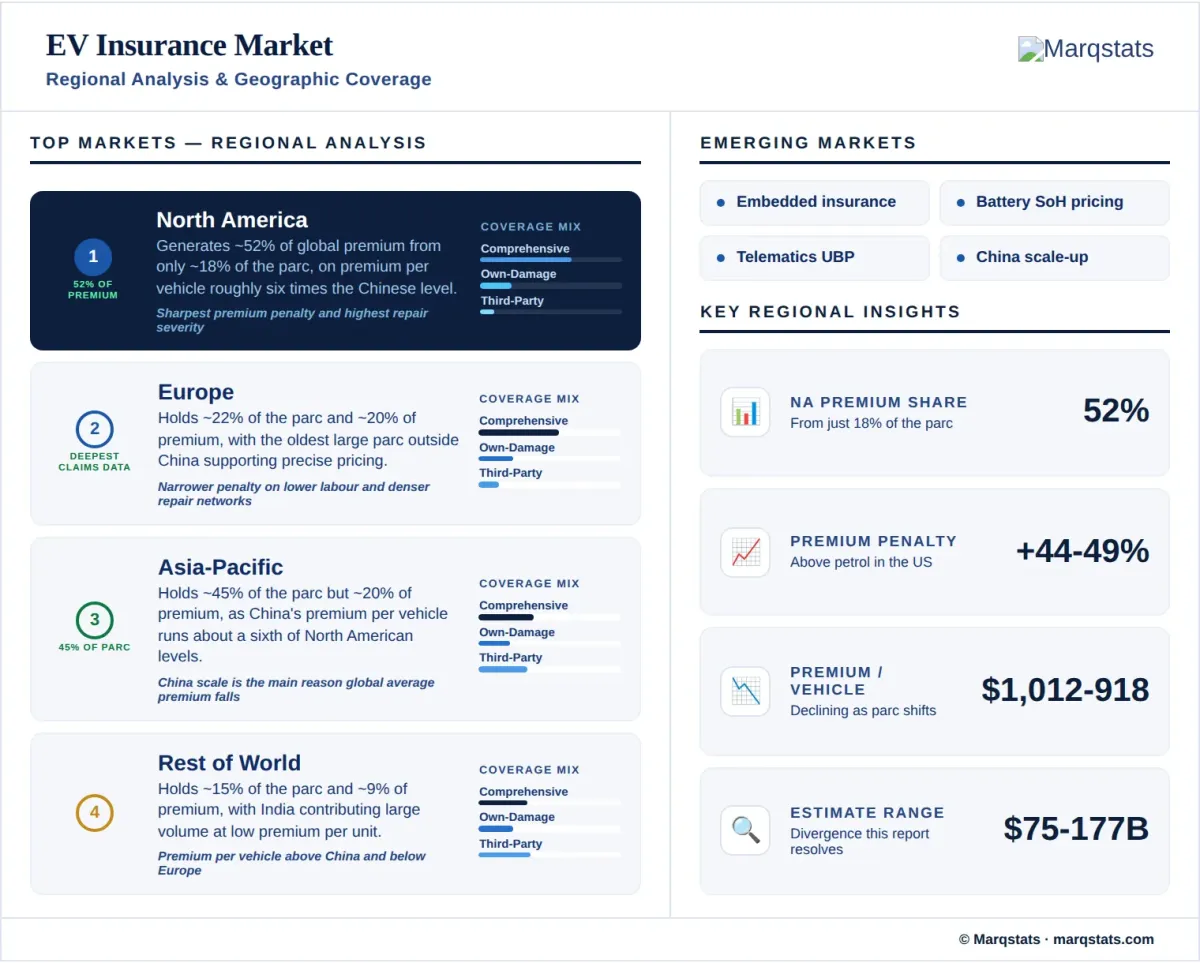
North America generates about 52% of global electric vehicle premium from only about 18% of the insured parc, because average premium per vehicle is roughly six times the Chinese level. The region also records the sharpest premium penalty and the highest repair severity, with battery-electric collision claims rising about 14% in the United States and about 24% in Canada. Europe holds about 22% of the parc and about 20% of premium, with a mature electric parc and comparatively moderate premium levels.
Asia-Pacific holds about 45% of the insured parc and about 20% of premium, a divergence explained entirely by premium per vehicle averaging roughly a sixth of North American levels. China dominates regional volume, and its scale is the principal reason global average premium per vehicle declines across the forecast. Rest of World markets account for about 15% of the parc and about 9% of premium, with India generating substantial vehicle volume at low premium per unit.
By Geography
North America
North America is the largest premium pool by a wide margin, generating about 52% of global electric vehicle premium from about 18% of the parc. Average annual premiums near USD 4,058 for electric vehicles against USD 2,732 for petrol represent a gap close to 49%, and electric premiums rose about 16% across the preceding twelve months. Repair severity runs 25% to 30% above combustion, with manufacturer parts at about 86% of battery-electric parts spend, and battery-electric collision claims rose about 14% in the United States.
Europe
Europe holds about 22% of the global insured electric parc and about 20% of premium. The region has the oldest large electric parc outside China, which gives European insurers deeper claims experience than counterparts elsewhere and supports more precise rather than conservative pricing. Premium differentials against combustion are narrower than in North America, reflecting lower repair labour rates, denser independent repair networks and greater competition in personal lines motor.
Asia-Pacific
Asia-Pacific holds about 45% of the global insured electric parc and about 20% of premium. China dominates both figures, with premium per vehicle averaging roughly a sixth of North American levels because of lower vehicle values, lower repair labour rates and a domestic parts supply chain that limits manufacturer parts pricing power. Japan, South Korea and Australia carry higher premium per vehicle across far smaller parcs, and regional growth is the principal driver of declining global average premium.
Rest of World
Rest of World markets hold about 15% of the insured parc and about 9% of premium. India contributes the largest vehicle volume, though its electric parc is dominated by two-wheelers and three-wheelers excluded from this study's scope, and its regulator mandates a third-party discount for electric vehicles while own-damage rates run above petrol equivalents. Latin America, the Gulf states and South Africa account for the remainder, with premium per vehicle above Chinese levels and below European.
How Competition Is Evolving
The EV insurance market is contested within motor insurance rather than as a standalone line, and no insurer holds a dominant electric-specific global position. The largest multinational composite insurers and national personal lines specialists write the majority of premium through existing motor books, and electric vehicle exposure is generally a portfolio characteristic rather than a distinct business unit. Market share therefore tracks motor insurance share more closely than any electric-specific capability.
Data position is the emerging differentiator. Electric vehicles generate connected telemetry as standard, and insurers with access to that data can price mileage, driving behaviour, charging patterns and battery state-of-health with precision unavailable in combustion portfolios. Manufacturer-embedded programmes hold the strongest position because the data originates with them, and several vehicle makers now operate captive or partnered insurance offerings at point of sale.
Battery risk is where underwriting expertise concentrates and where competitive separation is clearest. Insurers able to assess state-of-health at underwriting, to contest inflated pack replacement claims and to route damage toward module-level repair rather than full replacement carry materially better loss ratios than those defaulting to manufacturer replacement quotes. That capability requires diagnostic access and repair network relationships that most insurers are still building.
Regulatory formalisation will reshape competition over the forecast. Several regulators are moving toward dedicated electric vehicle motor products standardising battery and charging equipment cover, which would convert competitively differentiated endorsements into standard features and compress a margin source. Insurers that have invested in battery assessment and repair steering will retain advantage after that transition; those competing on endorsement design alone will not.
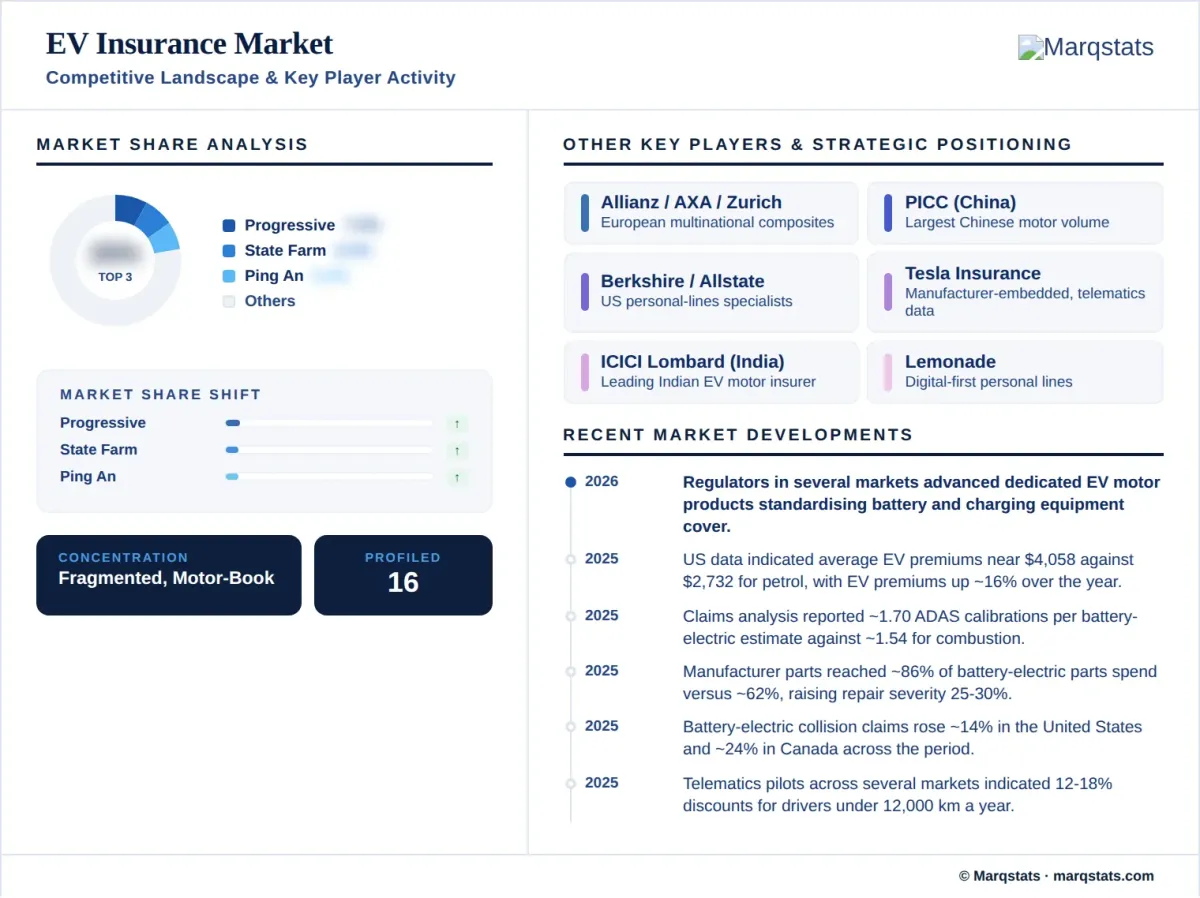
Companies Covered
The report profiles 16+ companies with full strategy and financials analysis, including:
Recent Market Activity
Table of Contents
Coverage & Segmentation
This report provides a comprehensive assessment of the global EV insurance market across a 2025 base year, historical data from 2021 to 2025, and forecasts spanning 2026 to 2030. Market size is stated as gross written premium in United States dollars, alongside the insured electric vehicle parc as the volume metric. Segmentation covers six dimensions. Scope is confined to battery-electric and plug-in hybrid passenger cars and light commercial vehicles; electric two-wheelers and three-wheelers are excluded.
The scope covers demand drivers, restraints and structural trends, with particular focus on resolving the published estimate divergence, the electric premium penalty and its causes, the divergence between parc share and premium share by region, telematics and embedded distribution, and battery risk underwriting. Country-level detail on a market with a wider vehicle scope is available in the India EV Insurance Market report. An extended forecast to 2035 is available under customization, alongside country-level premium analysis on request.