Market Snapshot
Key Takeaways
Market Overview & Analysis
Report Summary
This report sizes the global electric mining equipment market — battery-electric and cable-tethered electric mobile machines supplied to mine sites worldwide, plus trolley-assist systems and the charging and mine electrical infrastructure that serves them. Coverage spans underground loaders, trucks, drills and utility vehicles; surface battery haul trucks; cable-tethered surface excavators, shovels and drills; and trolley conversions. Diesel-electric drivetrains and the legacy grid-powered dragline and rope shovel fleet are excluded.
No public global unit registry exists for electric mining equipment, and that absence governs how this report should be read. Every unit series here is a Marqstats construction built from original equipment manufacturer order-book disclosure, named mine deployments and machine-class populations. A country-level machine count does circulate widely in this sector, but it traces to a single source that cannot be cited in a Marqstats report, so its figures are neither reproduced nor used here — and Marqstats found no independent count that contradicts or replaces it. The supply-side cross-check available is revenue: Epiroc's derived electrification revenue of USD 251 million is about 15% of this model's 2025 total, which with Sandvik at comparable scale puts the two underground leaders near 30% of a market that also contains Caterpillar, Komatsu, Liebherr, XCMG, Normet and MacLean plus infrastructure.
The market's shape changes fundamentally across the forecast. In 2025 it is an underground market: 67% of units are underground machines and surface battery haul trucks are 10% of value. By 2030 surface haul trucks are 49% of value on the strength of a small number of very large orders, and underground falls to 46% of units without falling in absolute terms. Australia rises from 7% of global value to 19% on one customer's order book, which is the single largest concentration risk in this forecast. The largest electric mining fleets in the world today, however, are neither of these: they are Chinese surface coal operations, which most coverage of this sector does not reach.
Market Dynamics
Key Drivers
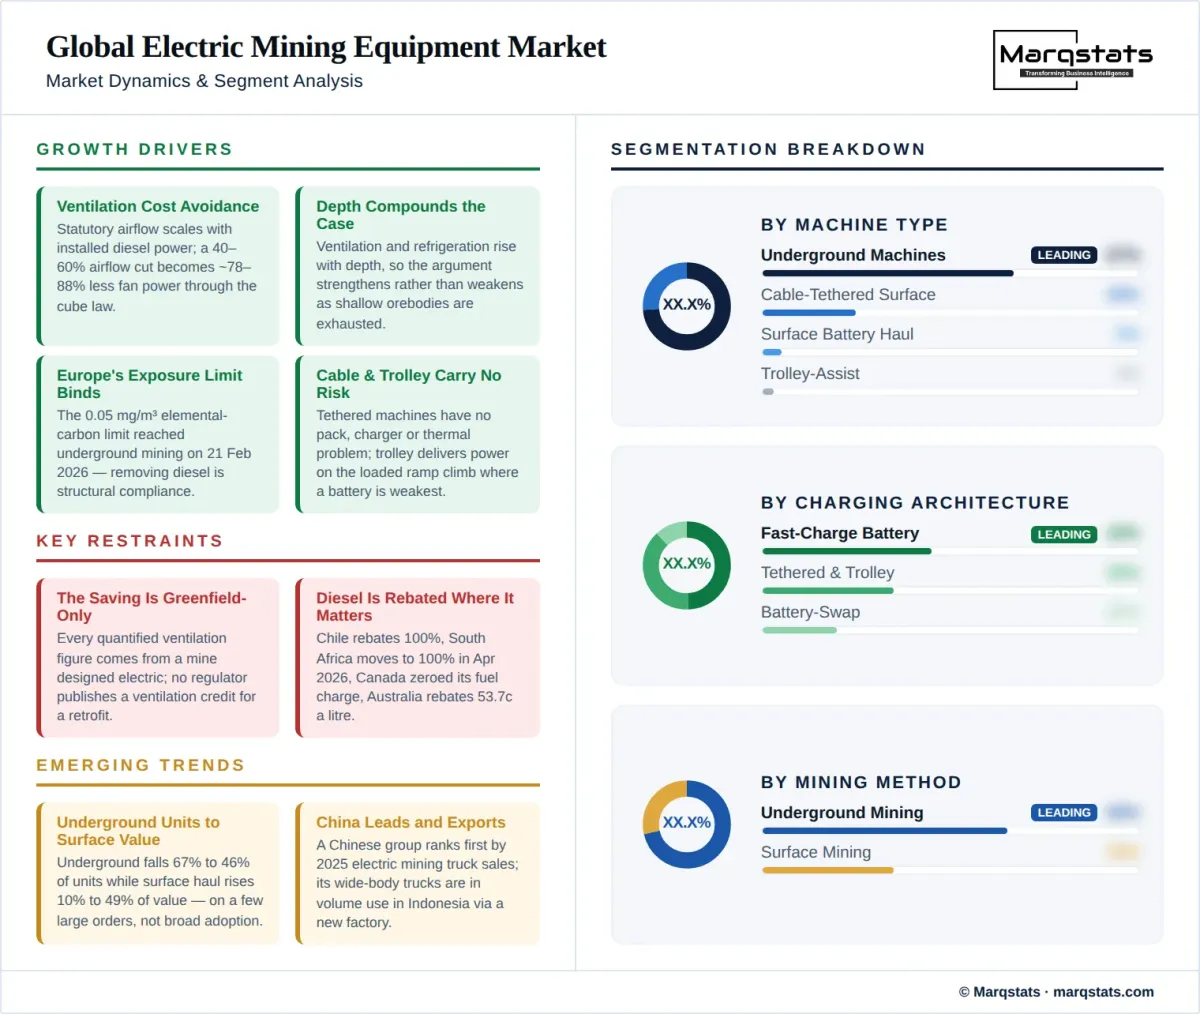
★ Ventilation cost avoidance, quantified. Statutory airflow rules tie required ventilation to installed diesel power; removing diesel removes the requirement. A 40% to 60% airflow reduction yields roughly 78% to 88% less fan power through the cube law, independent academic work computes upwards of 80%, ventilation is 25% to 50% of underground electrical energy, and ventilation plus refrigeration is about 15% of capital cost in deep hot mines. Crucially for a mine planner, this is a capital avoidance rather than an operating saving: a shaft, a raise and a fan installation not built are costs never incurred, and they are incurred at the point in a mine's life when capital is scarcest.
Depth compounds the argument. Ventilation and refrigeration requirements rise with depth as virgin rock temperature climbs, so the deeper the orebody the larger the share of capital and energy that electrification can avoid. That is why the flagship all-electric projects are deep ones, and why the argument strengthens rather than weakens as the world's accessible shallow orebodies are exhausted.
Occupational exposure regulation is already binding in Europe. The 0.05 milligram per cubic metre elemental carbon limit reached underground mining on 21 February 2026, and compliance through ventilation is expensive where compliance through removing diesel machines is structural.
Underground battery machines have a real and growing installed base with evidenced repeat ordering. Epiroc reports about a third of its battery orders coming from existing customers across 40 mine sites, and named all-electric or majority-electric mines now exist in Canada, Finland and Sweden with published machine counts.
Cable-tethered surface machines are the quiet growth segment and carry none of the battery constraints. A tethered excavator or drill has no pack cost, no charging infrastructure requirement and no thermal management problem, and this class is in production at scale while surface battery haulage is not.
Trolley assist is a mature technology with published savings where it is installed. Operators report diesel reductions in the range of 90% on the electrified section, with one Nordic operation citing 830 cubic metres of diesel a year saved on 700 metres of line and 5,500 cubic metres projected across two sites. Trolley also solves the problem battery haulage cannot: it delivers power continuously on the loaded ramp climb, which is where a haul truck consumes most of its energy and where a battery is least able to supply it.
Key Restraints
★ The ventilation saving cannot be banked by an existing mine. Every quantified figure comes from a mine designed electric; no regulator publishes a ventilation credit for battery machines; and the best-instrumented trial on record cut diesel particulate tenfold while reducing no airflow. The driver is capital-side and greenfield, which limits how fast it can convert an installed base.
Mining diesel is rebated or untaxed across most major jurisdictions, so the operating-cost case is weak wherever it matters most. Chile rebates at 100%, South Africa moves to 100% in April 2026, Canada zeroed its federal fuel charge in 2025 and Australia rebates 53.7 cents a litre. The most electrified jurisdiction on earth is the one that abolished its concession.
The supply side is not compounding. The leading underground manufacturer added one net mine site in nine months and its electrification revenue fell year on year in both share and absolute terms. Published unit claims are not battery-only and cannot be aggregated, so the sector's own headline numbers overstate the battery population.
Trolley assist has failed to spread for 59 years and the reason is structural. Roughly 95 trolley-equipped trucks operate worldwide against approximately 28,000 large mine haul trucks — 0.34% of the fleet. The manufacturer sells the truck and the pantograph, but somebody else must build, power and maintain the line, and that split is why installations remain single-site.
Key Trends
The market is shifting from an underground unit market to a surface value market. Underground machines fall from 67% to 46% of units while surface battery haul trucks rise from 10% to 49% of value, entirely on the strength of a small number of very large orders rather than on broad adoption.
Chile's first trolley line went live in July 2025, correcting a widely held assumption that Chile was already a trolley market. Underground trolley is genuinely new: a Nordic operator is running a battery-electric trolley truck system on an 800-metre test track at 13% incline with a 5-kilometre installation planned at 750 metres depth.
Chinese manufacturers lead electric mining truck sales and are exporting the model. One Chinese group ranked first by 2025 electric mining truck sales, and Chinese electric wide-body trucks are already in volume use in Indonesian operations, with a new overseas factory opened to serve them. Any addressable-market estimate built only from the Western majors will be wrong.
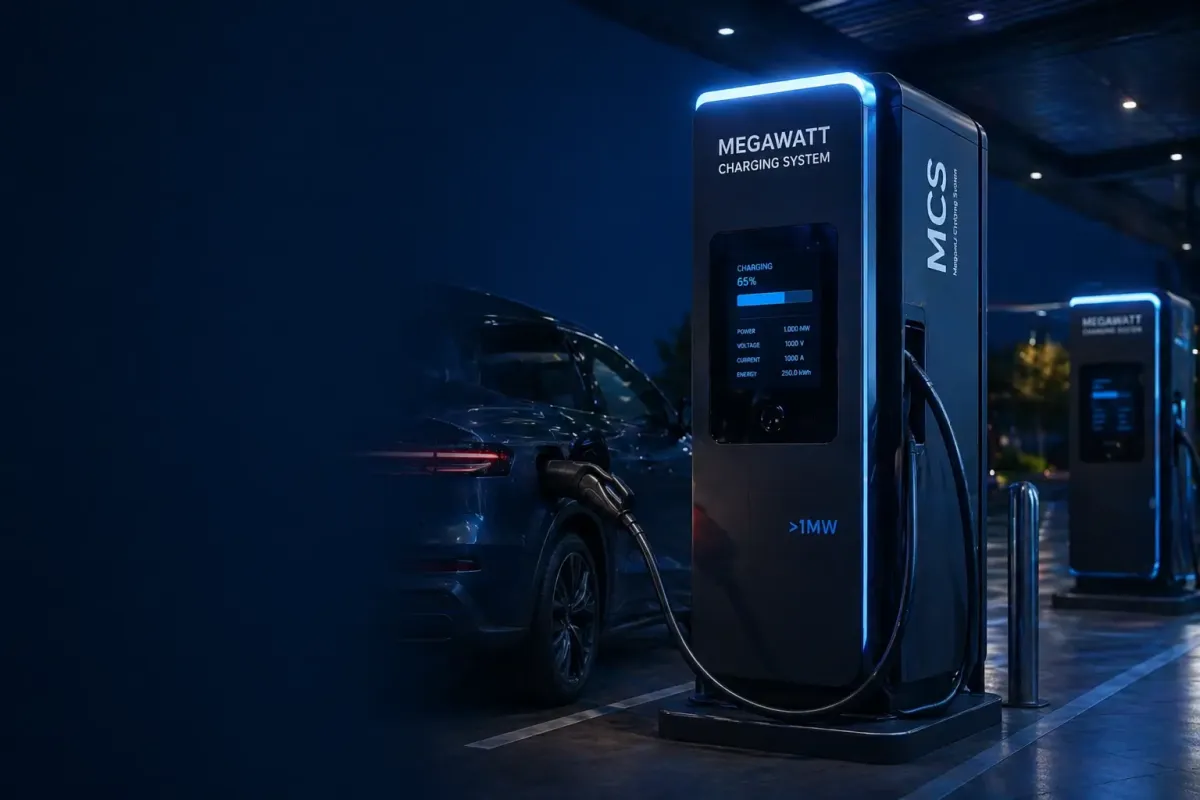
Charging and mine electrical infrastructure is the fastest-growing line in the market at 53.91%, rising from 6.5% of value in 2025 to 10.6% by 2030. Underground charging bays and reticulation, surface megawatt chargers and trolley line are being specified as part of the mine rather than as an accessory to the machine.
Market Segmentation
The volume market and the segment with genuine operating history. Marqstats models deliveries rising from 380 units in 2025 to 1,070 in 2030, a 23.00% CAGR. This is where the ventilation argument applies, where repeat ordering is evidenced, and where the all-electric mine case studies come from. It is also the segment where the two competing charging philosophies matter most: a mine that builds high-power reticulation to the working level for fast charging cannot cheaply switch to pack swap, and the reverse is equally true, so the architecture choice is effectively irreversible at mine-design stage.
The value step-change and the concentration risk. Deliveries rise from 26 units in 2025 to 760 by 2030, a 96.41% CAGR that takes the segment from 10% of market value to 49%. That growth rests on a small number of very large order books rather than on broad adoption, and the report treats it as schedule-dependent.
Excavators, shovels and drills on trailing cable, growing from 145 units to 395 at 22.19%. This class has no pack cost, no charger requirement and no thermal management problem, and it is in production at scale today while surface battery haulage is not.
The smallest and oldest segment, at 18 sets in 2025 rising to 88 by 2030. Published diesel savings on the electrified section reach 90%, but installed base remains 0.34% of the global haul truck fleet after 59 years because the line, not the truck, is the barrier. The economics are also route-specific in a way machine purchases are not: a trolley line pays back only against a fixed, heavily trafficked ramp, so it suits long-life operations with stable haul profiles and suits nothing else.
Where the driver is structural. Statutory ventilation rules tied to diesel power, an already-binding European exposure limit, and confined-space heat and air quality all favour electrification independently of energy prices. It carries the majority of units throughout the forecast and all of the evidenced repeat ordering.
Where the capital is, and where adoption is order-book-driven rather than fleet-driven. Surface takes the majority of market value from 2029 through haul truck deliveries, with cable-tethered machines and trolley providing the only segments with meaningful current production.
By Geography
Canada
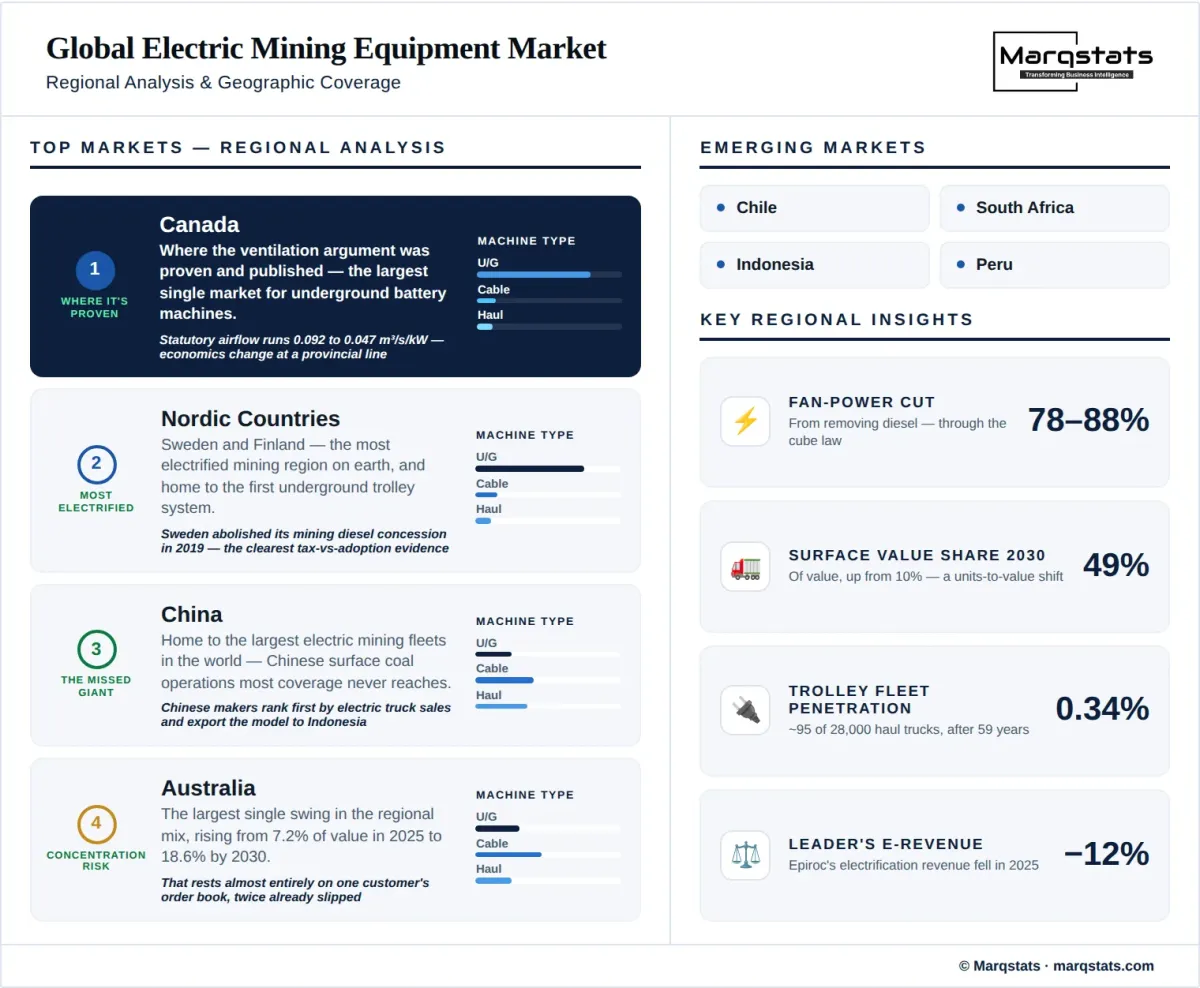
The jurisdiction where the ventilation argument was proven and published, and the largest single market for underground battery machines. Its statutory airflow rates range from 0.092 cubic metres per second per kilowatt in Quebec and Manitoba to 0.047 in Newfoundland, a spread wide enough that the same machine changes the economics of a project depending which side of a provincial boundary it sits on. The flagship all-electric mines with published energy and ventilation figures are here, and they are the evidence base the rest of the world cites. Canada takes 23.5% of 2025 market value falling to 16.7% by 2030 as surface haulage grows elsewhere.
Nordic Countries
Sweden and Finland, at 21.0% of 2025 value. Sweden abolished its mining diesel concession in 2019 and is the most electrified mining jurisdiction on earth, which is the strongest available evidence that fuel taxation shapes adoption. The region also hosts the first underground battery-electric trolley system and the best-instrumented underground battery trial on record.
Latin America
Chile dominates, at 17.0% of 2025 value rising to 17.5%. Mining diesel is rebated at 100%, which weakens the operating-cost case, but Chile's first trolley line went live in July 2025 and the country's large copper operations are the natural home for surface electrification at scale.
Australia
Computed from the Marqstats Australia Electric Mining Equipment report rather than estimated independently, so parent and child cannot disagree. Australia is 7.2% of global value in 2025 rising to 18.6% by 2030 — the largest single swing in the regional mix, resting almost entirely on one customer's order book and on a delivery schedule that has already slipped twice.
China, Africa and Rest of World
The largest electric mining fleets in the world are Chinese surface coal operations, and Chinese manufacturers rank first by electric mining truck sales while exporting the model to Indonesia through a new overseas factory. China takes 20.5% of 2025 value; Africa and the remaining markets take 18.0%, falling to 13.0% as their surface haulage lags.
How Competition Is Evolving
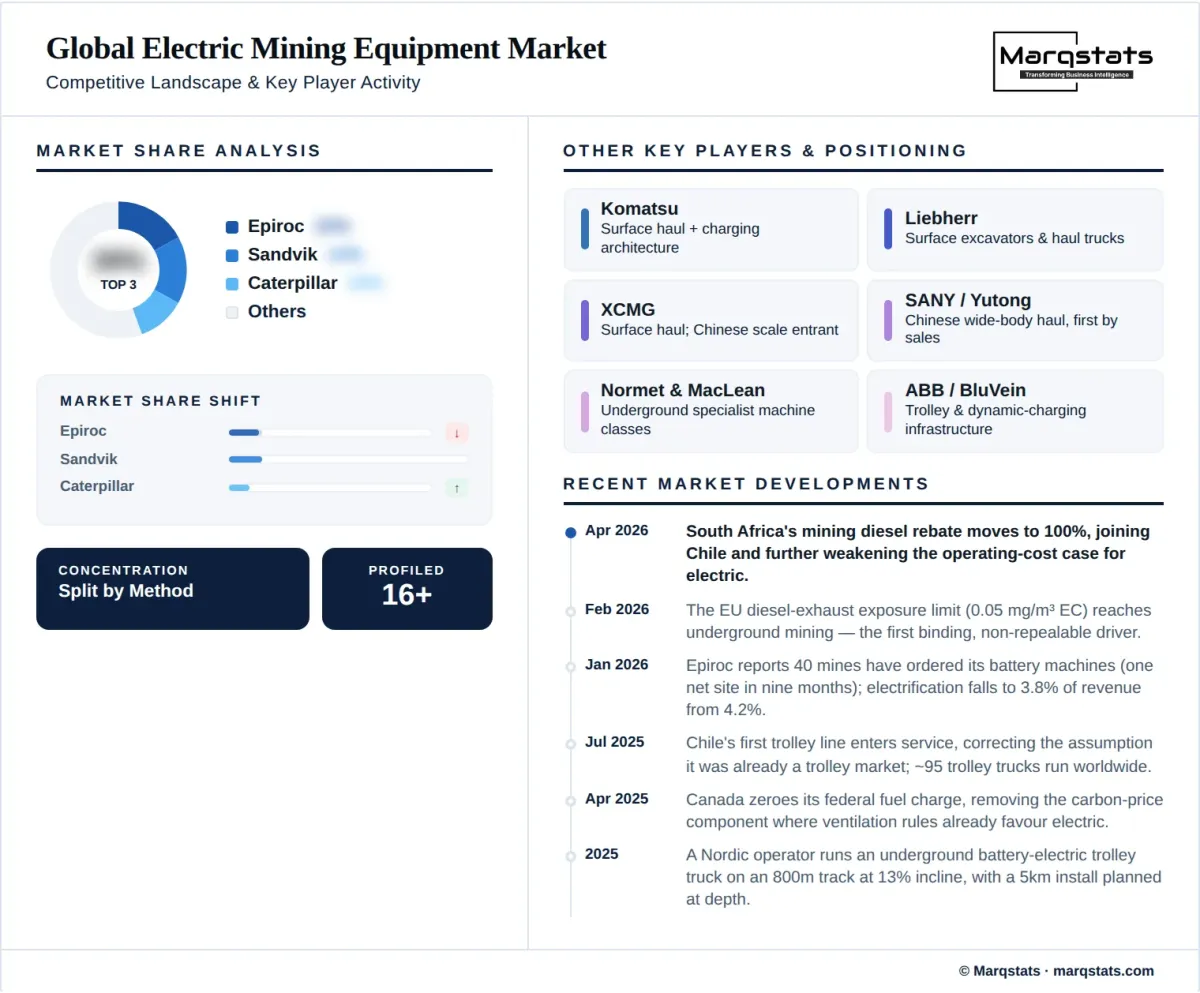
The competitive structure differs sharply by mining method. Underground is led by Epiroc and Sandvik, both with genuine installed bases and published order books, joined by Normet, MacLean and Miller Technology in specialist classes. Surface is Caterpillar, Komatsu, Liebherr and increasingly XCMG, competing on machine and on charging architecture. The infrastructure layer — ABB in trolley and underground converter systems, BluVein in dynamic charging, Fortescue Zero in battery systems — is a separate competitive field whose members rarely appear in equipment share tables at all. Chinese manufacturers occupy a third position that Western share tables miss almost entirely: one Chinese group ranked first by 2025 electric mining truck sales, and Chinese electric wide-body trucks are in volume service in Indonesia, served by a purpose-built overseas factory. A competitive assessment drawn only from the Western majors describes perhaps half the machines actually being delivered.
The sector's own published unit figures cannot be used as they stand. Epiroc and Sandvik each claim over 600 electric units worldwide and Sandvik additionally claims to be the largest supplier, but neither figure is battery-only: both include cable-electric and electric-tramming machines, which have existed in mining since the 1970s. The two claims are neither additive nor comparable, and a reader who sums them produces a battery population roughly double the real one. Marqstats reports them as what they are and builds its own series from order-book disclosure and named deployments instead.
The most consequential competitive fact in this market is one that runs against the narrative. Epiroc's electrification revenue fell in 2025, from 4.2% of group revenue to 3.8%, or roughly USD 285 million to USD 251 million, and its battery order-book site count moved from 39 to 40 across nine months. That is the clearest single datapoint the sector publishes about its own trajectory, it comes from the segment leader's annual reporting, and it points the wrong way. Against it sits the genuinely encouraging figure from the same disclosure: about a third of those orders are repeat orders from existing customers, which is the strongest available evidence that the machines work.
Companies Covered
The report profiles 16+ companies with full strategy and financials analysis, including:
Recent Market Activity
Table of Contents
Coverage & Segmentation
This study covers battery-electric and cable-tethered electric mobile mining machines supplied worldwide across 2021 to 2030, underground and surface, together with trolley-assist systems and the dedicated charging and mine electrical infrastructure serving them. Diesel-electric drivetrains are excluded because they consume diesel, and the legacy grid-powered dragline and rope shovel fleet is excluded as a mature installed base with no meaningful new supply. Generation and transmission are excluded from market value and treated as context. Two boundaries are stated explicitly: the overlap with the Marqstats Off-Highway Electric Vehicle report, which names mining vehicles among its segments; and the relationship to the Marqstats Australia Electric Mining Equipment report, which is this report's child.
Market value is measured at machine and installation supply price in United States dollars. The base year is 2025, the historical period 2021 to 2025 and the forecast period 2026 to 2030. Readers should treat the global totals as constructed rather than measured: no public global unit registry exists for electric mining equipment, and the one widely circulated country count is not citable and is not used here. The forecast is also concentrated — Australia rises from 7.2% to 18.6% of global value on a single order book whose delivery schedule has already slipped twice, and a further slip would remove a material share of the global growth.