Market Snapshot
Key Takeaways
Market Overview & Analysis
Report Summary
This report sizes the Canada electric mining equipment market — battery-electric and cable-tethered electric mobile machines, trolley-assist systems and dedicated charging and mine electrical infrastructure delivered to Canadian mines. Canada is the parent report's largest region and its intellectual origin: the statutory ventilation arithmetic, the all-electric greenfield evidence and the published energy-saving data that justify electric mining everywhere were largely generated in Ontario and Quebec hard-rock mines.
The mechanism is regulation that no operator can negotiate away. Canadian mining law prescribes minimum ventilation airflow per kilowatt of installed diesel engine power, cumulatively per air course — 0.092 cubic metres per second per kilowatt in Quebec and Manitoba, 0.060 across Ontario, British Columbia, Saskatchewan and the territories, 0.047 in Newfoundland. Fan power varies with the cube of airflow, so the 40% to 60% airflow reduction available from removing diesel becomes roughly 78% to 88% less fan power, against ventilation running 25% to 50% of an underground mine's electrical energy. In Canada's climate the same airflow must also be heated for much of the year, which adds a fuel bill electrification cuts proportionally — published estimates run to several million Canadian dollars a year per mine.
The market now enters a second phase. The first was underground and evidence-driven: Borden, Onaping Depth, and battery fleets at mines like Lalor. The forecast phase adds surface volume — battery haul trucks rising from 3 Canadian deliveries in 2025 to 95 by 2030 — and shifts value toward British Columbia's open pits while Ontario's underground share eases. Canada's global share falls from 21.8% to 16.7% across the forecast not through weakness but because Australia's single-customer order book and China's manufacturing surge grow from smaller bases faster.
Market Dynamics
Key Drivers
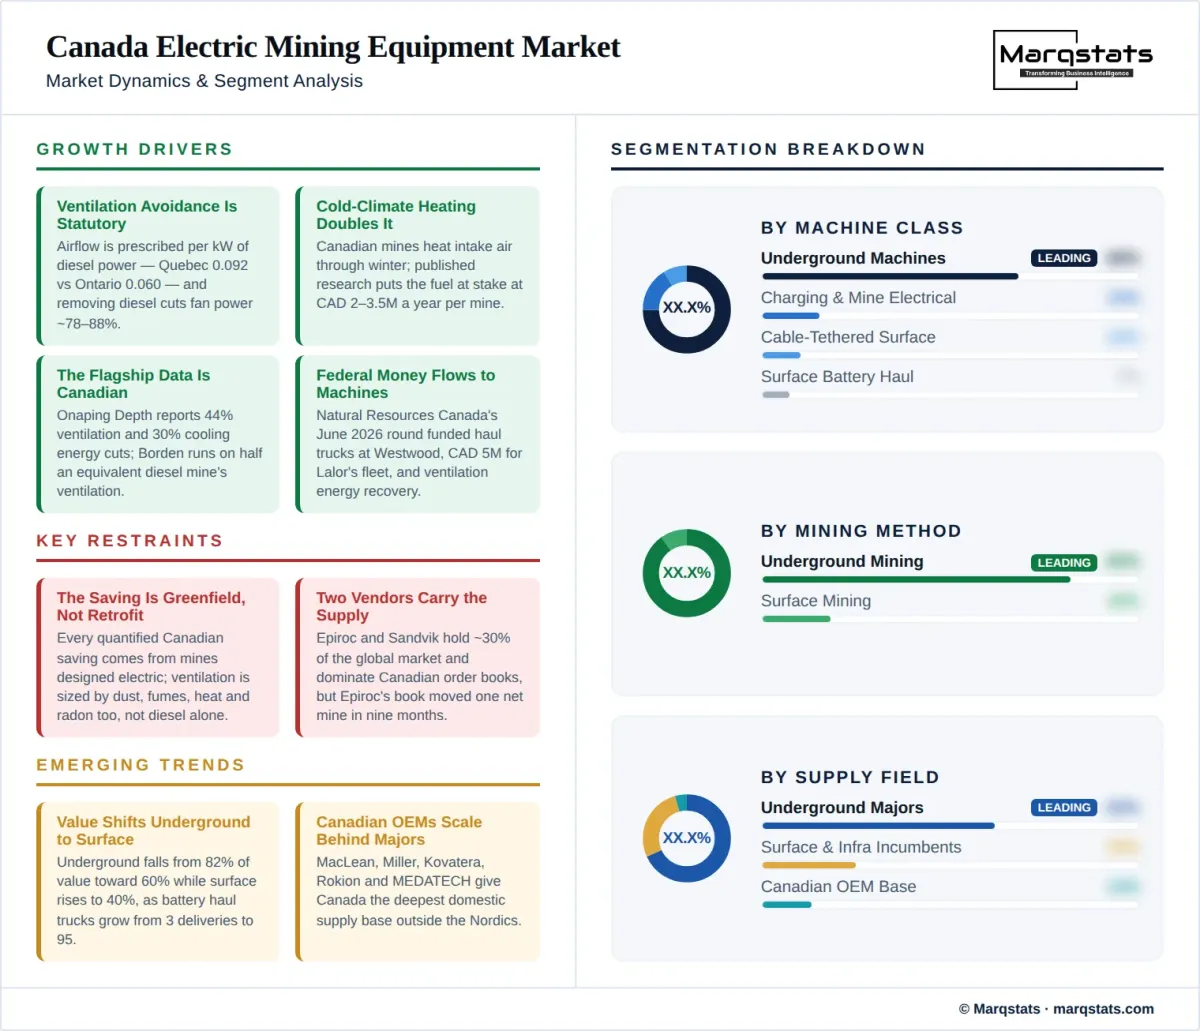
Ventilation cost avoidance is statutory and cannot be legislated away by a budget. Airflow is prescribed per kilowatt of diesel power — 0.092 cubic metres per second per kilowatt in Quebec and Manitoba against 0.060 in Ontario — and removing the diesel removes the requirement, with fan power falling roughly 78% to 88% on the cube law.
Cold-climate heating doubles the prize. Canadian mines must heat intake air through winter, and published Canadian research puts the heating fuel at stake at two to three-and-a-half million Canadian dollars a year per mine — a saving proportional to airflow that only Canadian and Nordic operators capture.
The flagship projects are Canadian and their data is published. Onaping Depth reports 44% ventilation and 30% cooling energy reductions; Borden operates with half the ventilation of an equivalent diesel mine — the two most-cited datapoints in global mine electrification both come from Sudbury-basin and Ontario operations.
Federal money now flows directly to machines. Natural Resources Canada's June 2026 round funded electric haul trucks and charging at IAMGOLD's Westwood, C$5 million for Hudbay's Lalor battery fleet, and ventilation energy recovery elsewhere — grants at the machine line rather than the study line.
Deep new orebodies make diesel progressively unworkable. At Onaping Depth's 2,600 metres, ventilating and cooling a diesel fleet approaches physical and economic limits, and Canada's development pipeline trends deeper — the geology itself is an electrification driver.
Key Restraints
The ventilation saving is a greenfield argument, not a retrofit one. Every quantified Canadian saving comes from mines designed electric; an operating mine cannot bank the prize by swapping machines, because ventilation is sized by dust, blast fumes, heat and radon as well as diesel — and no regulator publishes a ventilation credit.
The fuel carries no carbon price. Canada's federal fuel charge fell to zero on 1 April 2025, leaving industrial carbon pricing on facilities but nothing on the diesel itself, so the operating-cost case rests entirely on ventilation, heating and maintenance rather than on fuel taxation.
The supply side is concentrated in two vendors. Epiroc and Sandvik hold roughly 30% of the global market between them and dominate Canadian underground order books, and Epiroc's global battery order book moved by one net mine site in nine months — Canadian expansion depends on a supply side that is not compounding.
Winter proves batteries as much as it favours them. Cold-weather range, charger reliability at surface installations and battery thermal management in mixed indoor-outdoor duty remain the operational risks Canadian sites report most, and they scale with the surface fleet the forecast depends on.
Key Trends
Value shifts from underground units to surface trucks. Underground machines fall from 82% of Canadian market value toward 60% by 2030 while surface mining rises to 40%, as battery haul trucks grow from 3 deliveries to 95 at the fastest rate in the report.
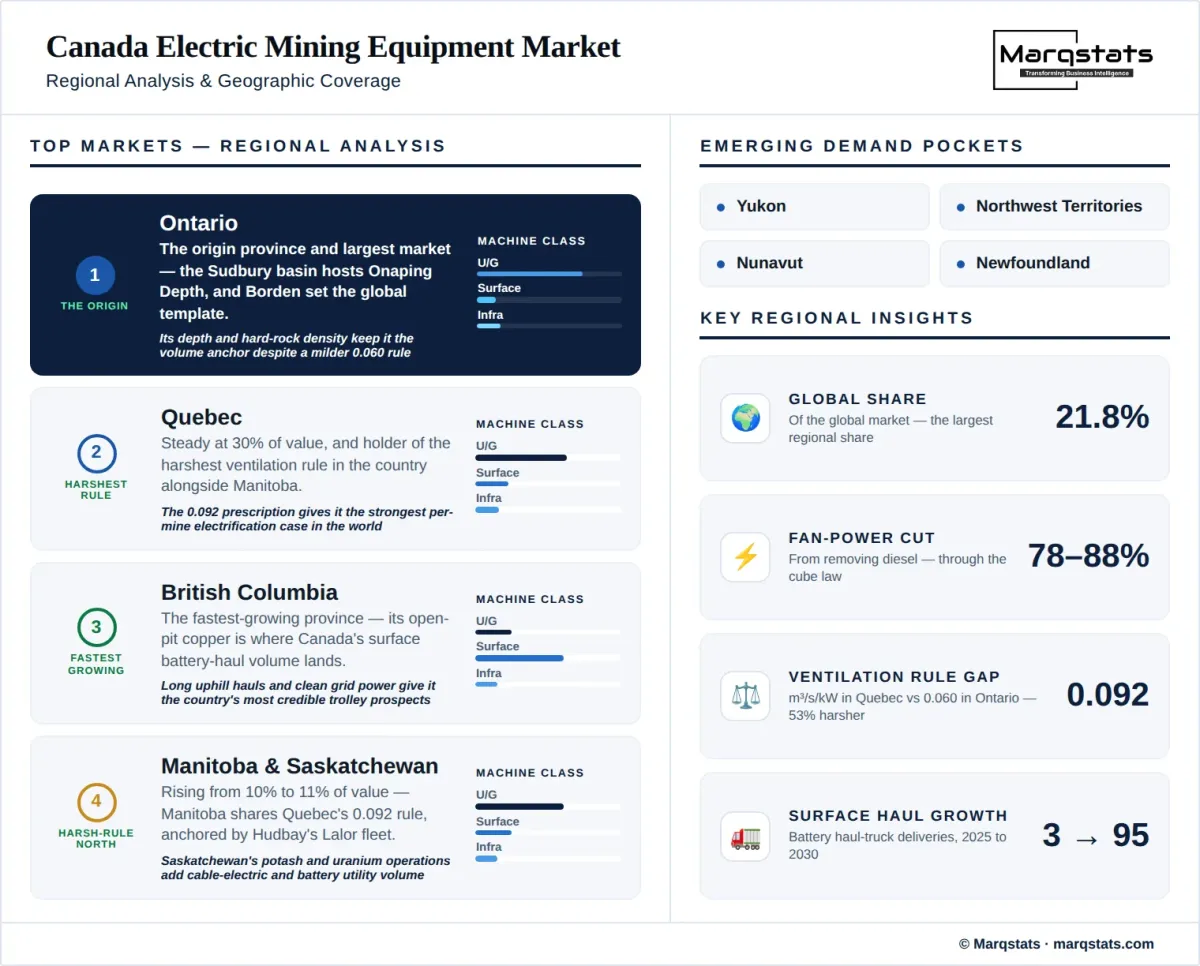
British Columbia is the fastest-growing province at 44.41%, rising from 9% of value to 14% on open-pit battery haul truck and trolley-ready deployments, while Ontario eases from 44% to 38% as its underground pioneer projects mature.
Charging and mine electrical grows faster than the machines it serves, from USD 57.1 million to USD 267.5 million at 36.19%, as each new electric mine now specifies dozens of chargers — Onaping Depth alone plans more than 100.
Canadian original equipment manufacturers are scaling behind the majors. MacLean, Miller Technology, Kovatera, Rokion and MEDATECH give Canada the deepest domestic electric mining supply base outside the Nordics, and MacLean's 2026 driveline partnership signals series production rather than conversions.
Market Segmentation
Loaders, trucks and drills for underground mines are the market's core: 112 of 135 deliveries in 2025, rising to 280 by 2030 at 20.11% while falling from 82% of value toward 60%. Canada's statutory ventilation arithmetic makes this the class where the economics are strongest, and Epiroc and Sandvik fleets at Onaping Depth, Lalor and the Sudbury basin dominate the order book.
The fastest-growing class in the report, from 3 Canadian deliveries in 2025 to 95 by 2030 at 99.58%. The volume arrives late in the forecast as British Columbia and Quebec open pits take trucks now in trial fleets, and the class carries the highest unit value in the market at roughly USD 5.8 million to 6.5 million per truck.
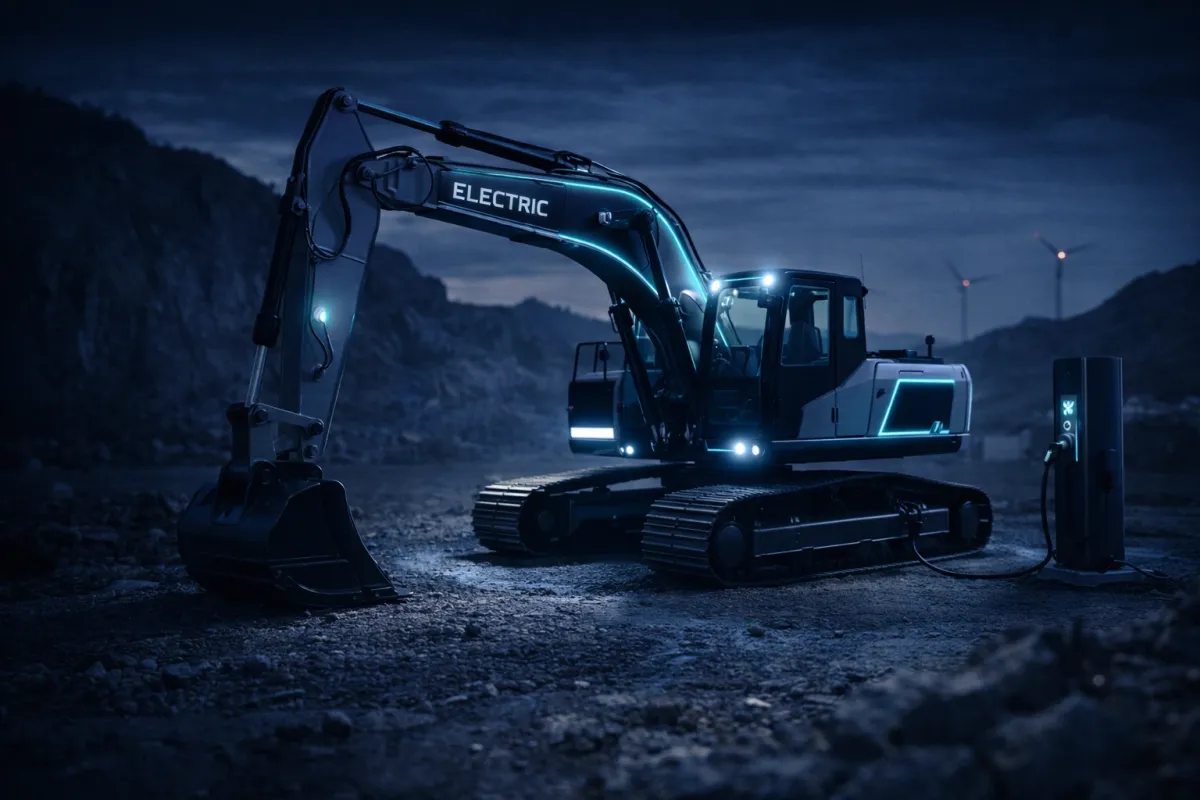
Electric rope shovels' modern successors — cable-electric excavators and loaders — rise from 20 deliveries to 52 at 21.06%. The class is mature technology with a new decarbonisation rationale, and it concentrates in iron ore and oil sands operations where fixed dig faces suit tethered power.
The fastest-growing value line at 36.19%, from USD 57.1 million in 2025 to USD 267.5 million by 2030 — 15% to 18% of market value. Each electric mine now specifies charger fleets at commissioning: Onaping Depth alone plans more than 100 chargers against more than 80 electric vehicles, and federal grants now name chargers alongside machines.
The market's origin and still 82% of 2025 value, easing to 60% by 2030 while growing at 24.19% absolutely. The ventilation and heating arithmetic applies only here, which is why Canada's underground segment leads the world and why the country's evidence base is underground evidence.
From 18% of value to 40% by 2030 at 55.09% — the forecast's swing factor. Battery haul trucks and cable-tethered machines carry the growth, led by British Columbia copper and Quebec iron ore. The segment imports its risk profile: it depends on truck platforms still listed as early-production by their manufacturers.
By Geography
Ontario
The origin province and largest market at 44% of 2025 value, easing to 38% by 2030 at 28.38%. The Sudbury basin hosts Onaping Depth — C$2 billion, 2,600 metres, shaft completed August 2026 — and Borden set the global template. Ontario's 0.060 cubic metres per second per kilowatt ventilation rule is milder than Quebec's, but its depth and density of hard-rock mines keeps it the volume anchor.
Quebec
Steady at 30% of value throughout, growing at 32.20% with the market. Quebec's 0.092 ventilation prescription — the harshest in the country alongside Manitoba's — gives it the strongest per-mine electrification case in the world, and June 2026 federal funding at IAMGOLD's Westwood put electric haul trucks and charging directly into a Quebec gold mine.
Manitoba and Saskatchewan
Rising from 10% of value to 11% at 34.74%. Manitoba shares Quebec's 0.092 rule, and Hudbay's Lalor mine in Snow Lake ordered its Epiroc battery fleet in March 2025 with C$5 million of federal electrification funding following in June 2026. Saskatchewan's potash and uranium operations add cable-electric and battery utility volume.
British Columbia
The fastest-growing province at 44.41%, from 9% of value to 14% by 2030. BC's open-pit copper operations are where Canada's surface battery haul truck volume lands, and the province's mines carry the country's most credible trolley-assist prospects given long uphill hauls and clean grid power.
Rest of Canada
Steady at 7% of value, growing at 32.20% in line with the market. The territories' 0.060 ventilation rule and diesel logistics costs favour electrification at remote sites, but small mine counts and harsh installation conditions keep the segment a follower of the provincial core.
How Competition Is Evolving
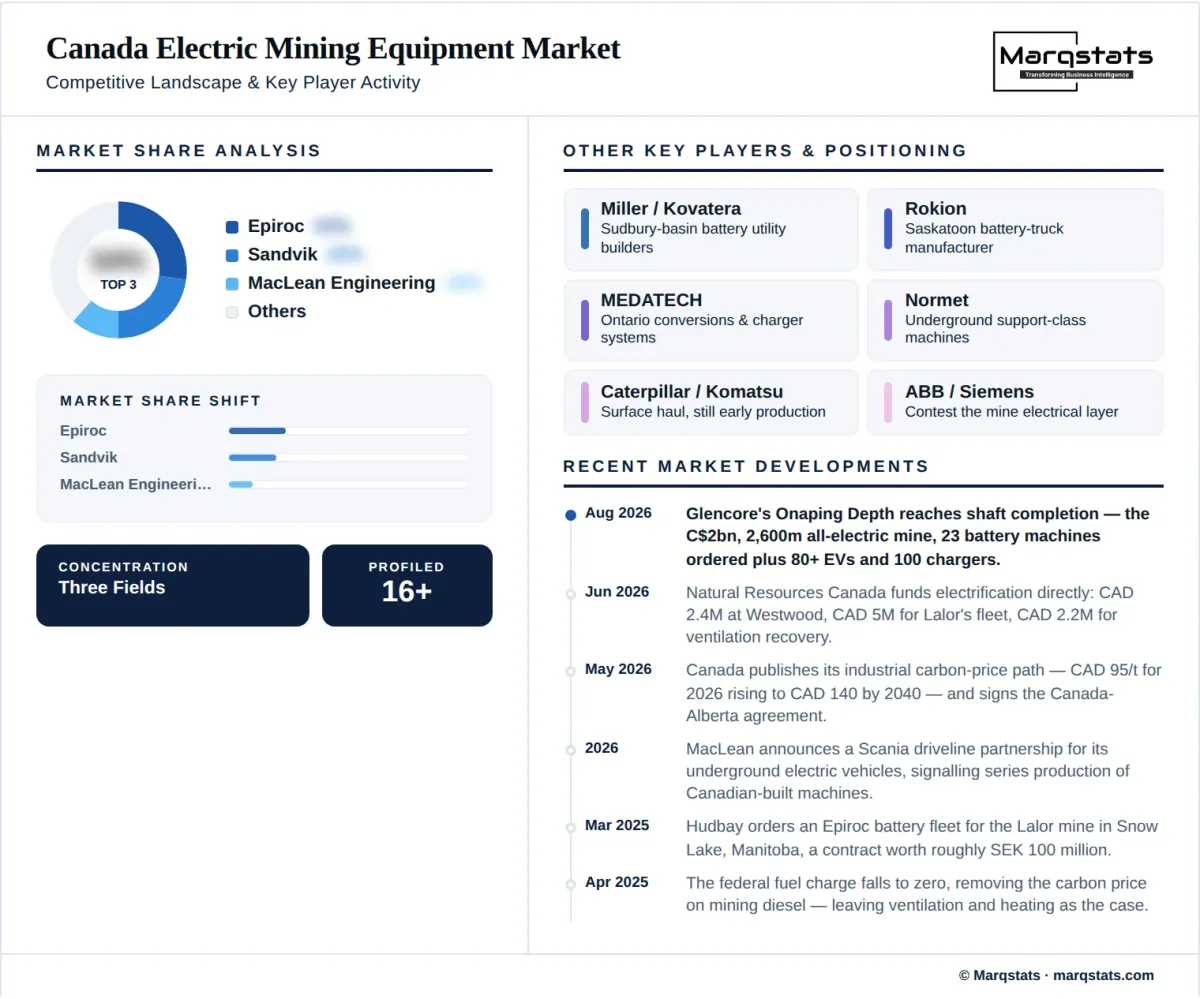
The Canadian market splits into three fields with different structures. Underground machines are a near-duopoly: Epiroc and Sandvik dominate Canadian battery order books as they do globally, holding roughly 30% of the world market between them, with Normet in support classes. The concentration cuts both ways — it industrialised the technology quickly, but Epiroc's global battery order book moved by one net mine site in nine months, and a Canadian expansion built on two Swedish vendors' capacity is a risk this report prices.
The second field is Canadian and underappreciated: a domestic manufacturer base deeper than anywhere outside the Nordics. MacLean Engineering builds battery utility vehicles in Ontario and signed a 2026 driveline partnership pointing at series production; Miller Technology and Kovatera build battery personnel and utility machines in the Sudbury basin; Rokion builds battery trucks in Saskatoon; MEDATECH engineers conversions and chargers in Ontario. These firms own the utility-vehicle layer the majors ignore, and Onaping Depth's order book names them alongside Epiroc.
The third field — surface trucks and infrastructure — is where the incumbents' caution shows. Caterpillar, Komatsu, Liebherr and Hitachi all run battery haul truck programmes still in early production, Toromont channels Caterpillar product into eastern Canada, and ABB and Siemens contest the mine electrical layer. The forecast's surface swing depends on those truck platforms maturing on schedule; their slippage is the single largest downside to the Canadian numbers, exactly as it is to the parent report's.
Companies Covered
The report profiles 16+ companies with full strategy and financials analysis, including:
Recent Market Activity
Table of Contents
Coverage & Segmentation
This study covers battery-electric and cable-tethered electric mobile mining machines, trolley-assist systems and dedicated charging and mine electrical infrastructure delivered in Canada across 2021 to 2030, measured in US dollars. Segmentation runs across four machine classes, two mining methods and five provincial groupings. Diesel-electric drivetrains are excluded, as are legacy grid-powered draglines and rope shovels, fixed plant, and underground rail systems other than battery locomotives counted with utility machines.
The Canadian national line is computed as Canada's regional share of the Marqstats Global Electric Mining Equipment report — 21.8% of parent value in 2025 easing to 16.7% by 2030 — so parent and child cannot disagree, mirroring the method used for the Australian child report. Machine-class unit series within that line are Marqstats estimates built from published order books and named deployments. No public registry of electric mining equipment exists in Canada or anywhere else; a circulating country count placing Canada at roughly one hundred machines traces to a single source that cannot be cited and is not used.
Three caliber warnings travel with this report. First, the Borden saving: the mine's stated physical savings — roughly two million litres of diesel, one million litres of propane and thirty-three thousand megawatt-hours — value at about US$4.4 million at market prices, not the US$9 million in circulation, and dividing US$9 million by the stated electricity saving implies a power price several times any industrial tariff. Second, vendor fleet claims: Epiroc and Sandvik each cite more than six hundred electric units worldwide, but neither figure is battery-only and the two overlap in definition — they are not additive and must never be summed. Third, the circulating country count placing Canada at roughly one hundred machines traces to a single source that cannot be cited; this report's unit series are Marqstats constructions from order books and named deployments instead.