Market Snapshot
Key Takeaways
Market Overview & Analysis
Report Summary
The global connected car market is measured across embedded hardware value, wholesale carrier connectivity fees, commercial fleet SaaS and consumer connected software, estimated at USD 26,985.40 million in 2025 through a Marqstats bottom-up construction, since the underlying research contains no market-value total of its own. What the research does establish beyond doubt is the structural divide: commercial fleet telematics consistently outperforms consumer subscription monetization across every named corporate disclosure the source documents.
Structurally, this is a market defined by genuine bifurcation across two dimensions simultaneously: consumer versus commercial monetization, and mature versus industrializing regional markets. Stellantis converts just 36.2% of its monetizable connected parc to paying subscribers while Ford Pro's commercial division posts a 13.5% EBIT margin; Western Europe and North America show 82-89% factory-fit penetration while Asia-Pacific excluding China and the Rest of World remain below 37%.
The analysis is built for four reader types making different decisions: an automaker deciding how much capital to allocate toward commercial fleet software following Ford Pro's proven model versus continued consumer subscription investment given Stellantis's documented conversion gap, a Tier-1 supplier planning 5G TCU production capacity given the rapid projected shift from 4G LTE, a telecommunications operator assessing wholesale automotive IoT opportunity against AT&T's and Vodafone's own disclosed volume-versus-ARPU economics, and an investor assessing how much of this market's forecast depends on geopolitical supply-chain risk given the source's own Downside Scenario.
Global Connected Car Market Size and Forecast
Marqstats builds the global figure entirely bottom-up, since no market-value sizing chain exists in the underlying research. Four components are estimated separately: embedded hardware value applied to OICA production and connected-build data, wholesale carrier connectivity fees applied to the global active parc, and commercial and consumer software revenue informed by Ford Pro's and Stellantis's own respective corporate disclosures. Every multiplier used is a Marqstats assumption, disclosed explicitly rather than presented as sourced.
Under this construction, market value grows from an estimated USD 26,985.40 million in 2025 to USD 54,277.28 million by 2030, a 15.00% CAGR, broadly tracking the underlying research's own stated connected-parc growth from 345 million units in 2025 to 565 million units by 2030 under the Baseline Scenario, while assuming continued monetization-intensity growth consistent with rising 5G penetration and commercial fleet software attach rates.
The research's own three forward scenarios diverge specifically on regulatory enforcement timing and geopolitical supply-chain risk. The Baseline Scenario assumes existing statutory schedules hold — EU Delegated Regulation (EU) 2024/1180 for NG-eCall, UNECE R155/R156 across participating countries, and China's GB/T 32960 compliance with expanding V2X pilots — reaching 86.5% factory-fit penetration and a 565 million-unit active parc by 2030; the Infrastructure Upside Scenario assumes the US accelerates C-V2X spectrum licensing and RSU procurement while China mandates C-V2X Direct factory fitment by 2027, reaching 92.0% penetration and a 620 million-unit parc; the Geopolitical Downside Scenario assumes strict BIS 15 CFR Part 791 enforcement triggers reciprocal Chinese export restrictions and Western supply-chain disruption, capping penetration at 78.5% and the active parc at 510 million units — a scenario this analysis's own bottom-up estimate does not separately quantify in dollar terms, since the underlying research provides no value figure to scale.
The Global Divide Between Commercial and Consumer Monetization Is Total
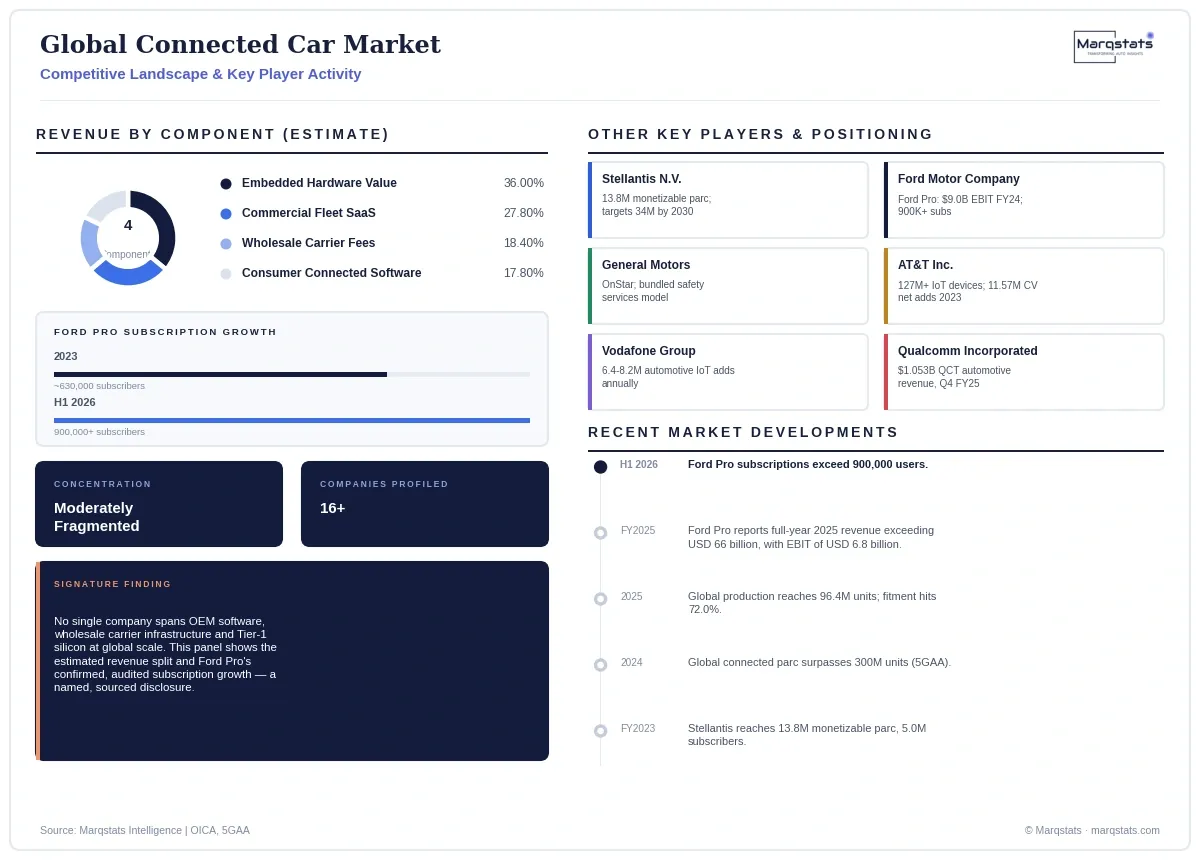
Every major connected-car market covered elsewhere in this coverage set shows some version of this pattern, but the underlying research's own global-level corporate disclosures make the gap unusually explicit and quantifiable. Stellantis, across its 14 brands, grew its monetizable connected parc 15% year-over-year to 13.8 million vehicles by year-end 2023 — yet only 5.0 million of those vehicles carried an active paying subscription, a 36.2% conversion rate, even as software and connected-services revenue grew 2.5 times between 2021 and 2023.
Ford Pro tells the opposite story from the opposite side of the same industry. Its commercial fleet division generated $66.9 billion in revenue and $9.0 billion in EBIT at a 13.5% margin for full-year 2024, with paid subscriptions growing from roughly 630,000 at year-end 2023 to over 900,000 by H1 2026 — durable, accelerating growth built on measurable fleet-operator ROI rather than consumer feature marketing. The two companies aren't just choosing different strategies; they're demonstrating, with audited financial disclosures, which side of the consumer-commercial divide this industry's real monetization currently sits on.
A Genuine Two-Tier World: Mature-Market Saturation Versus Emerging-Market Buildout
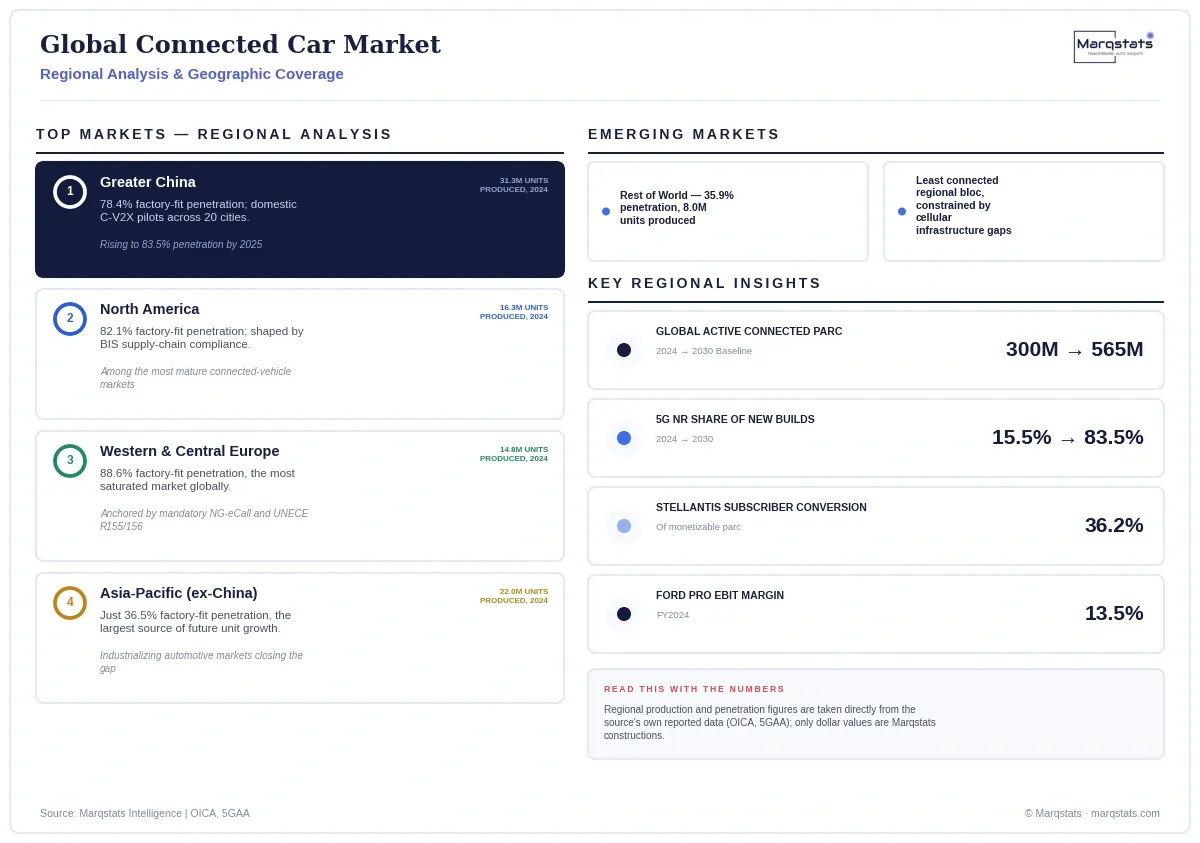
The global 67.0% factory-fit penetration figure for 2024 conceals a genuinely bifurcated regional reality. Western and Central Europe (88.6%) and North America (82.1%) are approaching saturation, where nearly every new vehicle ships connected as standard equipment. Asia-Pacific excluding China (36.5%) and the Rest of World (35.9%) remain at barely a third of that level, meaning the bulk of this market's unit growth through 2030 — from 300 million to 565 million active connected vehicles under the Baseline Scenario — will come from closing this regional gap, not from further growth in already-saturated mature markets.
That distinction matters enormously for how different participants should read this market's own growth forecast. A Tier-1 supplier or automaker reading the Baseline Scenario's headline unit growth as evenly distributed demand would be missing where that growth is actually concentrated: overwhelmingly in South and Southeast Asian markets industrializing their automotive base, not in incremental gains across Europe or North America, where the addressable new-vehicle population for further connectivity growth is already thin.
Market Dynamics
Key Drivers
Five conditions are moving this market, and commercial insurance mandates matter more than consumer demand.
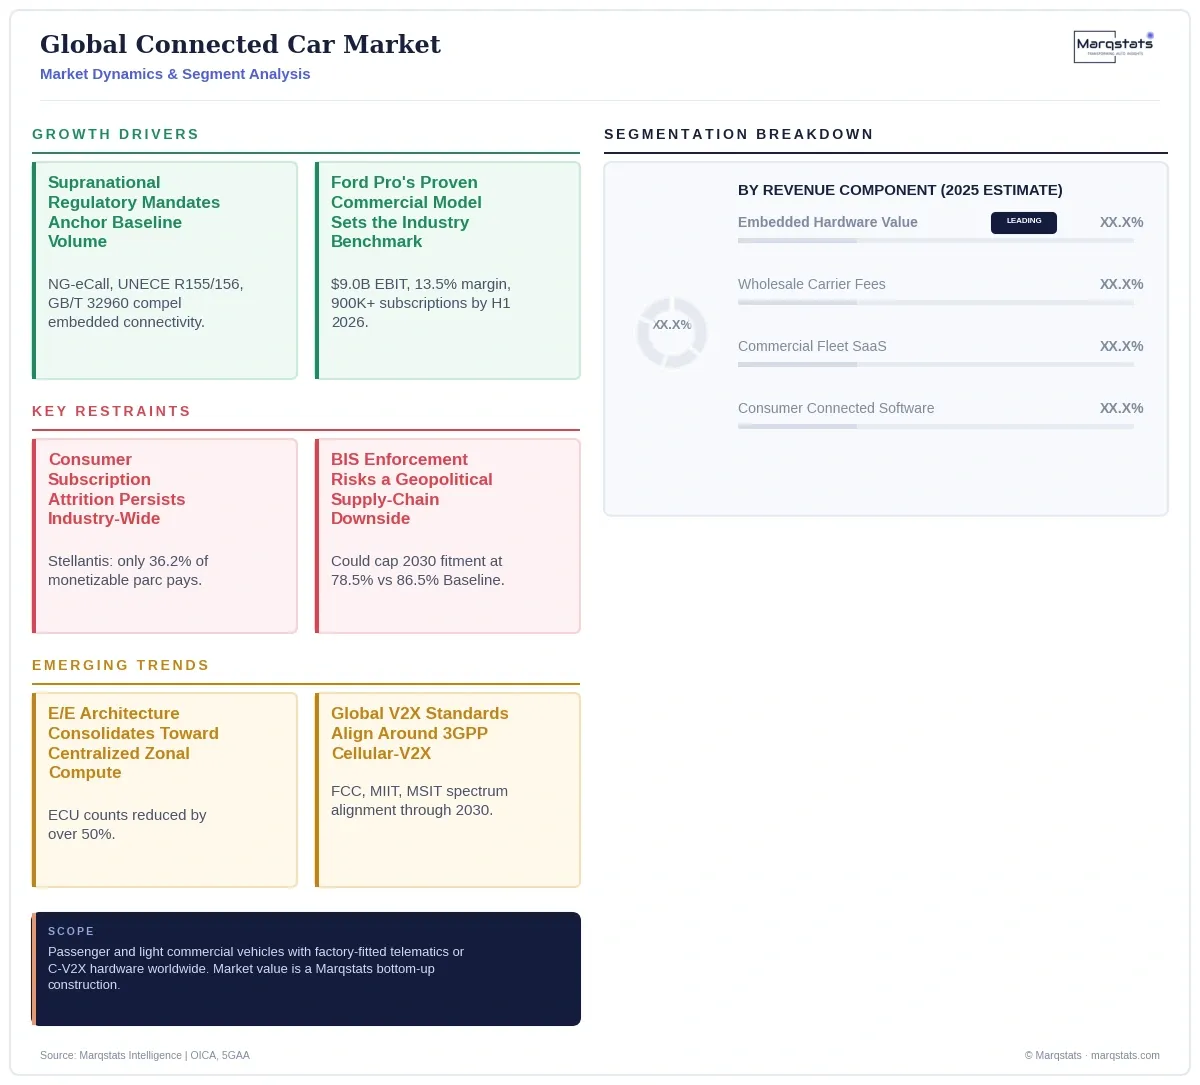
- Supranational regulatory mandates — the EU's NG-eCall Delegated Regulation (EU) 2024/1180, UNECE WP.29 Regulations 155 and 156, and China's GB/T 32960 standard — compel OEMs to embed connectivity, cryptographic modules and OTA infrastructure as a baseline requirement rather than an optional feature, anchoring market volume independent of consumer demand fluctuation.
- Ford Pro's proven commercial fleet telematics model, generating a 13.5% EBIT margin and accelerating subscriber growth past 900,000 by H1 2026, demonstrates a genuine, replicable alternative to consumer subscription monetization that other automakers are increasingly likely to emulate given Stellantis's own documented conversion challenges.
- The generational shift from distributed peripheral TCUs toward centralized High-Performance Computing and zonal gateway architectures reduces ECU counts by over 50%, lowering harness mass and enabling the rapid software development cycles unified platforms like Qualcomm's Snapdragon Digital Chassis support.
- Rapid 5G New Radio adoption, projected to grow from 15.5% to 83.5% of new connected-vehicle builds between 2024 and 2030, is driven by the lower transmission latencies cooperative perception and centralized edge-compute handoffs require, creating durable hardware upgrade demand independent of any single regional market's own maturity level.
- Industrializing automotive markets across South and Southeast Asia are closing the regional factory-fit penetration gap from a 2024 base of roughly 36% toward the global average, representing the single largest source of incremental unit volume growth through 2030 under every scenario the underlying research models.
Key Restraints
Four constraints stand between this market and a fully monetized, evenly connected fleet.
- Consumer connected-software monetization faces persistent subscription fatigue and high post-trial attrition, exemplified by Stellantis's own 36.2% conversion rate from its 13.8 million-vehicle monetizable parc to actual paying subscribers, despite substantial underlying revenue growth.
- Strict enforcement of the US Bureau of Industry and Security's 15 CFR Part 791 connected-vehicle prohibitions risks triggering reciprocal Chinese export restrictions on microcontrollers and cellular IoT basebands, a genuine geopolitical trigger the source's own Downside Scenario shows could cap 2030 factory-fit penetration nearly 8 percentage points below the Baseline Scenario.
- Wholesale carrier economics for automotive IoT connections run on persistently low average revenue per unit ($0.80 to $2.20 monthly per AT&T's own disclosure), meaning telecommunications operators depend on sheer connection-volume scale rather than high-margin retail billing to generate meaningful returns from connected-vehicle infrastructure investment.
- This report's own bottom-up market-value construction carries materially wider uncertainty than a sourced market figure would, given the underlying research provides no total addressable market estimate to validate against, unlike most other reports in this coverage set.
Key Trends
Four shifts show where the market is heading and who captures the value.
- Automotive E/E architectures are transitioning definitively from standalone peripheral TCUs interconnected across low-bandwidth CAN buses toward centralized High-Performance Computing and zonal gateways operating over Automotive Ethernet, reducing ECU counts by over 50% industry-wide.
- OEMs are increasingly de-emphasizing direct-to-consumer micromanaged subscription models, which the underlying research explicitly identifies as generating brand friction and customer churn, in favor of commercial fleet telematics business models modeled directly on Ford Pro's proven structure.
- Following the regulatory deprecation of DSRC, global vehicle-to-everything standards have aligned around 3GPP-defined Cellular-V2X operating within the 5.9 GHz ITS band, with the US FCC, Chinese MIIT and South Korean MSIT all establishing the spectrum certainty required for mass C-V2X integration through 2030.
- Tier-1 suppliers are transitioning from manufacturing standalone metal-enclosed telematics modules toward providing integrated smart antenna hubs and zonal compute software blocks, while facing growing supply-chain auditing demands to eliminate Chinese- or Russian-sourced subcomponents ahead of Model Year 2027 and 2030 BIS deadlines.
Strategic Implications
- Anyone using this market's own headline statistics for planning should weight the underlying unit-level production, penetration and named-company revenue data more heavily than the constructed USD totals themselves, given how directly this analysis's own bottom-up estimate depends on assumptions the underlying research does not independently confirm.
- Automotive manufacturers should de-emphasize direct-to-consumer subscription models given Stellantis's own documented 36.2% conversion challenge, and should prioritize commercial fleet telematics investment following Ford Pro's proven, accelerating subscriber and margin growth instead.
- Tier-1 suppliers should accelerate the transition from standalone TCU manufacturing toward integrated zonal compute and 5G-capable smart antenna platforms, while establishing supply-chain auditing capability well ahead of the Model Year 2027 and 2030 BIS compliance deadlines given the genuine downside risk the source's own Geopolitical Downside Scenario quantifies.
- Telecommunications operators should treat connected-vehicle IoT connections as a volume-driven, not margin-driven, growth segment, investing in automated eSIM provisioning and lifecycle orchestration infrastructure rather than expecting meaningful per-connection ARPU expansion.
- Investors and analysts should track BIS enforcement intensity and China's own C-V2X Direct factory-fitment mandate timeline as the two clearest variables separating this market's Infrastructure Upside and Geopolitical Downside scenarios, while weighting the underlying unit-level production, penetration and named-company revenue data more heavily than this analysis's own constructed USD totals.
Market Segmentation
The dollar values below are a Marqstats construction, applying the four estimated revenue components underlying this market's total estimate. Unit-level figures (production, penetration, 5G share) are taken directly from the underlying research's own stated data.
USD 9,717.40 million estimated for 2025, applied to 69.41 million connected-vehicle builds. 5G New Radio hardware share is growing from 15.5% of new builds in 2024 toward 83.5% by 2030, a greater than 32% CAGR, compressing 4G LTE's share from 84.5% to just 16.5%.
USD 4,968.00 million estimated for 2025, applied to the 345 million-unit global active connected parc. AT&T's own disclosed wholesale ARPU for automotive SIMs runs $0.80 to $2.20 monthly, reflecting a volume-driven, low-margin commercial structure.
USD 7,500.00 million estimated for 2025. Ford Pro alone generated $66.9 billion in total commercial division revenue and $9.0 billion in EBIT at a 13.5% margin for full-year 2024, with paid software subscriptions surpassing 900,000 by H1 2026.
USD 4,800.00 million estimated for 2025. Stellantis's own disclosures show just 36.2% of its 13.8 million-vehicle monetizable connected parc converts to paying subscribers, illustrating persistent consumer subscription attrition industry-wide.
By Geography
Greater China
31,281,592 vehicles produced in 2024, 78.4% factory-fit connectivity penetration, rising toward 83.5% by 2025 per the source's own regional table, anchored by domestic C-V2X pilot expansion across 20 cities and GB/T 32960 compliance.
North America
16,317,856 vehicles produced in 2024, 82.1% factory-fit penetration, among the most mature connected-vehicle markets globally, shaped by BIS supply-chain compliance requirements and accelerating C-V2X spectrum deployment.
Western & Central Europe
14,814,249 vehicles produced in 2024, 88.6% factory-fit penetration, the most saturated regional market globally, anchored by mandatory NG-eCall and UNECE R155/R156 compliance across the EU and participating countries.
Asia-Pacific (ex-China)
22,049,045 vehicles produced in 2024, just 36.5% factory-fit penetration, representing the single largest source of incremental unit growth through 2030 as regional automotive markets industrialize and close the connectivity gap with mature regions.
Rest of World
8,037,258 vehicles produced in 2024, just 35.9% factory-fit penetration, the least connected regional bloc globally, constrained by cellular infrastructure gaps and lower average vehicle price points limiting embedded hardware adoption.
How Competition Is Evolving
No single company in this market spans OEM software platforms, wholesale carrier infrastructure and Tier-1 silicon manufacturing simultaneously at genuinely global scale, leaving meaningful competitive white space for any provider capable of bridging all three layers as centralized zonal compute architecture becomes the global industry standard through the remainder of this decade.
Competition spans OEM software platforms, Tier-1 hardware suppliers, and telecommunications infrastructure providers operating at genuinely global scale. Stellantis N.V., across its 14 brands, targets 34 million monetizable connected vehicles and €20 billion in annual software net revenue by 2030 under its Dare Forward 2030 framework, having already executed over 94 million individual OTA updates in 2023 alone. Ford Motor Company's Ford Pro division represents the industry's clearest commercial fleet telematics benchmark, while General Motors has restructured OnStar to bundle safety services into vehicle purchase prices rather than market them as standalone consumer subscriptions, minimizing customer opt-out exposure.
On connectivity infrastructure, AT&T Inc. operates as the leading wholesale connected-car carrier in North America with over 127 million total connected IoT devices and 11.57 million wholesale connected-car net additions in 2023 alone, while Vodafone Group's enterprise IoT division added 6.4 to 8.2 million automotive connections annually across recent fiscal years, explicitly attributing sustained volume to automotive manufacturing demand. On silicon and hardware, Qualcomm Incorporated's automotive segment generated $1.053 billion in Q4 FY2025 revenue alone (up 17% year-over-year) through its Snapdragon Digital Chassis platform, while Continental AG reported €19.416 billion in full-year 2024 automotive sector net sales.
Companies Covered
The report profiles 16+ companies with full strategy and financials analysis, including:
Recent Market Activity
Table of Contents
Coverage & Segmentation
This report measures passenger and light commercial vehicles worldwide carrying factory-fitted cellular telematics, C-V2X communication hardware, and connected software, across a 2025 base year and a 2026 to 2030 forecast period, denominated in United States dollars. It excludes non-automotive IoT connections and heavy commercial trucking outside OICA's own production scope. Both the 2025 base year and the 2030 forecast are Marqstats constructions built bottom-up from production, penetration and named-company revenue data, since the underlying research contains no market-value sizing chain of its own.
The analysis spans four estimated revenue components, five global regional geographies, and 16 profiled entities across OEMs, telecommunications carriers, Tier-1 suppliers and regulatory bodies. Production and penetration figures trace to OICA and the 5G Automotive Association; the market value figures are Marqstats constructions, explicitly disclosed rather than presented as sourced.