Market Snapshot
Middle bar: base-year value × (1 + CAGR), rounded to two decimals. This is a calculated illustration, not a separately researched annual estimate.
The global autonomous vehicle insurance market size is estimated at USD 4,100.00 million in 2025 and is projected to reach USD 11,970.00 million by 2030, growing at a CAGR of 23.90% over 2026 – 2030. Growth comes from robotaxi and autonomous truck fleets, carmakers accepting liability for Level 3 systems, and high legal liability limits for driverless vehicles, even as crash frequency falls.
Marqstats defines the market as gross written premium for liability insurance covering vehicles operating with SAE Level 3 conditional automation or Level 4 and Level 5 high and full automation. It covers personal auto liability for privately owned Level 3 vehicles, product liability for carmakers, software developers and sensor suppliers, and commercial auto liability for robotaxi, shuttle and autonomous truck fleets. Insurance for vehicles with only Level 1 or Level 2 driver assistance is excluded.
Personal auto liability accounts for an estimated 39.00% of 2025 premium, product liability for 32.00% and commercial fleet liability for 29.00%. Level 3 vehicles generate 58.00% of premium. North America accounts for 44.00% of 2025 premium and Asia-Pacific for 31.00%. The study segments the market by policy type, automation level and region.
Key Takeaways
Market Overview & Analysis
Report Summary
Marqstats sizes the autonomous vehicle insurance market as gross written premium for liability insurance on vehicles with Level 3 or higher automation. It includes personal auto policies for privately owned cars with Level 3 systems such as Mercedes-Benz DRIVE PILOT, product liability policies bought by carmakers, software developers and component suppliers to cover failures of automated driving systems, and commercial auto liability for robotaxi, shuttle and autonomous truck fleets. In 2025 the market was worth an estimated USD 4,100.00 million.
The market sits within a much larger motor insurance industry. Motor insurance accounts for about 40% of global non-life insurance, or roughly USD 880 billion of annual premium. For more than a century, motor insurance priced risk using driver age, record and location. Automation shifts the driving task from humans to software, moving liability from driver negligence towards product and commercial liability.
Liability rules differ by country. The United Kingdom makes the motor insurer strictly liable to victims when a vehicle drives itself, with a right to recover costs from the manufacturer or software developer. The EU's revised Product Liability Directive, which must be applied by member states by 9 December 2026, covers software and AI and presumes a defect when manufacturers refuse to disclose technical data. Germany keeps strict liability on the vehicle keeper with higher limits, and US states apply their own tort rules and insurance minimums.
Underwriting is changing. Instead of rating drivers, insurers price software reliability, distance between disengagements, sensor wear and the vehicle's operating domain. Claims require analysis of event data recorders and automated driving data stores, and recovering costs from manufacturers involves forensic engineering and disputes over intellectual property. Loss adjustment expenses rise from about 11% to 14% of losses in personal auto to about 28% to 35% in commercial autonomous lines.
The market grew from USD 1,820.00 million in 2021 to USD 2,240.00 million in 2022, USD 2,770.00 million in 2023 and USD 3,380.00 million in 2024. Marqstats expects USD 5,080.00 million in 2026 as robotaxi fleets expand and EU product liability rules take effect, and USD 11,970.00 million in 2030.
Three groups buy autonomous vehicle insurance. Owners of private Level 3 cars buy personal auto policies that now include clauses for automated driving modes. Carmakers, driving software developers and sensor suppliers buy product liability and recall programmes sized for failures that can repeat across an entire fleet. Robotaxi, shuttle and autonomous truck operators buy commercial auto liability towers, often combined with large self-insured retentions, captive insurers and excess layers placed with reinsurers. Each group faces different legal rules, limits and claims processes, which is why Marqstats tracks the three policy lines separately.
Global Autonomous Vehicle Insurance Market Size and Forecast
The global autonomous vehicle insurance market grows from USD 4,100.00 million in 2025 to USD 11,970.00 million in 2030, a CAGR of 23.90%. Annual growth stays close to 24% throughout the forecast, similar to the 21% to 24% growth recorded between 2022 and 2025.
Premium grows despite falling crash rates because of three forces. Insurance spending is shifting from low-limit personal policies to high-limit commercial fleet and product liability programmes. Regulators require high liability limits for driverless vehicles. And repairs to sensors, cameras, radar, lidar and high-voltage batteries make each claim more expensive.
Commercial rates fall per mile but grow in total. Marqstats estimates the average commercial autonomous liability rate falls from about USD 0.14 per mile in 2021 to USD 0.08 in 2025 and USD 0.04 in 2030 as safety data accumulate. Fleet growth from about 12,850 to 148,000 vehicles more than offsets the lower rate.
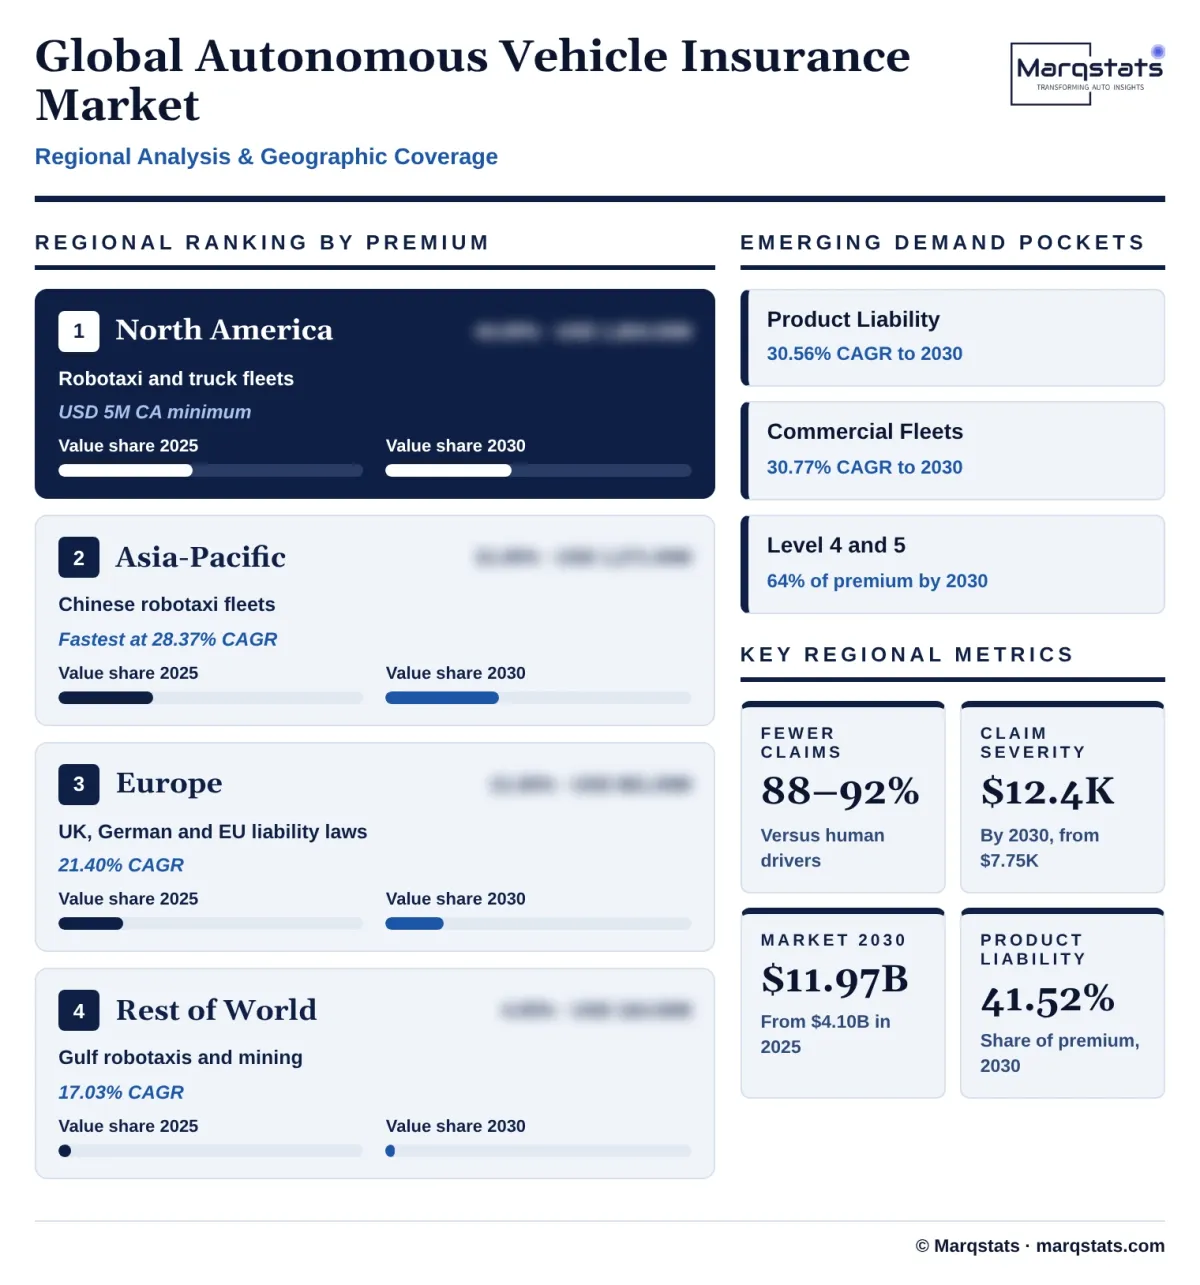
Claim severity keeps rising. A low-speed bump that costs USD 600 to 900 to repair on a conventional car can cost USD 7,500 to 12,000 on an autonomous vehicle because sensors must be replaced and recalibrated, and underbody impacts on electric vehicles can lead to USD 15,000 to 22,000 total-loss settlements. Marqstats estimates average physical damage severity rises from about USD 4,850 in 2021 to USD 7,750 in 2025 and USD 12,400 in 2030.
Profitability is sensitive to repair costs. Marqstats estimates a commercial fleet book breaks even at a combined ratio of about 99% at current sensor repair costs. A 10% reduction in sensor repair costs brings the combined ratio to about 92.7%, while a 10% increase pushes it to about 105.5%, requiring rate increases of about 6%.
The mix of premium changes more than the total. In 2025 personal auto liability is the largest line, but by 2030 product liability and commercial fleet liability together account for 79.53% of premium, against 61.00% in 2025. Level 4 and Level 5 vehicles overtake Level 3 in premium during 2027, when driverless fleets in the United States and China reach a scale where their high-limit towers exceed the premium from privately owned Level 3 cars. Asia-Pacific narrows the gap with North America, rising from 31.00% to 37.01% of premium, while Europe holds close to a fifth of the market as the revised Product Liability Directive takes effect.
Marqstats tracks four indicators to monitor the forecast: driverless fleet size and miles by market, statutory minimum limits for automated vehicles, average sensor and battery repair costs, and the number of product liability claims involving automated driving systems. Faster fleet growth in China or the United States, or larger court awards against manufacturers, would push premium above the base path, while faster falls in sensor prices would lower claim severity and slow premium growth.
Market Dynamics
Key Drivers
Five forces are expanding insurance premium for automated vehicles.
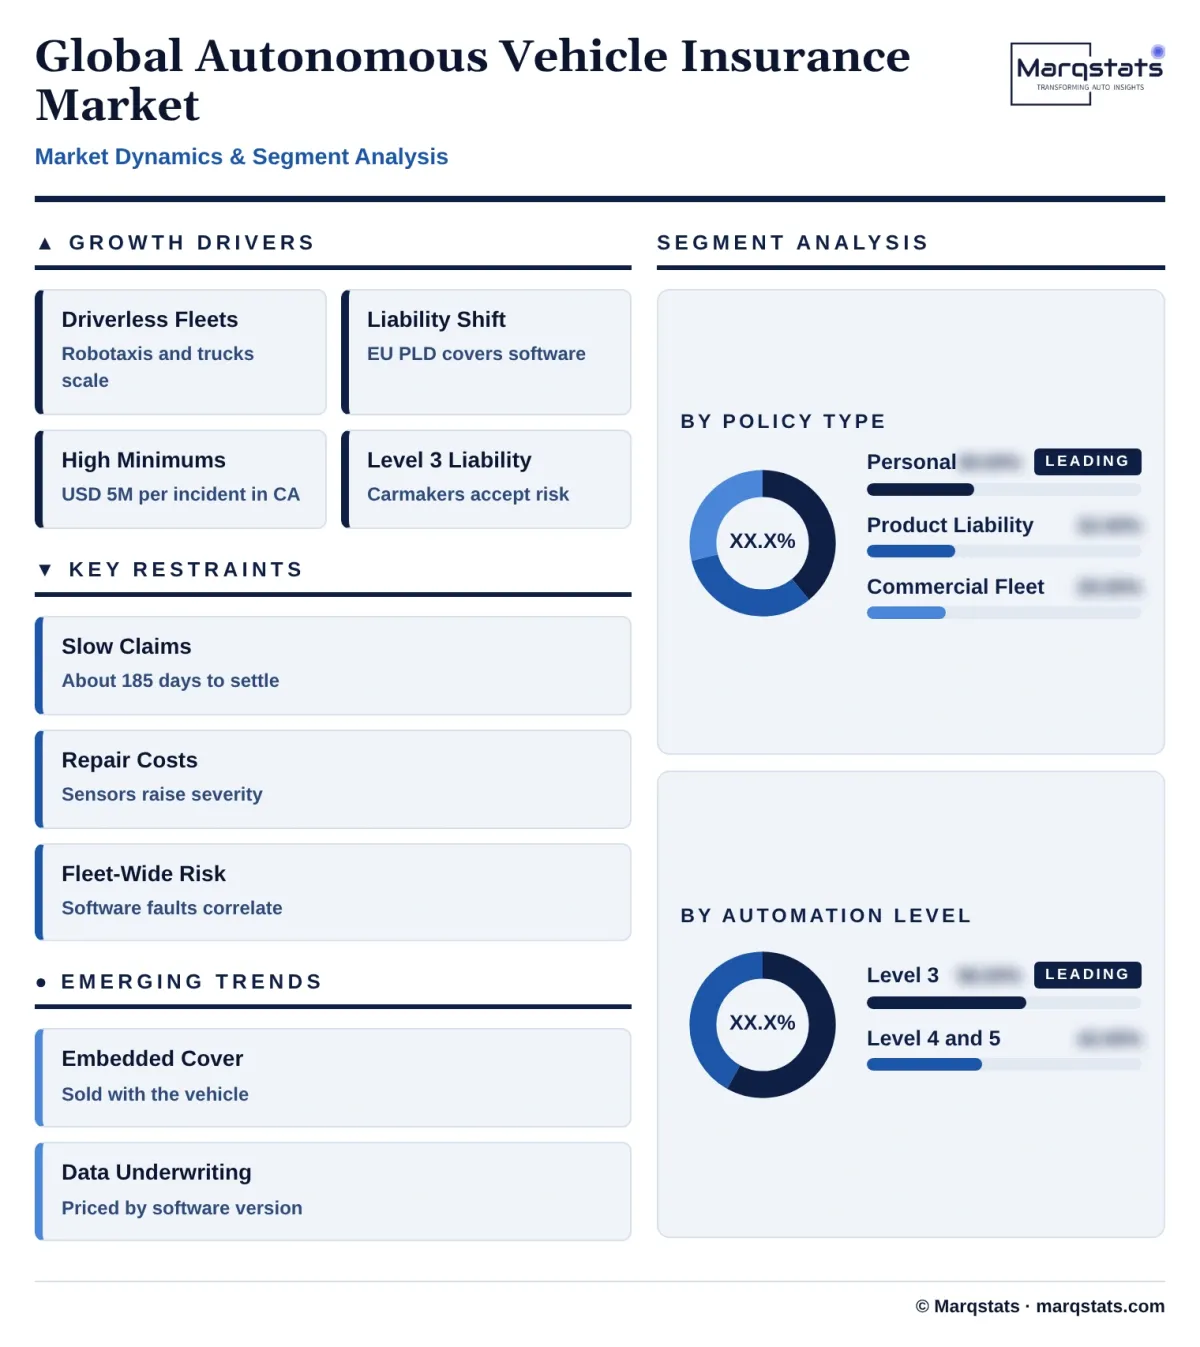
- Driverless fleets are expanding. Waymo operates about 4,000 vehicles in US cities, Chinese operators run thousands of robotaxis, Wayve and Uber launched supervised robotaxi rides in London in 2026, and autonomous trucks are running in Texas and China. Each fleet must carry high-limit commercial liability insurance.
- Liability laws are moving to manufacturers. The revised EU Product Liability Directive treats software and AI as products, removes the development risk defence for defects arising from updates after sale, and extends limitation periods for latent injuries to 25 years. Manufacturers and suppliers need more product liability cover as a result.
- Regulators set high insurance minimums. California requires USD 5 million of cover per robotaxi incident, Germany EUR 10 million for bodily injury and EUR 2 million for property damage, and the United Kingdom requires unlimited bodily injury cover, keeping premium high.
- Carmakers accept liability for Level 3. Mercedes-Benz accepts legal responsibility when DRIVE PILOT is engaged, and other carmakers launching Level 3 systems must arrange product liability and embedded insurance programmes.
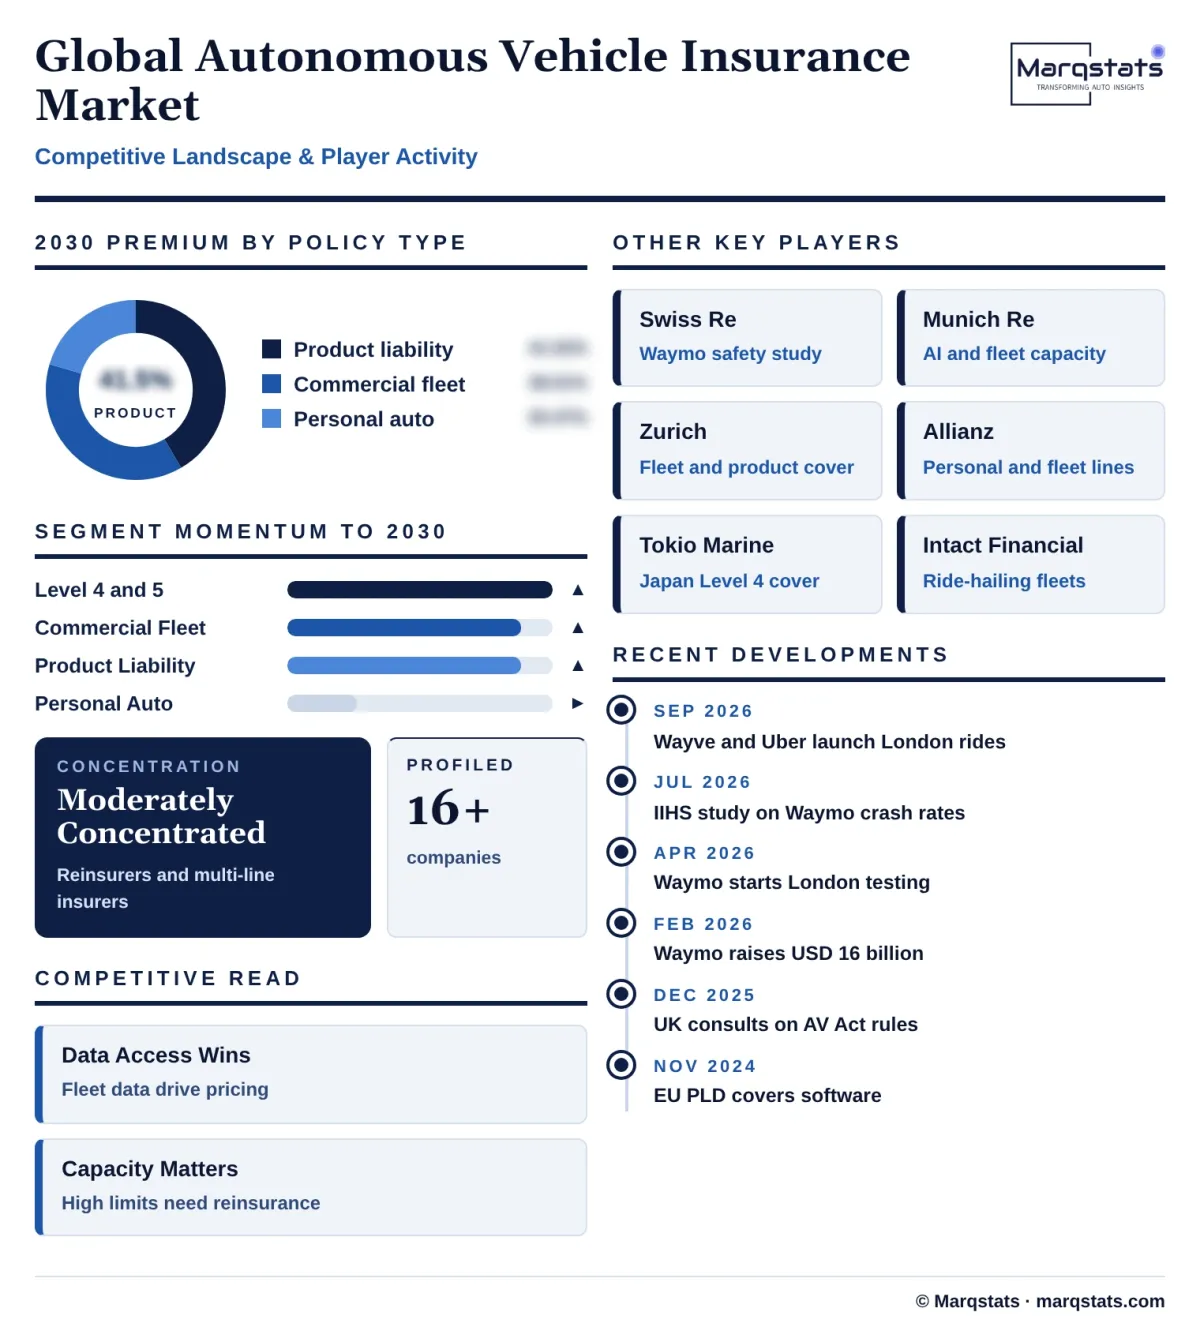
- Safety data make autonomous risk insurable. Swiss Re's study with Waymo and research by the Insurance Institute for Highway Safety in 2026 found that Waymo vehicles crash less often than human drivers, encouraging insurers and reinsurers to provide capacity.
Key Restraints
Four constraints make autonomous vehicle risk hard to price and settle.
- Claims are slow and costly to settle. Recovering costs from manufacturers requires authenticated vehicle data, forensic analysis of driving software and disputes over trade secrets, extending claim cycles to about 185 days and raising adjustment costs.
- Repair costs are volatile. Shortages of lidar or other sensors, or higher calibration costs, can quickly turn commercial fleet books unprofitable, forcing rate increases or higher deductibles.
- Correlated risks are hard to price. A faulty software update, sensor failure in bad weather or cyberattack could cause many claims at once across a fleet, challenging the assumption that crashes are independent events.
- Rules are fragmented. US insurance minimums and tort rules differ by state, EU member states are still transposing the new Product Liability Directive and the UK framework will not be fully in force until 2027, creating uncertainty for insurers and manufacturers.
Key Trends
Four shifts are changing who buys autonomous vehicle cover and how it is priced.
- Premium is moving from personal to commercial and product lines. As more miles are driven in shared autonomous fleets and manufacturers take on liability, personal auto premium grows slowly while commercial fleet and product liability expand.
- Insurance is being embedded at the point of sale. Carmakers and insurers are building insurance into vehicle purchases and subscriptions, letting manufacturers control coverage and claims when their systems are in control.
- Insurers are using vehicle data. Insurers and fleet operators are linking policies to real-time telematics, disengagement data and software versions, and actuaries are moving reserving segmentation from driver profiles to software releases and manufacturers.
- Reinsurers are building specialist capacity. Swiss Re and Munich Re provide research, claims benchmarks and excess-of-loss capacity for high liability limits, and develop cover for AI performance, cyber and fleet-wide software failures.
Strategic Implications
- For personal auto insurers, partnerships protect premium. As personal premium growth slows, insurers can work with carmakers to embed cover in vehicle sales and build subrogation teams to recover costs when automated systems cause crashes.
- For commercial and specialty insurers, fleet data enable pricing. Insurers that integrate directly with fleet data systems and price by operating domain, software version and disengagement rates can write profitable high-limit fleet programmes.
- For carmakers and software developers, liability is now a product cost. Manufacturers need product liability programmes sized for fleet-wide exposure, careful records of validation and updates, and clear contracts with suppliers on responsibility for failures.
- For reinsurers, accumulation risk needs its own terms. Excess-of-loss treaties for high statutory limits, combined with sub-limits for fleet-wide software or cyber events, can provide capacity while controlling exposure.
- For regulators, data access rules matter. Clear requirements for event data recorders and automated driving data stores, and for sharing data with insurers, would speed claims and lower costs.
- For brokers, programme design is the opportunity. Operators and manufacturers need layered towers that combine self-insured retentions, captives, primary fleet cover and excess layers with clear terms for software and cyber events. Brokers that can model fleet-wide accumulation and negotiate data-sharing terms with insurers will capture a growing share of placement fees as commercial and product premium expands.
Market Segmentation
Personal auto liability for privately owned vehicles with Level 3 systems accounts for 39.00% of 2025 premium, USD 1,600.00 million, rising to USD 2,450.00 million by 2030, an 8.90% CAGR, while its share falls to 20.47%. Insurers such as Zurich and Allianz offer policies covering both human and automated driving modes, but more miles shift to shared fleets and manufacturers take on more liability.
Product liability insurance for carmakers, AI developers and sensor suppliers accounts for 32.00% of 2025 premium, USD 1,310.00 million, and grows to USD 4,970.00 million by 2030, a 30.56% CAGR, becoming the largest line at 41.52%. The revised EU Product Liability Directive and manufacturers' acceptance of liability during automated operation drive growth.
Commercial auto liability for robotaxis, autonomous shuttles and autonomous trucks accounts for 29.00% of 2025 premium, USD 1,190.00 million, and grows fastest, at 30.77% a year, to USD 4,550.00 million and 38.01% of the market by 2030, supported by high statutory limits and fleet growth.
Level 3 conditional automation, mainly premium cars with highway and traffic jam systems such as Mercedes-Benz DRIVE PILOT, accounts for 58.00% of 2025 premium, USD 2,380.00 million, rising to USD 4,310.00 million by 2030, a 12.61% CAGR, while its share falls to 36.01% as manufacturers focus on driverless systems to avoid handover disputes.
Level 4 and Level 5 driverless systems account for 42.00% of 2025 premium, USD 1,720.00 million, and grow at 34.82% a year to USD 7,660.00 million and 63.99% of the market by 2030, driven by robotaxi services and autonomous freight corridors.
By Geography
North America
North America is the largest market, with an estimated 44.00% of 2025 premium, USD 1,804.00 million, rising to USD 4,910.00 million by 2030, a 22.17% CAGR. Robotaxi and autonomous truck fleets in Arizona, California and Texas, California's USD 5 million liability requirement and US litigation costs drive premium. Florida sets a USD 1 million minimum and treats the automated driving system as the driver when engaged. Insurers such as Intact Financial are active in ride-hailing and autonomous fleet cover. State tort rules and large jury awards keep bodily injury severity high, and operators report crashes involving automated driving systems to NHTSA under its standing general order, giving insurers a public record of incidents to price against.
Asia-Pacific
Asia-Pacific accounts for an estimated 31.00% of 2025 premium, USD 1,271.00 million, and grows fastest, at 28.37% a year, to USD 4,430.00 million and 37.01% of the market by 2030. Large robotaxi fleets operated by Baidu Apollo Go, Pony.ai and WeRide in Chinese cities and Level 4 transit services in Japan drive demand, with insurers such as Tokio Marine developing cover under Japan's revised road traffic law. Chinese insurers such as Ping An and PICC write cover for robotaxi operators in Wuhan, Beijing, Shenzhen and other pilot cities, where local rules set operator responsibility and insurance requirements for driverless testing and commercial services.
Europe
Europe accounts for an estimated 21.00% of 2025 premium, USD 861.00 million, rising to USD 2,270.00 million by 2030, a 21.40% CAGR. Germany's high liability limits and Technical Supervisor cover requirement, the UK's insurer-first liability model under the Automated and Electric Vehicles Act 2018 and Automated Vehicles Act 2024, and the revised EU Product Liability Directive shape the market. Wayve and Uber launched supervised robotaxi rides in London in 2026, and Waymo began testing there.
Rest of World
The Middle East and other regions account for an estimated 4.00% of 2025 premium, USD 164.00 million, rising to USD 360.00 million by 2030, a 17.03% CAGR, mainly from autonomous mining vehicles and robotaxi services in the UAE and Saudi Arabia.
How Competition Is Evolving
The autonomous vehicle insurance market is moderately concentrated among large reinsurers and multi-line insurers. Swiss Re and Munich Re provide research, claims benchmarks and reinsurance capacity for high liability limits. Zurich, Allianz, Intact Financial, Tokio Marine and other primary insurers write personal, commercial fleet and product liability cover.
Large operators and manufacturers retain much of their own risk. Waymo and other well-funded operators use self-insured retentions and captives, buying commercial towers mainly to meet legal minimums. Mercedes-Benz and other carmakers accept liability for their Level 3 systems and arrange product liability programmes.
Specialist programmes are emerging. Brokers and specialist underwriters design master programmes for platforms that dispatch vehicles from several technology companies, and insurtechs offer data-driven fleet policies linked to telematics and software versions.
Competition will be decided by data access, claims capability and capacity. Insurers with direct access to fleet data, forensic engineering teams for subrogation and the balance sheet to support high liability limits will win the largest programmes.
Partnerships between insurers and technology companies shape the market. Swiss Re's research with Waymo gave insurers a large set of claims data from driverless operations, and reinsurers use such data to set excess-of-loss pricing for statutory limits. Primary insurers that partner with carmakers on embedded policies gain early access to vehicle data and a role in claims handling, while brokers such as Marsh and Aon design programmes that combine fleet liability, product liability, cyber and property cover for operators and manufacturers.
Companies Covered
Companies covered in the report include:
Recent Market Activity
Table of Contents
Coverage & Segmentation
The study covers the global autonomous vehicle insurance market, with 2025 as the base year, 2021 – 2025 as the historical period and 2026 – 2030 as the forecast period. Values are in US dollars. The market covers gross written premium for personal auto, product and commercial fleet liability insurance on vehicles with SAE Level 3 or higher automation. It is segmented by policy type, automation level and region.
Insurance for vehicles with only Level 1 or Level 2 driver assistance, warranty and extended service contracts, and premium for conventional vehicles are excluded. Policy, automation level and regional splits are Marqstats estimates built on liability laws, fleet deployment data, insurer and reinsurer research, and claims frequency and severity benchmarks.