Market Snapshot
Middle bar: base-year value × (1 + CAGR), rounded to two decimals. This is a calculated illustration, not a separately researched annual estimate.
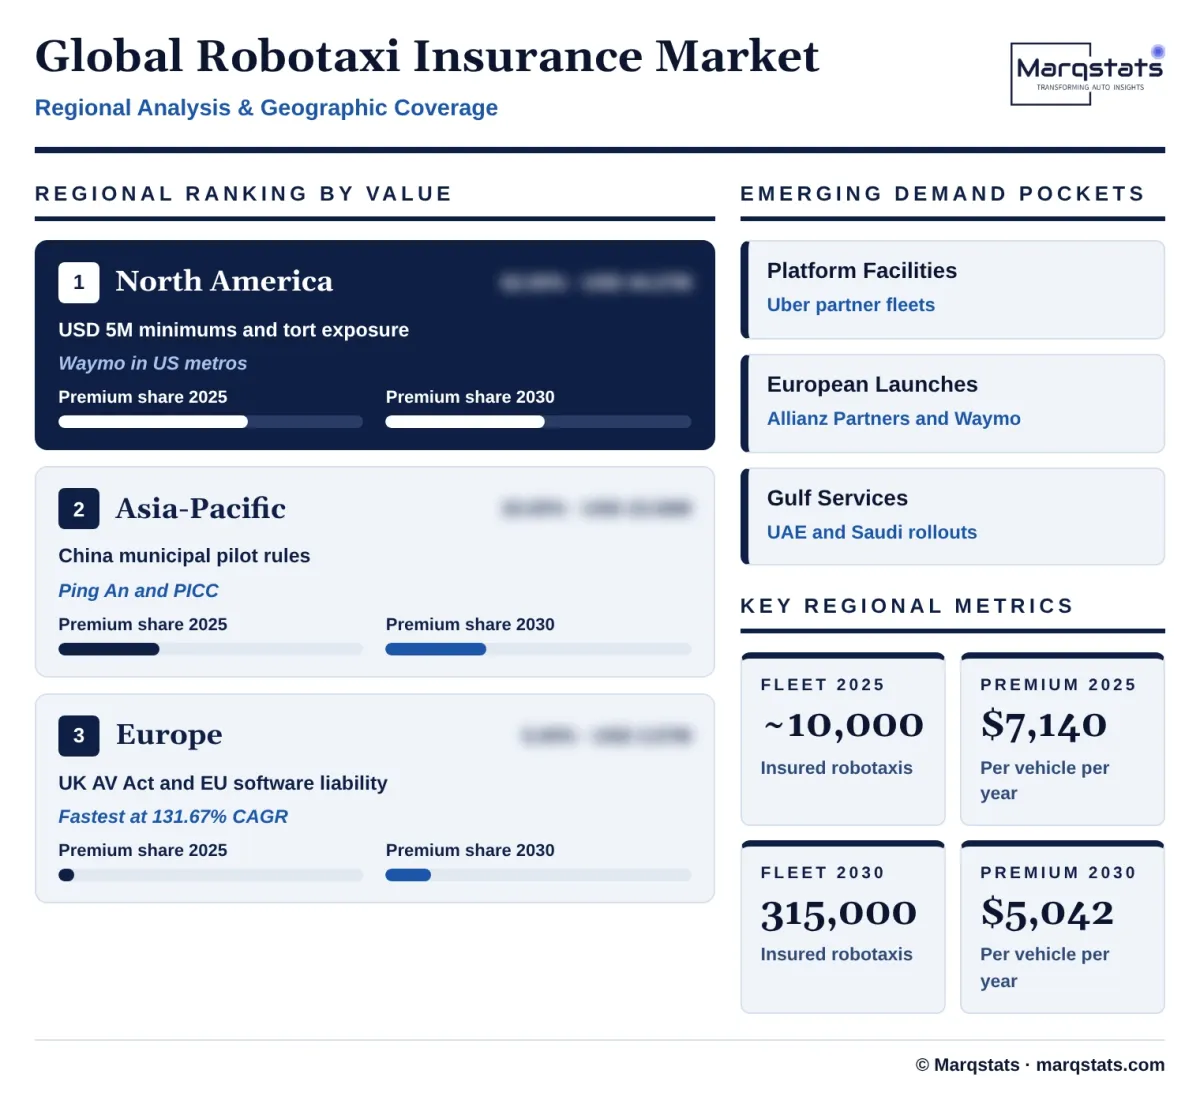
The global robotaxi insurance market size is estimated at USD 71.40 million in 2025 and is projected to reach USD 1,588.36 million by 2030, growing at a CAGR of 85.97% over 2026 – 2030. The insured commercial Level 4 fleet grows from about 10,000 vehicles to 315,000, while the average annual premium per vehicle falls from about USD 7,140 to USD 5,042.
Marqstats defines the robotaxi insurance market as the commercial risk-transfer premium written for SAE Level 4 passenger vehicles operated without a human driver in ride-hailing and ride-pooling fleets. It covers three lines: commercial auto liability, automated driving system (ADS) product liability, and technology errors and omissions with cyber cover. Premium is measured as direct written premium, fronting fees and funded risk-retention allocations, in US dollars.
North America accounts for an estimated 62.00% of 2025 premium, Asia-Pacific for 33.00% and Europe for 5.00%. Commercial auto liability is the largest line at 55.00% of premium, while ADS product liability is the fastest-growing line, rising from 30.00% to 35.00% of the pool by 2030. The study segments the market by coverage line and operating model and excludes personal motor insurance for driver-assistance cars, autonomous freight trucking and physical damage to the vehicle itself.
Key Takeaways
Market Overview & Analysis
Report Summary
Marqstats sizes the robotaxi insurance market as the premium paid to insure commercial SAE Level 4 passenger fleets that operate with no human driver in control. This includes commercial auto liability for third-party injury and damage, ADS product liability for failures of the driving system, and technology errors and omissions and cyber cover for software defects, network intrusions and remote operations failures. Premium includes direct written premium from insurers, fronting fees paid to carriers that issue policies on behalf of captives, and funded allocations to captive insurers. In 2025 the market was worth an estimated USD 71.40 million across about 10,000 insured vehicles.
The market sits within a much larger insurance industry. Global commercial motor insurance is worth about USD 880 billion a year, and insurance for human-driven taxis, ride-hailing and car-sharing about USD 32 to 36 billion. Robotaxi insurance is a small but fast-growing part of that pool. Its growth depends on how quickly fleets expand and on how insurers and regulators divide liability between fleet operators, software developers and carmakers once no human is driving.
Robotaxi insurance is underwritten very differently from conventional motor cover. Insurers no longer price the driver's record, age and claims history. Instead they assess the driving system: how it was validated, where it is allowed to operate, how sensors degrade and how often software is updated. This turns motor insurance into something closer to product liability and technology insurance, and it requires insurers to work with engineering data rather than personal data.
The core business case for insurers rests on safety evidence. Waymo and Swiss Re compared claims from 25.3 million fully driverless miles with a human-driver baseline built from more than 600,000 claims and 200 billion miles, and found 88% fewer property damage claims and 92% fewer bodily injury claims. Later Waymo safety data, covering a much larger mileage base, show large reductions in injury-causing and serious crashes. This evidence supports lower premiums per vehicle, but it is concentrated in a few US cities with favourable weather and road conditions.
The market is still concentrated in a few countries and a few buyers. Waymo in the United States and Baidu Apollo Go, Pony.ai and WeRide in China operate most of the world's commercial robotaxis. Chinese municipal pilots require RMB 5 million to RMB 10 million of liability cover per vehicle, while US states set higher minimums and face larger court awards. Europe, the Middle East and the rest of Asia are at an earlier stage but are adding services quickly from 2026.
Marqstats expects the premium pool to grow more than twentyfold by 2030 as fleets scale from about 10,000 to 315,000 vehicles. The average premium per vehicle falls as insurers accumulate loss data and as risk pools grow, but rising product liability and cyber cover, higher repair costs and tighter European liability rules limit how far premiums fall.
Global Robotaxi Insurance Market Size and Forecast
The global robotaxi insurance market grows from USD 71.40 million in 2025 to USD 1,588.36 million in 2030, a CAGR of 85.97%. The insured fleet grows from about 10,000 vehicles to 315,000, a 99.37% annual rate, and the distance driven by commercial robotaxis rises from about 0.55 billion miles to 21.50 billion. Premium grows more slowly than the fleet because the average annual premium per vehicle falls from about USD 7,140 to USD 5,042, a 6.72% annual decline.
Growth follows fleet expansion closely. The market grew from USD 10.80 million in 2021, when about 1,200 commercial robotaxis were in service, to USD 47.74 million in 2024 and USD 71.40 million in 2025. Marqstats estimates USD 128.52 million in 2026 as the global fleet reaches about 18,500 vehicles, USD 242.90 million in 2027, USD 478.92 million in 2028 and USD 905.60 million in 2029, before reaching USD 1,588.36 million in 2030.
Several factors push the average premium down. Each year of driverless operation adds loss data that lets insurers price risk more precisely, large fleets spread fixed underwriting and claims costs over more vehicles, and sensor and computer costs fall, which reduces the cost of repairing damaged vehicles. Marqstats estimates that premium per mile driven falls by about 43% between 2025 and 2030, from about USD 0.13 to USD 0.07, as fleets log more driverless miles and claims data mature.
Other factors hold premiums up. New product liability rules in Europe make software developers and component makers more directly liable, increasing demand for ADS product liability cover. US juries tend to judge machine failures harshly, which keeps the cost of large losses high. And cyber and software cover grow with every new connected vehicle. As a result, the premium per vehicle falls gradually rather than collapsing in line with crash frequency.
The market remains small compared with conventional motor insurance through 2030. Even at USD 1,588.36 million, robotaxi insurance would be less than 5% of the premium paid today to insure human-driven taxis and ride-hailing vehicles. The importance of the market lies less in its size than in what it shows about the future of motor insurance as automation spreads: liability moves from drivers to manufacturers and software developers, and insurers must develop new skills to follow it.
Market Dynamics
Key Drivers
Five forces are expanding the premium pool for driverless passenger fleets.
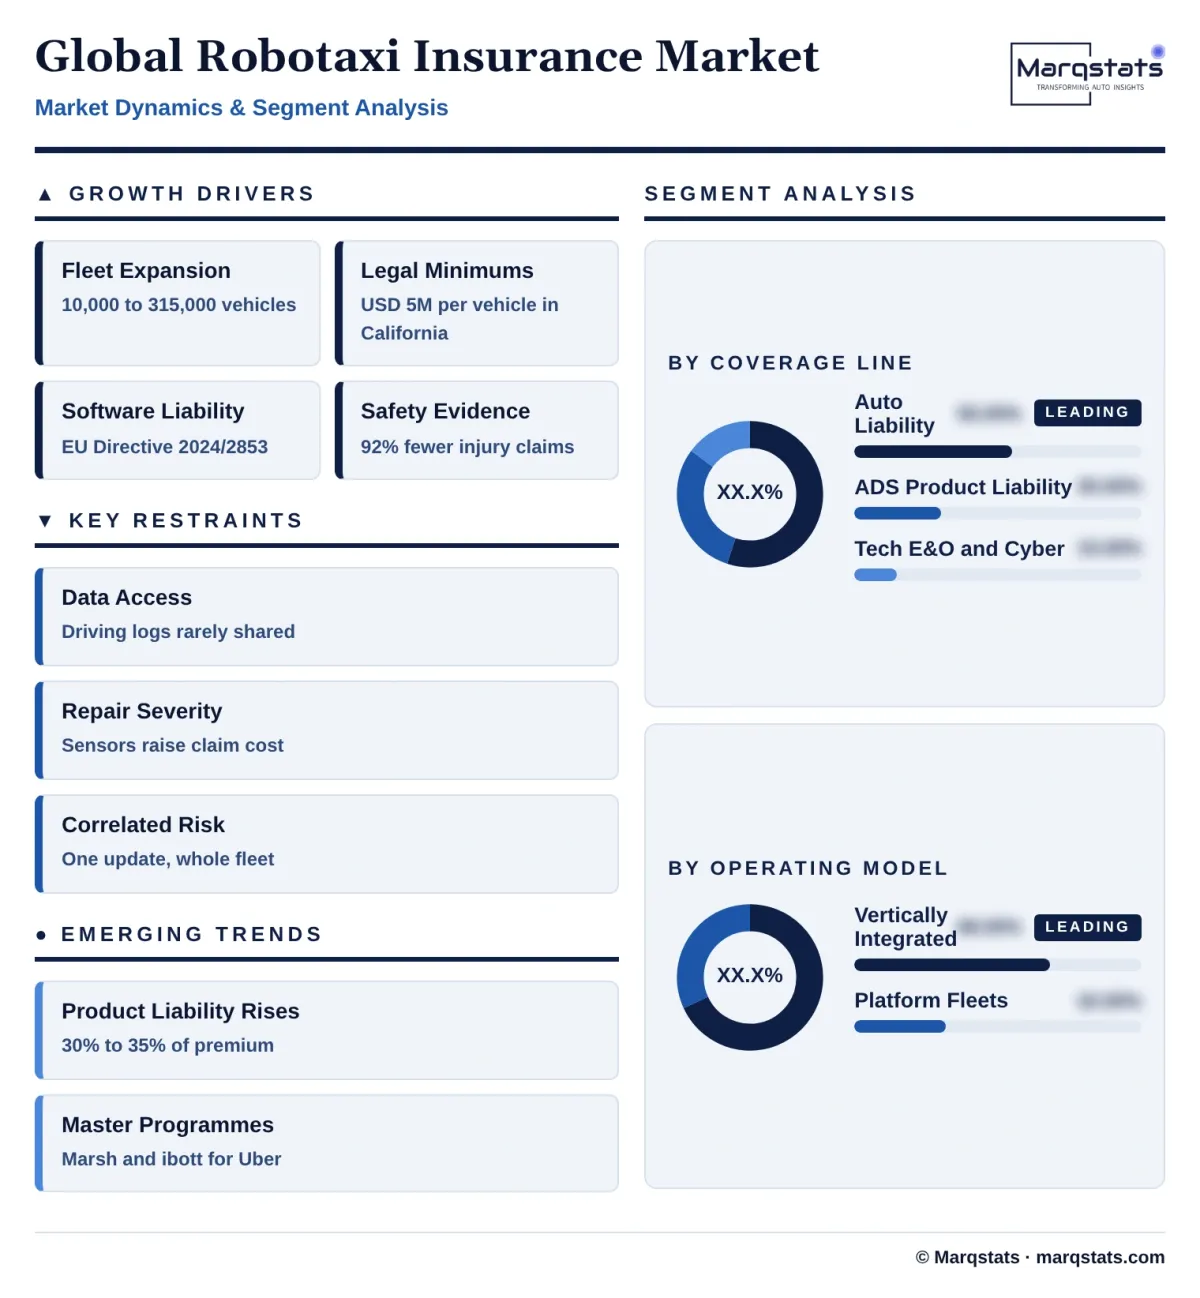
- Fleet expansion drives premium growth. Waymo operates about 4,000 vehicles in US cities and provides more than 500,000 paid rides a week, Baidu Apollo Go, Pony.ai and WeRide are adding thousands of vehicles in China, and services are opening in the Middle East and Europe. Every new commercial vehicle needs legally required cover, so the insured fleet grows from about 10,000 to 315,000 vehicles by 2030.
- Legal minimums create guaranteed demand. California requires robotaxi operators to show at least USD 5 million of financial responsibility per vehicle, Florida treats the automated driving system as the legal operator and requires continuous commercial cover, and Chinese cities require RMB 5 million to RMB 10 million of liability cover per vehicle. These rules mean every commercial fleet must buy, front or self-insure a substantial amount of cover.
- New liability laws shift risk to software makers. The revised EU Product Liability Directive, Directive (EU) 2024/2853, treats software and over-the-air updates as products subject to strict liability and must be applied by EU member states by 9 December 2026. The UK Automated and Electric Vehicles Act 2018 lets motor insurers recover their costs from the company responsible for the self-driving system. Both increase demand for ADS product liability cover.
- Safety data make robotaxi risk insurable. The Waymo and Swiss Re study, which found 88% fewer property damage claims and 92% fewer bodily injury claims than human drivers, gave insurers evidence that driverless vehicles can be safer than human drivers. This has encouraged major insurers and reinsurers to offer capacity, and allowed operators such as Pony.ai to report lower premiums from low accident rates.
- Platforms need standard insurance for many partners. Uber and other ride-hailing platforms dispatch vehicles from several technology companies and fleet owners, each with different risks. Dedicated programmes such as the Marsh and Apollo ibott facility for Uber let new partners join the network quickly with consistent cover, supporting faster fleet growth and creating a new source of premium.
Key Restraints
Four constraints make robotaxi risk hard to price and slow to place.
- Limited data access makes software risk hard to price. Robotaxi operators collect large amounts of sensor and driving data, but trade-secret protections often limit what insurers can see, including disengagement logs and details of how the driving system perceives the road. Without standard data-sharing rules, only a few insurers and reinsurers with direct data agreements can underwrite the risk with confidence.
- Repair costs offset some of the safety gains. Robotaxis carry lidar, radar, cameras and computers built into bumpers, body panels and roofs. A minor collision that would cause only cosmetic damage to a normal car can damage sensors and require expensive recalibration, so the average cost of each property damage claim is much higher than for a conventional vehicle.
- US court awards create large loss risk. Robotaxi claims in the United States are settled through tort law, and juries tend to be less sympathetic to automated systems than to human drivers. This encourages claimants to pursue product liability and punitive damages, pushes operators to settle claims to protect their permits, and keeps the cost of excess and umbrella cover high.
- Correlated losses challenge traditional insurance models. Conventional motor insurance assumes that crashes are independent events. In a robotaxi fleet, thousands of vehicles run the same software, so a faulty update, mapping error or cyberattack could cause many claims at once. Insurers must limit this exposure through sub-limits, exclusions and specialist reinsurance, which reduces the capacity available.
Key Trends
Four shifts are changing how robotaxi risk is structured, priced and shared.
- Liability is moving from motor cover to product cover. Commercial auto liability makes up about 85% of premium for human-driven ride-hailing fleets but only 55.00% for robotaxi fleets in 2025, falling to 50.00% by 2030. ADS product liability rises from 5% of premium for conventional fleets to 30.00% for robotaxis in 2025 and 35.00% in 2030, as laws make software developers responsible when their systems fail.
- Master programmes are replacing separate policies. Instead of each carmaker, software developer and fleet owner buying separate cover and arguing over who pays after a crash, platforms are adopting single master policies that cover everyone in the chain, with internal arrangements to settle who is responsible. The Marsh and Apollo ibott facility for Uber, launched in March 2026, is the leading example.
- Large operators are using captives. Waymo and other well-funded operators use their own captive insurance companies to absorb frequent small losses, buying commercial insurance mainly to meet legal minimums and to cover catastrophic events. Commercial insurers act as fronting carriers that issue the legally required policies and pass most of the risk back to the captive or on to reinsurers.
- Insurers are partnering directly with operators. Swiss Re works with Waymo on safety and risk research, Allianz Partners agreed a European insurance partnership with Waymo in September 2026, and Chinese insurers such as Ping An and PICC underwrite municipal robotaxi pilots. These partnerships give insurers access to driving data and give operators claims-handling capacity in new markets.
Strategic Implications
- For robotaxi operators, insurance design is part of the business plan. Captive structures let operators keep the savings from low crash rates, while master programmes reduce disputes with partners after crashes and help protect operating permits. Operators that share data with insurers can negotiate lower premiums and better terms.
- For ride-hailing platforms, insurance is a tool to attract partners. Offering a ready-made insurance programme makes it easier for technology companies and fleet owners to join a platform, and gives the platform control over claims handling and customer experience across many vehicle types.
- For insurers, new skills are needed. Carriers must assess driving systems, sensor redundancy and operating domains rather than drivers, and their claims teams must analyse sensor and event data recorder feeds to recover costs from software developers and carmakers under laws such as the UK Automated Vehicles Act 2024 and the revised EU Product Liability Directive.
- For reinsurers, fleet-wide software risk needs its own terms. Treaties that separate ordinary independent crashes from correlated software, mapping or cyber failures, with distinct sub-limits and regular checks that vehicles stay within their approved operating areas, can provide the capacity needed for large fleets while controlling accumulated exposure.
- For carmakers and technology developers, product liability becomes a material cost. As liability moves to the companies that design and build the driving system, they need product liability cover sized for fleet-wide exposure, careful records of software validation and update history, and contracts that define how losses are shared with fleet operators and platforms.
Market Segmentation
Commercial auto liability covers third-party injury and property damage caused by the vehicle, and is the cover required by law in every market. It is the largest line, with 55.00% of 2025 premium, USD 39.27 million, rising to USD 794.18 million by 2030, an 82.46% CAGR. Its share falls to 50.00% as safety data reduce crash frequency and as more of the liability for system failures moves to product cover. It remains the main line for fronting carriers that issue the legally required policies for captive-backed fleets.
ADS product liability covers losses caused by failures of the automated driving system, including perception and localisation errors, blocked sensors and computer faults. It accounts for 30.00% of 2025 premium, USD 21.42 million, and is the fastest-growing line, reaching USD 555.93 million and 35.00% of premium by 2030, a 91.80% CAGR. Growth is driven by the revised EU Product Liability Directive, which treats software as a product, and by UK rules that let motor insurers recover costs from the company responsible for the self-driving system.
Technology errors and omissions and cyber cover protect against software defects, faulty over-the-air updates, network intrusions, GPS spoofing and remote operations failures. The line accounts for 15.00% of 2025 premium, USD 10.71 million, rising to USD 238.25 million by 2030, an 85.97% CAGR. Its share stays at 15.00% because growth in connected fleets is matched by tighter sub-limits for fleet-wide software events. Specialist reinsurers such as Munich Re provide much of the capacity for this line.
Vertically integrated fleets are owned and operated by the company that develops the driving system, such as Waymo in the United States and Baidu Apollo Go in China. They account for 68.00% of 2025 premium, USD 48.55 million, rising to USD 921.25 million by 2030, an 80.15% CAGR, while their share falls to 58.00%. These operators often use captives and large self-insured retentions, so much of their premium is fronting fees and funded captive allocations rather than risk passed to the open market.
Third-party platform fleets are vehicles from technology companies or fleet owners dispatched through ride-hailing platforms such as Uber. They account for 32.00% of 2025 premium, USD 22.85 million, and are the fastest-growing model, reaching USD 667.11 million and 42.00% of premium by 2030, a 96.36% CAGR. Several parties share the risk in each vehicle, which makes master programmes such as the Marsh and Apollo ibott facility for Uber attractive and means more premium is placed with commercial insurers.
By Geography
North America
North America is the largest market, with an estimated 62.00% of 2025 premium, USD 44.27 million, rising to USD 825.95 million by 2030, a 79.54% CAGR, while its share falls to 52.00%. Waymo operates in more than ten US metropolitan areas, Tesla, Zoox and others are expanding services, and California and other states require high levels of financial responsibility. US tort law and the risk of large jury awards keep the premium per vehicle higher than anywhere else, and the federal safety regulator requires operators to report serious crashes within 24 hours. Uber's dedicated autonomous insurance facility and the Skyward Specialty acquisition of Apollo, completed in January 2026 for USD 555 million, are expanding commercial capacity in the region.
Asia-Pacific
Asia-Pacific accounts for an estimated 33.00% of 2025 premium, USD 23.56 million, rising to USD 524.16 million by 2030, an 85.98% CAGR, and keeping a 33.00% share. China has the largest robotaxi fleet in the world, with Baidu Apollo Go, Pony.ai and WeRide operating in Wuhan, Beijing, Shenzhen, Guangzhou and other cities. Municipal pilots require RMB 5 million to RMB 10 million of liability cover per vehicle, and insurers such as Ping An and PICC write standardised policies, so premium per vehicle is lower than in the United States. Pony.ai has reported lower insurance premiums because of its low accident rates. South Korea set up a task force in April 2026 to define how liability is shared between carmakers, software developers and platforms after autonomous vehicle crashes.
Europe
Europe accounts for an estimated 5.00% of 2025 premium, USD 3.57 million, but is the fastest-growing region, reaching USD 238.25 million and 15.00% of premium by 2030, a 131.67% CAGR. Commercial service began in Zagreb in 2026, trials are under way in London and Madrid, and Waymo plans to launch in Munich. The UK Automated Vehicles Act 2024 and the Automated and Electric Vehicles Act 2018 require motor insurers to pay victims directly and allow them to recover costs from the company responsible for the self-driving system, while the revised EU Product Liability Directive makes software developers strictly liable. Allianz Partners agreed a strategic insurance partnership with Waymo in September 2026 to support its European rollout.
Rest of the World
The Middle East and other regions account for a very small share of premium in 2025 and are included in the regional totals above where vehicles are insured through global programmes. Robotaxi services are growing quickly in the United Arab Emirates and Saudi Arabia, with WeRide, Baidu Apollo Go, Pony.ai and Uber operating or testing in Abu Dhabi, Dubai and Riyadh. As these services move to full commercial operation, local insurers and global carriers are developing cover that meets national motor insurance laws, creating a further source of growth after 2027.
How Competition Is Evolving
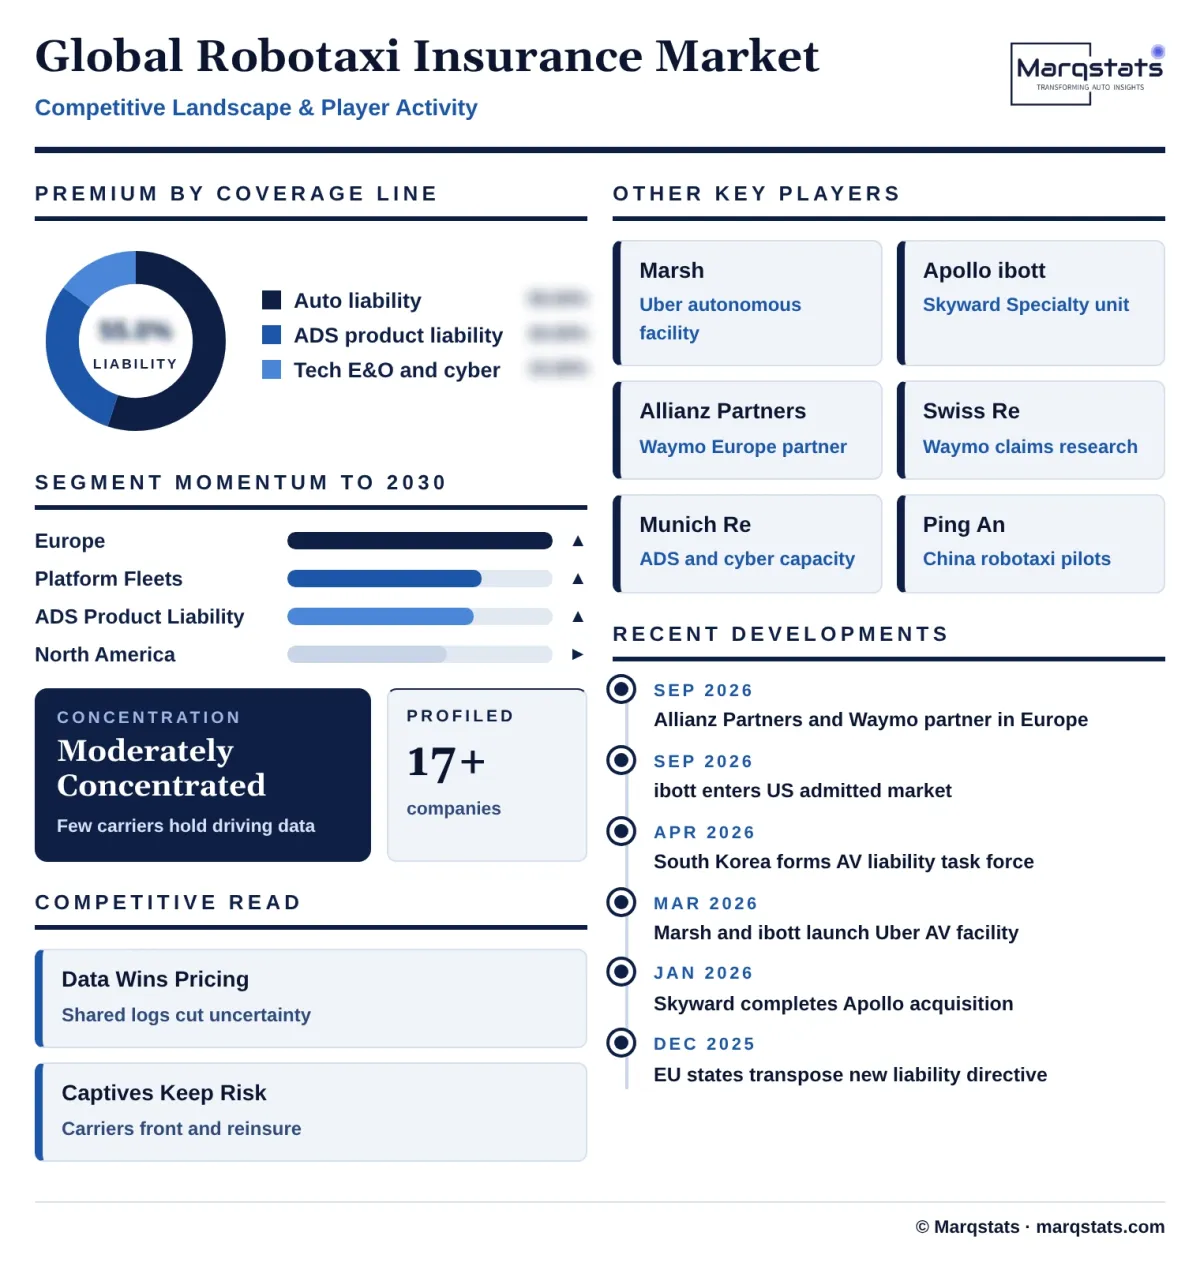
The robotaxi insurance market is concentrated among a small group of global brokers, specialist underwriters and reinsurers that have access to operator driving data. Marsh structured the dedicated facility for Uber's autonomous partners with Apollo's ibott, Swiss Re partnered with Waymo on safety research and risk modelling, Allianz Partners agreed a European partnership with Waymo, and Munich Re provides specialist capacity for automated driving and cyber risks. In China, Ping An and PICC underwrite most municipal robotaxi pilots.
Three roles define the market. Brokers such as Marsh design programmes and place risk across many carriers. Specialist underwriters such as Apollo's ibott, now part of Skyward Specialty, and insurtechs such as INSHUR write cover for shared and autonomous mobility risks. Large multi-line insurers and reinsurers such as Allianz, Swiss Re and Munich Re provide fronting, primary capacity and reinsurance for catastrophic losses. The largest operators, led by Waymo, keep much of the risk through captives.
Access to data is the main source of advantage. Insurers that can analyse driving logs, disengagement data and event data recorder feeds can price robotaxi risk more accurately and handle claims faster, and the partnerships between Swiss Re and Waymo and between Allianz Partners and Waymo are designed around shared data. Insurers without this access depend on standard pricing and are mostly limited to excess layers.
Competition will increase as fleets grow and loss data become more widely available. Marqstats expects more multi-line insurers to enter the market from 2028 as fleets pass 75,000 vehicles and as standard data-sharing and liability rules develop in Europe and the United States. Carriers that build engineering-based underwriting and digital claims capabilities early will be best placed to win the growing platform fleet segment.
Companies Covered
Companies covered in the report include:
Recent Market Activity
Table of Contents
Coverage & Segmentation
The study covers the global robotaxi insurance market, with 2025 as the base year, 2021 – 2025 as the historical period and 2026 – 2030 as the forecast period. Values are in US dollars at fixed 2025 exchange rates. The market is defined as direct written premium, fronting fees and funded captive allocations for commercial SAE Level 4 passenger fleets operated without a human driver, across commercial auto liability, ADS product liability and technology errors and omissions and cyber cover. It is segmented by coverage line, operating model and region.
Personal motor insurance for private cars with Level 1 to Level 3 driver assistance, autonomous freight trucking, off-road and industrial automation, and physical damage cover for the vehicle itself are excluded. Fleet counts, premium per vehicle, coverage line and operating model splits and regional shares are Marqstats estimates built on regulatory filings, operator disclosures, insurer and broker announcements and published safety studies.