Market Snapshot
Key Takeaways
Market Overview & Analysis
Report Summary
The UAE autonomous fleet operations market comprises autonomous vehicles operated as managed commercial fleets across the Emirates, encompassing fleet ownership and financing, depot and hub operations, dispatch and orchestration, and the maintenance, cleaning and charging that keep vehicles in continuous service. It spans robotaxi, autonomous mobility and selected autonomous logistics applications. Test vehicles not operated under a fleet-management model are excluded, as is autonomous driving technology revenue that is not fleet operations. Market size is measured as vehicles under managed operation, with annual fleet operations revenue reported alongside. On this basis the market stood at 125 vehicles and USD 3.00 million in 2025.
Managed Autonomous Fleet Size and Operations Forecast
Vehicles under managed autonomous fleet operation rise from 125 in 2025 to 3,623 by 2030, a 96.08% compound annual growth rate, reaching 7,000 vehicles by 2031. The 2025 base is the commercially managed subset of the wider autonomous vehicle population, and the 2026 figure captures the shift to driverless paid operations in Dubai together with Abu Dhabi's permitted commercial networks. Later years add autonomous logistics fleets alongside continued robotaxi expansion.
One methodological point separates this market from every vehicle market in the same programme, and it inverts the usual warning. Fleet operations revenue is recurring against the operating fleet, so market value is correctly calculated as vehicles under management multiplied by annual operating cost per vehicle — a stock multiplied by a rate. In a vehicle sales or infrastructure market that calculation would be an error, because those markets are flows of new units and multiplying the installed base by price overstates them. Here the service is delivered to every vehicle every year, and the installed base is precisely the right denominator.
Per-vehicle operating cost falls from USD 24,000 to USD 16,500 a year, a 7.22% annual decline, which is why revenue compounds at 81.92% against a 96.08% fleet growth rate. The decline is driven by depot automation rather than by price competition. Robotics-first facilities in which charging, cleaning, servicing and inspection are performed without manual intervention change the labour content of fleet operations fundamentally, and an operator running fifteen such depots amortises orchestration software and remote support across a far larger fleet than one running conventional workshops.
Three boundaries define the market. Autonomous driving technology revenue is excluded — licence fees, software subscriptions and per-kilometre autonomy charges belong to the technology providers rather than to fleet operations. Test and validation vehicles outside a commercial fleet-operating model are excluded, since a vehicle accumulating permit distance is not being operated as a fleet asset. Passenger fare revenue is excluded and belongs to the mobility service, not to the operating layer; this market measures what it costs and earns to keep those vehicles running, not what riders pay.
The relationship to the UAE robotaxi market is an overlap on a different cut of the same population, and the two must not be summed. That study counts vehicles by type — robotaxis, including those in public-road testing outside a fleet-operating model. This one counts vehicles by operating model — any autonomous vehicle under managed commercial fleet operation, including selected logistics vehicles that are not robotaxis. The 2025 figures of 125 and 120 vehicles describe heavily overlapping populations measured on different axes, in the same way that a count of sport-utility vehicles and a count of leased vehicles overlap without either containing the other.
Market Dynamics
Key Drivers
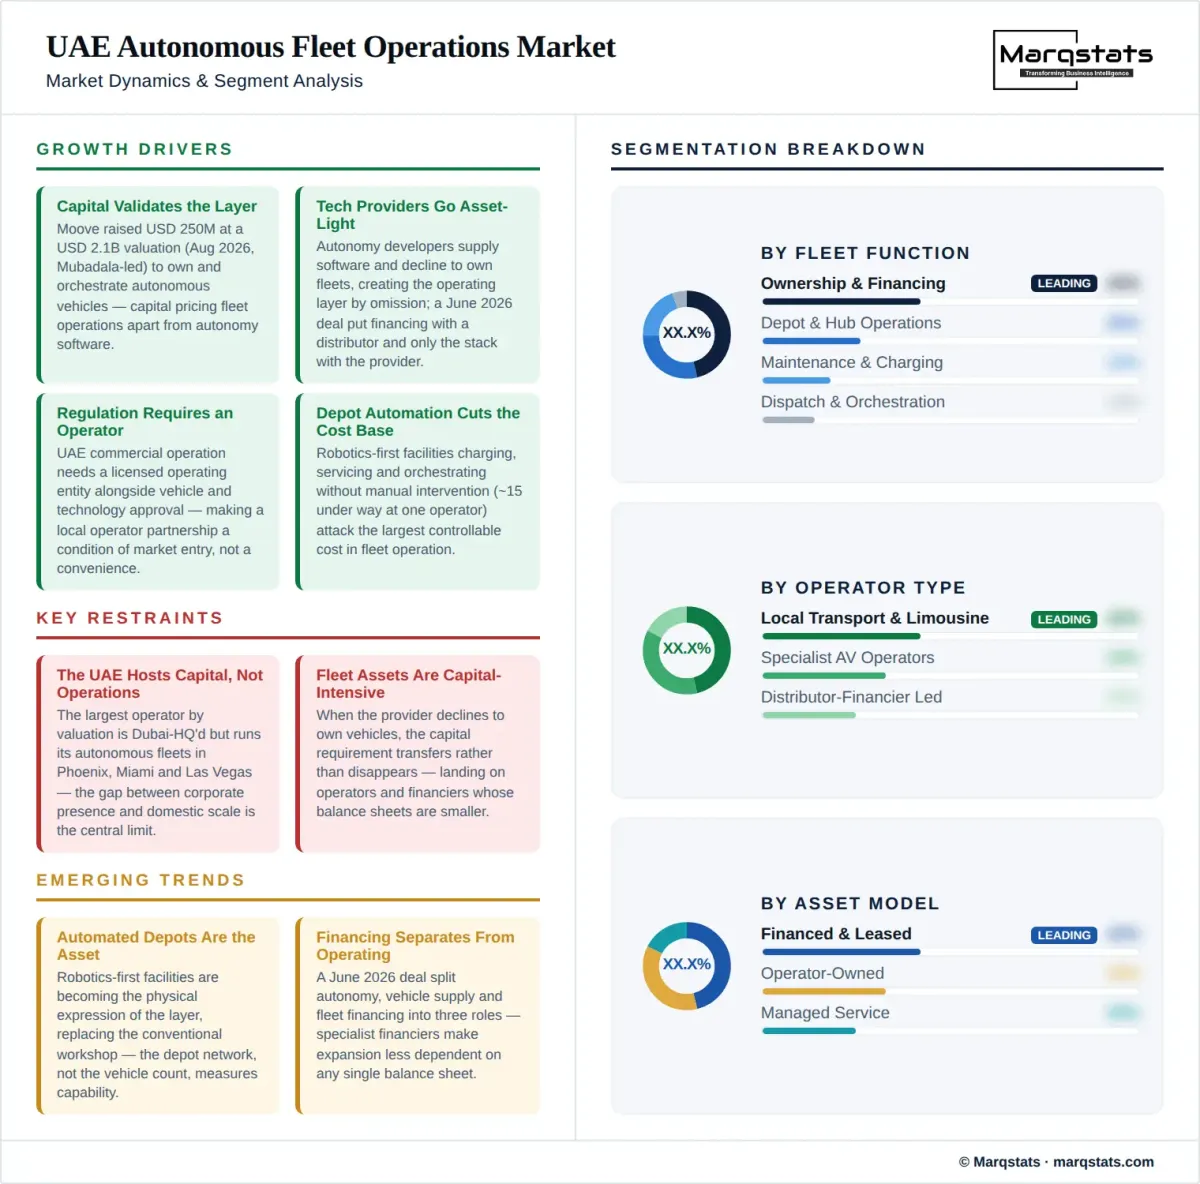
- Capital validating the operating layer as an asset class. A Dubai-headquartered autonomous mobility operator raised USD 250 million in August 2026 at a USD 2.1 billion valuation, in a round led by Mubadala Investment Company with Woven Capital and Ion Pacific as co-leads, explicitly to own, operate and orchestrate autonomous vehicles. Institutional capital pricing fleet operations separately from autonomy software is the clearest signal that the layer is investable in its own right.
- Technology providers choosing asset-light models. Autonomous driving developers increasingly supply software and vehicle operating systems while declining to own fleets, which creates the operating layer by omission. Deployments in both emirates place vehicles with local transport companies rather than with the autonomy provider, and a June 2026 arrangement placed vehicle financing with a distributor while the autonomy provider supplied only the driving stack. Every asset-light decision upstream creates demand downstream.
- Regulation that requires an operating entity, not only a technology approval. Autonomous commercial operation in the UAE requires both vehicle and technology approval and a licensed operating entity, which makes a local operator partnership a condition of market entry rather than a commercial convenience. Abu Dhabi's oversight platform embeds real-time tracking, incident reporting and operational control, so fleet software must integrate with regulatory reporting as a licensing requirement.
- Depot automation changing the cost structure. Robotics-first facilities where vehicles are charged, serviced, maintained and orchestrated without manual intervention are moving from concept into development, with roughly fifteen under way at one operator. Automating the depot attacks the largest controllable cost in autonomous fleet operation and is the principal reason per-vehicle annual operating cost falls across the forecast.
- High utilisation making operations quality a commercial variable. Autonomous fleets are designed for continuous operation rather than for the duty cycle of a driven vehicle, which raises the cost of downtime, charging time and maintenance delay. Trips per vehicle per day, paid utilisation, downtime and hub productivity become the operating metrics that determine returns, and an operator that improves them earns more from the same asset base.
Key Restraints
- The UAE hosts the capital more than the operations. The largest fleet operator by valuation is headquartered in Dubai but runs its autonomous fleets in Phoenix, Miami and Las Vegas, with a London expansion planned. Its approximately 42,000 managed vehicles are predominantly human-driven ride-hailing assets across other markets. The gap between corporate presence and domestic operating scale is the central limitation on the UAE market as measured here.
- Fleet assets are capital intensive even under asset-light software models. When the technology provider declines to own vehicles, the capital requirement transfers rather than disappears, and it lands on operators and financiers whose balance sheets are smaller than the software companies'. Financing structure therefore determines how fast fleets can scale, and debt capacity rather than vehicle availability may prove the binding constraint.
- No published unit economics for autonomous fleet operation. The relationship between per-vehicle operating cost, utilisation, depot productivity and revenue is not publicly established in any market, let alone in the UAE. Per-vehicle operating cost is therefore constructed rather than observed, and confidence is medium rather than high for that reason.
- Operating scale still measured in tens of vehicles at individual sites. Abu Dhabi's Yas Island expansion in March 2026 deployed five driverless taxis initially with free rides for one month. Individual deployments at that scale do not yet amortise a dedicated depot, orchestration platform or remote support team, which means early fleet operations run below the scale at which their own economics work.
Key Trends
- Automated depots emerging as the defining asset of the layer. Robotics-first facilities designed for continuous operation are becoming the physical expression of fleet operations, replacing the conventional workshop and yard. They combine charging, cleaning, servicing and inspection under automation, and an operator's depot network rather than its vehicle count is increasingly the measure of its capability.
- Financing separating from operating. A June 2026 collaboration placed autonomous software with one party, vehicle supply with a Chinese electric vehicle manufacturer and fleet financing with a regional distributor, splitting what was previously a single role into three. Specialist financiers entering between the vehicle and the operator is a structural development that makes fleet expansion less dependent on any single balance sheet.
- Phased geographic expansion within emirates rather than across them. Abu Dhabi's rollout moved from Yas Island with later phases planned for Al Reem, Al Maryah and Saadiyat, expanding island by island under emirate supervision. Fleet operations scale by adding permitted territory in defined steps, so operators build depot and support capacity against a known expansion sequence rather than against open-ended growth.
- Mixed fleets bridging the transition. Operators managing both human-driven and autonomous vehicles in the same organisation can amortise depot, dispatch and maintenance capability across a larger base while autonomous volumes remain small. This transitional structure is how most current participants reached the market, and it is a material advantage over pure-play autonomous operators during the early forecast years.
Market Segmentation
Fleet ownership and financing covers the capital layer — acquiring vehicles, structuring debt against them and carrying residual risk on assets with no established resale market. It accounts for the largest share of value across the forecast because it absorbs the capital that technology providers decline to commit, and it is the function most likely to attract specialist entrants with balance sheet capacity rather than operating expertise.
Depot and hub operations covers the physical facilities where vehicles are charged, cleaned, serviced and staged between assignments. It is the fastest-growing function as robotics-first automated facilities replace conventional workshops, and it is where the decline in per-vehicle operating cost originates. An operator's depot network increasingly defines its capability more than its vehicle count does.
Dispatch and orchestration covers the software and operations centres that assign vehicles to demand, schedule charging and servicing around it, and integrate with regulatory reporting requirements. Value per vehicle is modest relative to physical operations but the function is centralising, so one platform can serve many depots and its cost falls fastest with scale.
Maintenance, cleaning and charging covers recurring physical work on each vehicle, and it is the function most exposed to automation. In a driven fleet these tasks are absorbed by the driver or performed at low frequency; in a continuously operating driverless fleet they become scheduled operations with direct revenue consequences, which is why they are the primary target of robotics-first depot design.
Robotaxi and passenger mobility fleets account for the overwhelming majority of managed autonomous vehicles throughout the forecast, reflecting where UAE permits, deployments and platform demand currently sit. Operating requirements are shaped by short dwell, high daily trip counts and passenger-facing cleanliness standards that do not apply to freight.
Autonomous logistics and delivery fleets enter the market later and grow fastest from a small base, as freight and last-mile operators follow passenger mobility into driverless operation. Operating requirements differ materially — longer dwell, heavier maintenance, load handling and different depot geometry — so the function is not simply an extension of robotaxi operations.
Mixed fleets combine human-driven and autonomous vehicles under one operating organisation, which lets an operator amortise depot, dispatch and maintenance capability across a larger base while autonomous volumes remain small. Most current participants reached this market through such a structure, and it remains a material advantage during the early forecast years before pure autonomous scale is achievable.
Specialist operators are built specifically to own and orchestrate autonomous vehicles, with automated depots, financing capability and orchestration software as their core product rather than as support functions. They command the highest valuations in the layer and pursue scale across multiple markets and autonomy partners simultaneously, which gives them purchasing and amortisation advantages local operators cannot match.
Local transport and limousine companies entered the market by adapting existing fleet operations to driverless vehicles, supplying depot capacity, licensed operating status and regulatory relationships that a foreign technology provider cannot hold directly. They operate driverless vehicles for autonomy providers in both emirates and are the most common operating partner in current UAE deployments.
Distributor-led operations place a vehicle importer or regional distributor at the centre, supplying vehicles, financing and often aftersales capability while licensing autonomy from a technology partner. A June 2026 arrangement in Dubai followed exactly this shape, pairing a regional distributor's financing with a Chinese electric vehicle platform and a third party's autonomous driving stack.
Operator-owned fleets place vehicles on the operator's own balance sheet, giving full control of utilisation and full exposure to residual value on an asset class with no established resale market. It is the model specialist operators are moving toward as debt financing becomes available against autonomous vehicles, and it carries the highest capital requirement of the three.
Financed and leased structures place a financier between the vehicle and the operator, converting a capital requirement into a periodic charge and allowing fleet expansion beyond the operator's own balance sheet. The model grows fastest across the forecast as specialist financiers enter the layer, and it is what makes rapid fleet scaling possible for operators without institutional capital behind them.
Managed service arrangements see the operator run vehicles it does not own, charging a fee per vehicle or per operating hour while the technology provider or a financier holds the asset. It carries the lowest capital requirement and the lowest margin, and it suits operators whose advantage is depot capacity, licensed status and local labour rather than balance sheet.
By Geography
Dubai
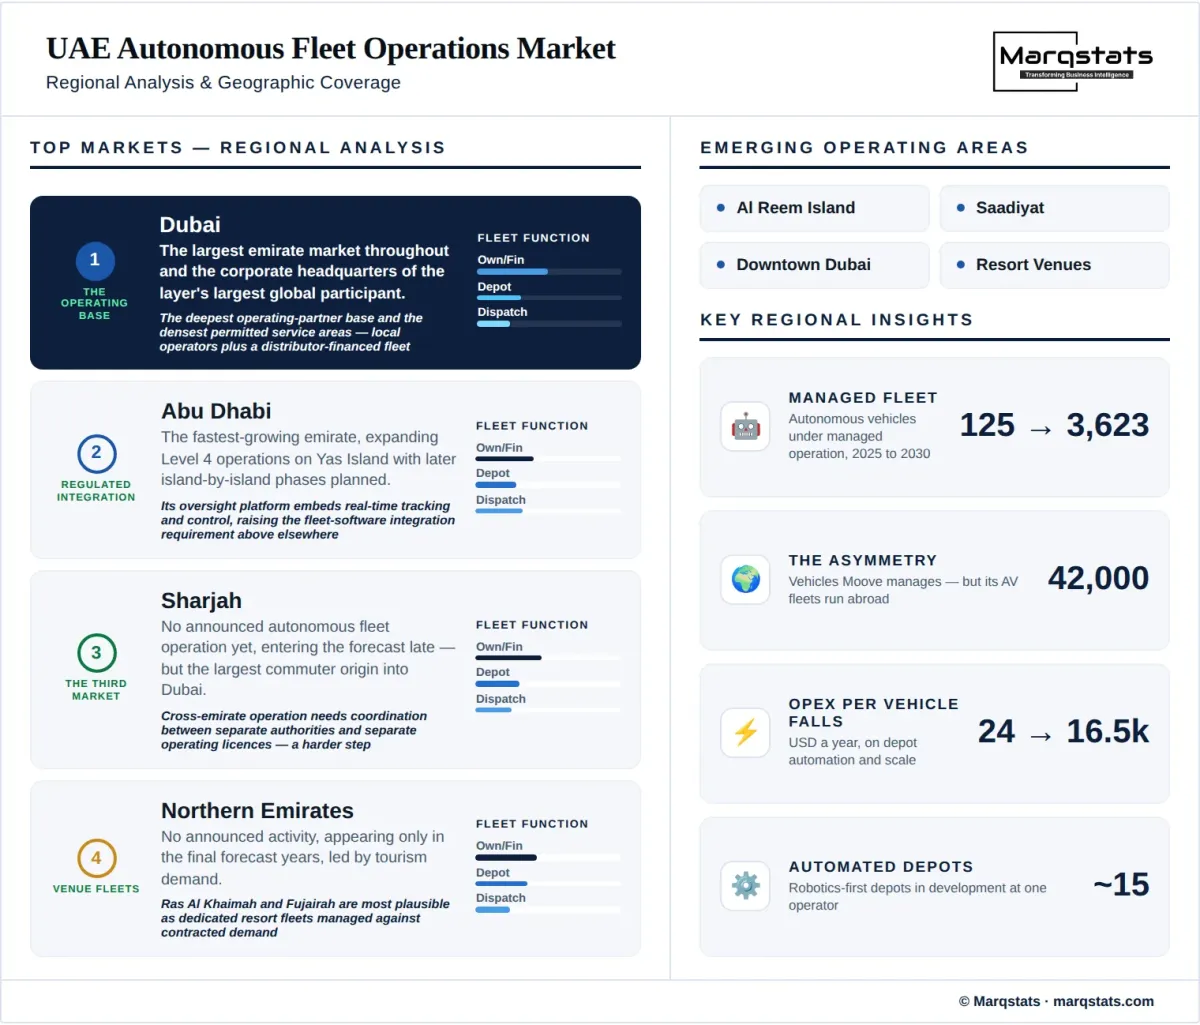
Dubai is the largest emirate market throughout the forecast and the corporate headquarters of the layer's largest global participant. Driverless commercial operations run with a local luxury transport company as fleet operator for one autonomy provider and a separate transport operator for another, and a June 2026 arrangement added a distributor-financed electric fleet. The emirate combines the deepest operating partner base with the densest permitted service areas.
Abu Dhabi
Abu Dhabi is the fastest-growing emirate market, expanding Level 4 commercial operations on Yas Island in March 2026 with five driverless taxis and free rides for one month, with Al Reem, Al Maryah and Saadiyat planned as later phases. Its oversight platform embeds real-time tracking, incident reporting and operational control, which raises the fleet software integration requirement above what operators face elsewhere.
Sharjah
Sharjah carries no announced autonomous fleet operation and enters the forecast late. Its position as the largest commuter origin into Dubai makes it the most plausible third market, but cross-emirate operation requires coordination between separate transport authorities and separate operating licences, which is a materially harder step than extending permitted territory within a single emirate.
Northern Emirates
The Northern Emirates hold no announced activity and appear only in the final forecast years. Tourism-led demand in Ras Al Khaimah and Fujairah provides the most plausible entry case, most likely as dedicated venue or resort fleets where a single operator manages a defined vehicle population against contracted demand rather than open public dispatch.
Rest of the United Arab Emirates
The remaining areas hold a negligible share throughout. Fleet operations economics depend on concentrating enough vehicles within one permitted territory to amortise a depot, an orchestration platform and a remote support team, and that density exists in the two largest emirates and in specific developed districts rather than across the wider federation.
How Competition Is Evolving
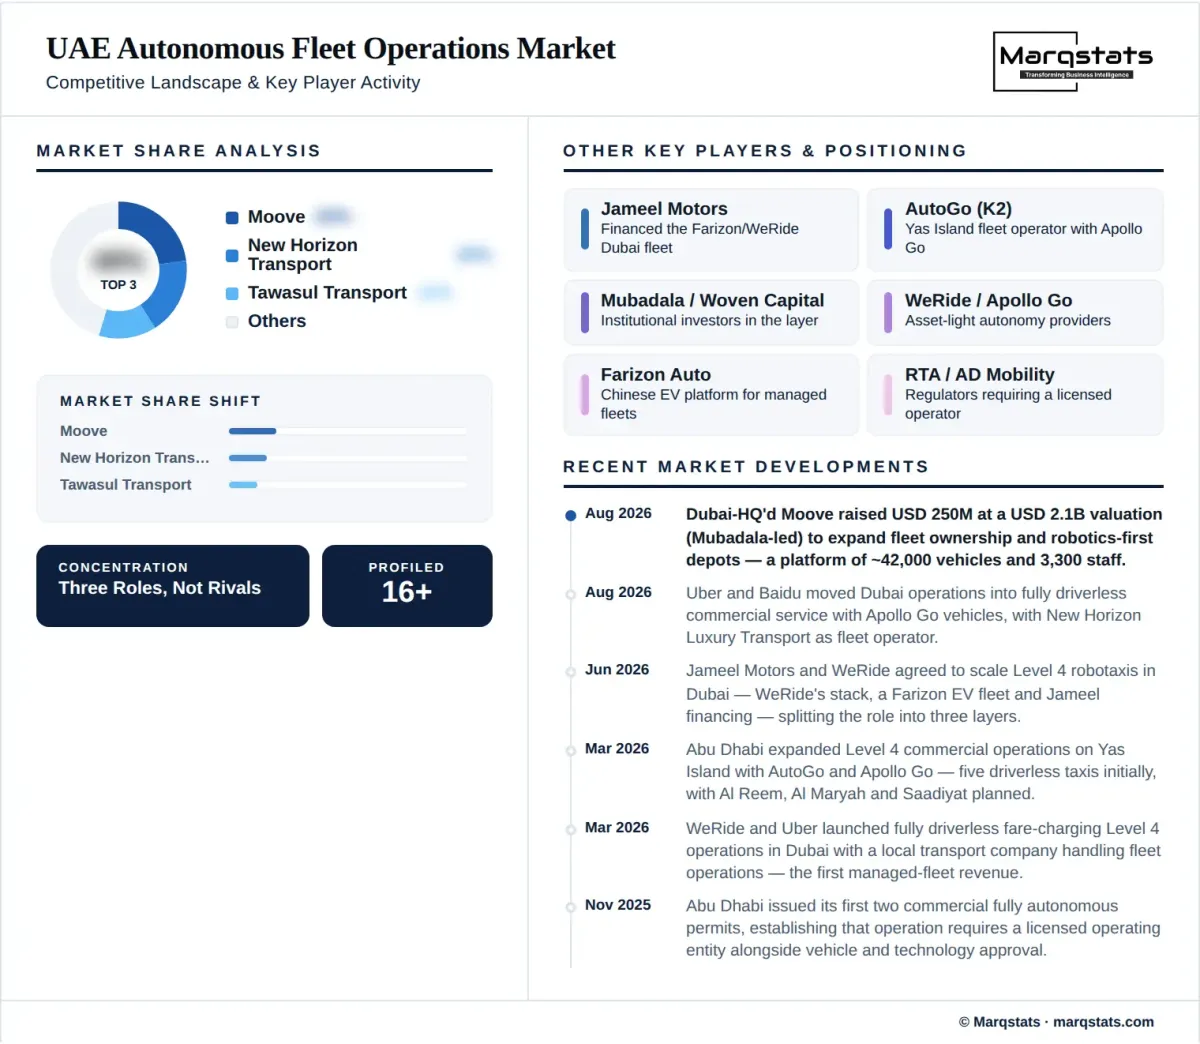
The UAE autonomous fleet operations market is moderately fragmented and structurally distinct from the autonomy technology market above it. Participants divide into three types that rarely compete directly: specialist autonomous fleet operators pursuing scale across multiple countries and autonomy partners, local transport and limousine companies supplying licensed operating status and depot capacity within the Emirates, and vehicle distributors bringing financing and aftersales capability. Each holds a different asset and a different constraint, and current deployments pair rather than pit them against one another.
The most valuable participant in the layer is headquartered in Dubai and operates its autonomous fleets elsewhere. In August 2026 it raised USD 250 million at a USD 2.1 billion valuation led by Mubadala Investment Company with Woven Capital and Ion Pacific co-leading, managing approximately 42,000 vehicles and 3,300 people, with roughly fifteen robotics-first automated depots in development and a stated ambition to own robotaxis at a scale of hundreds of thousands. Its autonomous operations run in Phoenix, Miami and Las Vegas with London planned. That is the defining asymmetry of this market: the UAE supplies the capital, the headquarters and the investor base, while the operating scale that valuation rests on sits in other jurisdictions.
Local operators hold something the global specialists cannot buy, which is why every UAE deployment includes one. Autonomous commercial operation requires a licensed operating entity alongside vehicle and technology approval, and licensed status, depot capacity, regulatory relationships and local labour are held by transport and limousine companies that have run conventional fleets for years. A foreign technology provider cannot hold that status directly, which converts local operating companies from subcontractors into structural gatekeepers on every deployment in both emirates.
Competition is not yet between operators but between operating models, and the resolution will come from financing rather than from service quality. Vehicle ownership, financed leasing and pure managed service each carry different capital requirements, margins and scaling limits, and no participant has demonstrated which produces durable returns on autonomous assets with no established residual value. Merger and acquisition activity has been absent within the Emirates; consolidation is more likely to arrive through capital, as operators able to raise institutional funding at scale acquire the depot networks and operating licences of those that cannot.
Companies Covered
The report profiles 16+ companies with full strategy and financials analysis, including:
Recent Market Activity
Table of Contents
Coverage & Segmentation
This report covers autonomous vehicles operated as managed commercial fleets across the United Arab Emirates, spanning fleet ownership and financing, depot and hub operations, dispatch and orchestration, and maintenance, cleaning and charging, with 2025 as the base year and 2026 – 2030 as the forecast period. Market size is measured as vehicles under managed operation, with annual fleet operations revenue reported in US dollars alongside it. Segmentation covers fleet function, fleet application, operator type and asset model, with emirate-level analysis for Dubai, Abu Dhabi, Sharjah, the Northern Emirates and the rest of the United Arab Emirates.
Three exclusions define the perimeter. Autonomous driving technology revenue is excluded — licence fees, software subscriptions and per-kilometre autonomy charges belong to the technology providers rather than to fleet operations. Test and validation vehicles outside a commercial fleet-operating model are excluded, since a vehicle accumulating permit distance is not being operated as a fleet asset. Passenger fare revenue is excluded and belongs to the mobility service; this market measures the cost and revenue of keeping vehicles running, not what riders pay to ride in them.
The overlap with the UAE robotaxi market is a different cut of a heavily shared population, and the two values must not be summed. That study counts vehicles by type, including robotaxis in public-road testing outside any fleet-operating model. This one counts vehicles by operating model, including selected autonomous logistics vehicles that are not robotaxis. The 2025 figures of 125 and 120 vehicles are close because the populations overlap substantially, in the same way a count of sport-utility vehicles and a count of leased vehicles overlap without either containing the other. Anyone using both studies should treat them as two views of one vehicle population rather than as two markets to be added.
One methodological feature inverts the standard warning applied throughout this programme. Fleet operations revenue is recurring against the operating fleet, so market value is correctly calculated as vehicles under management multiplied by annual operating cost per vehicle — a stock multiplied by a rate. In the vehicle sales and infrastructure markets covered elsewhere in this series that calculation would overstate the market, because those measure flows of new units entering service. Here the service is delivered to every managed vehicle every year, and the installed base is the correct denominator. Confidence is medium: the fleet is derived from disclosed deployments, while per-vehicle operating cost is constructed because no operator publishes autonomous fleet unit economics in any market.