Market Snapshot
Middle bar: base-year value × (1 + CAGR), rounded to two decimals. This is a calculated illustration, not a separately researched annual estimate.
The US tire dealer market is valued at USD 38.82 billion in 2025 and is projected to reach USD 44.99 billion by 2030, registering a CAGR of 2.99% over 2026–2030. The market covers revenue earned by tire dealers from tire sales, installation and the automotive services sold through tire and service centers, as tracked by the Auto Care Association and the Automotive Aftermarket Suppliers Association (AASA). National dealers lead with 52.70% of 2025 revenue, and consolidation accelerated in 2026 as Mavis Tire Express Services Corp. passed 4,400 locations after acquiring Pep Boys.
Market size and forecast figures are generated using Marqstats' proprietary estimation framework, updated as of October 2026.
Coverage spans three dealer types and the five Traffic Volume Trends regions defined by the Federal Highway Administration (FHWA). The analysis benchmarks retail chains such as Bridgestone Retail Operations, LLC and Monro, Inc. and the wholesale distributors that supply them, including American Tire Distributors, Inc., K&M Tire, Inc. and TireHub, LLC. The analysis also splits dealer revenue between passenger and light truck tire customers, with light truck customers growing faster at a 4.35% CAGR.
Key Takeaways
Market Overview & Analysis
Report Summary
The US tire dealer market comprises the revenue of tire dealers from new tire sales, installation, alignment, repair and the general automotive services sold through tire and service centers, valued at USD 38.82 billion in 2025. The Auto Care Association and AASA track the channel at USD 37.264 billion in 2024, and dealer revenue grew 4.16% in 2025. Wholesale distribution revenue, tire sales through general merchandise retailers and vehicle dealerships, and manufacturer revenue sit outside the market perimeter, so the market measures the final retail value earned by tire dealers rather than the value of the tire alone. The channel grew from USD 30.161 billion in 2021, and the 2025 base year reflects four consecutive years of growth driven by tire price increases and service expansion.
Demand is driven by replacement tire volumes, vehicle age and the service attached to each tire purchase. Tire dealers receive 77% of passenger and 92% of light truck replacement shipments, an estimated 207.27 million tires in 2025, from a national pool of 221.9 million passenger and 37.7 million light truck replacement tires reported by the US Tire Manufacturers Association (USTMA). The vehicle parc of 298.561 million units in 2025 supplies the service work that dealers attach to tire sales, from alignment to brake and oil service. National dealers alone receive an estimated 109.24 million of these tires, local dealers 52.39 million and regional dealers 45.64 million. Light truck customers account for 16.73% of dealer tire units and an estimated 22.47% of dealer revenue, as larger fitments carry higher value per tire.
Replacement volumes and tariffs set the frame for 2026–2030. The USTMA July 2026 forecast projects passenger and light truck replacement shipments to fall 1.6% each in 2026, and dealer revenue eases to an estimated USD 38.73 billion in 2026 before growth resumes in 2027. The 25% Section 232 duty on imported tires from 3 May 2025 raises shelf prices, and the US Bureau of Labor Statistics (BLS) Producer Price Index for passenger car pneumatic tires averaged 202.94 in January to June 2026, 2.57% above its 2025 average. Dealer revenue recovers to USD 40.20 billion in 2027 and reaches USD 44.99 billion in 2030, as price growth and the light truck mix outweigh flat passenger volumes.
Supply is consolidating at both the retail and wholesale levels. Mavis Tire Express Services Corp. completed its USD 700 million purchase of Pep Boys in August 2026, Big Brand Tire & Service agreed to acquire Belle Tire in July 2026, and Bridgestone Retail Operations, LLC operates more than 2,200 centers, including over 1,800 Firestone Complete Auto Care stores. The tire value behind dealer revenue is covered in the Marqstats US Replacement Tire Market analysis.
Market Dynamics
Key Drivers
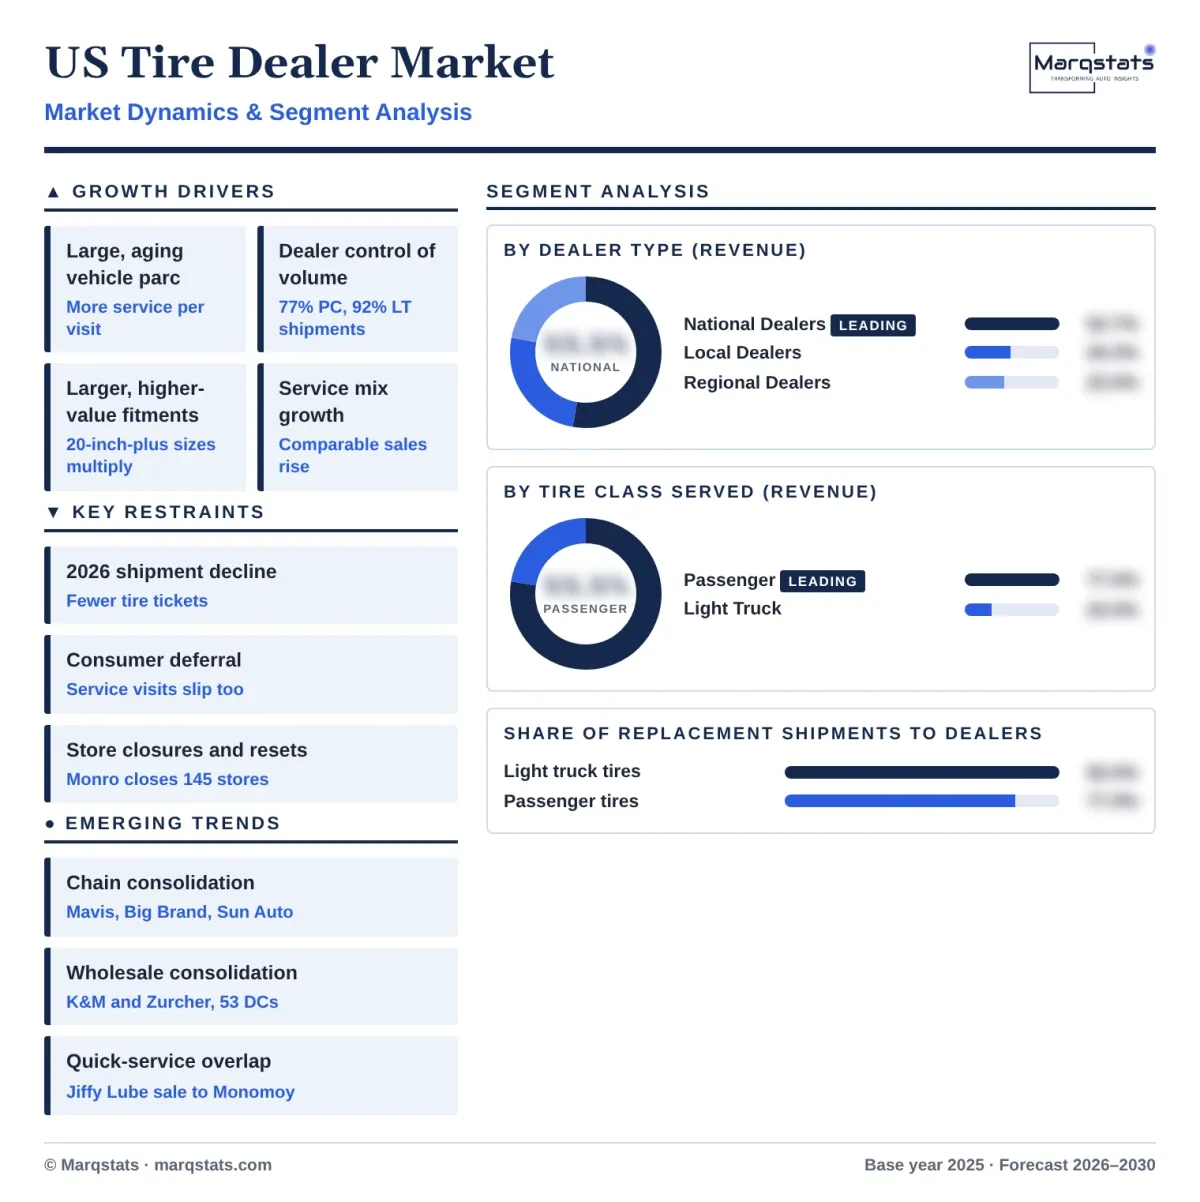
Five conditions sustain tire dealer revenue across the 2026–2030 forecast period.
- Large and aging vehicle parc. The US vehicle parc reached 298.561 million units in 2025, including 189.616 million light trucks, which sets the base for tire replacement and the service work dealers attach to it. Older vehicles need more alignment, suspension and brake work, which raises revenue per visit as the parc ages. Average replacement value per passenger tire reaches an estimated USD 196.41 by 2030, up from USD 172.56 in 2025, which lifts dealer revenue per tire sold.
- Dealer control of replacement volume. Tire dealers receive 77% of passenger and 92% of light truck replacement shipments in 2025, against 11% of passenger shipments for general merchandise retailers. Dealers therefore capture an estimated 207.27 million of the 259.6 million light-vehicle replacement tires shipped in 2025, along with the installation and service revenue that follows. General merchandise retailers take only 2% of light truck shipments, which leaves pickup and SUV owners almost entirely to dealers.
- Larger and higher-value fitments. Recognized passenger tire dimensions rose from 394 in 2025 to 411 in 2026, including 82 sizes of 20 inches and above. Large-rim fitments raise the installation and balancing work per tire and the value of each customer ticket. Light truck customers generate an estimated 22.47% of dealer revenue in 2025 from 16.73% of dealer tire units.
- Price increases on tires. The 25% Section 232 duty on imported tires from May 2025 and producer price increases lift tire shelf prices, with the BLS Producer Price Index for tires averaging 195.76 in January to August 2026, 2.20% above the 2025 average. Higher tire prices raise dealer revenue even when unit volumes ease. Dealer revenue rises to an estimated USD 40.20 billion in 2027 and USD 41.74 billion in 2028 as price growth outpaces volume.
- Service mix growth. Monro, Inc. grew comparable-store sales 1.4% in fiscal 2026 while closing 145 stores, showing that service-led revenue per store can rise when tire units are flat. Dealers add brake, oil and alignment work to each tire sale to lift revenue per customer visit. Firestone Complete Auto Care stores employ more than 9,500 technicians, reflecting the labor content of service-led dealer revenue.
Key Restraints
Four constraints limit dealer revenue growth through 2030.
- Replacement shipment decline in 2026. The USTMA July 2026 forecast projects passenger replacement shipments of 218.3 million and light truck shipments of 37.1 million units in 2026, each down 1.6%. Dealer revenue eases to an estimated USD 38.73 billion in 2026, as lower tire volumes offset higher prices and service growth. The 2026 decline removes an estimated 4.2 million light-vehicle replacement tires from national demand compared with 2025.
- Consumer deferral. The Goodyear Tire & Rubber Company reported a 13% decline in Americas replacement unit volume in the second quarter of 2026, following a 23.2% fall in the first quarter. Owners who defer tire replacement also defer the alignment and service work that dealers sell alongside tires. Deferred replacement shifts tire purchases into later years rather than removing them, which supports recovery from 2027.
- Store closures and network resets. Monro, Inc. closed 145 stores in the first quarter of fiscal 2026 and reported a 3.2% fall in total revenue to USD 1.157 billion. Underperforming locations in saturated markets weigh on chain revenue even as comparable-store sales improve. Network resets remove overlapping locations without reducing the national replacement tire pool that dealers serve.
- Competition from mass merchants and online channels. General merchandise retailers receive 11% of passenger replacement shipments, and online sellers compete on tire price while partnering with installers. Price transparency compresses dealer margins on high-volume sizes such as 225/65R17 and 205/55R16. Online tire sales with installation at partner shops shift part of the tire margin away from the installing dealer.
Key Trends
Four shifts are changing the structure of US tire retail and distribution.
- Private equity and chain consolidation. Mavis Tire Express Services Corp. completed its USD 700 million Pep Boys acquisition in August 2026, adding nearly 800 locations, and Big Brand Tire & Service, owned by Percheron Capital, agreed in July 2026 to acquire Belle Tire, reaching more than 530 locations and over USD 1.5 billion in revenue. Sun Auto Tire & Service entered Colorado and Arizona through 23 DAS Drive Automotive Services locations in March 2026. Acquisitions change store ownership without adding outlets, so consolidation raises purchasing power more than physical capacity. Private equity owners use acquired platforms to add bolt-on stores in adjacent markets, which accelerates the shift from local to national ownership.
- Wholesale distribution consolidation. K&M Tire, Inc. combined with Zurcher Tire, effective February 2026, bringing 12 Zurcher distribution centers into a network of 53. Larger distributors offer faster delivery and broader size coverage to independent dealers competing with national chains. Distributor scale also supports private-brand programs, which account for 14% of passenger replacement shipments. Faster delivery narrows the inventory gap between independent dealers and national chains in large-rim and light truck sizes.
- Manufacturer-owned retail networks. Bridgestone Retail Operations, LLC operates more than 2,200 centers, including over 1,800 Firestone Complete Auto Care stores in 48 states with more than 9,500 technicians, and marked the Firestone centennial in June 2026 with a customer-data initiative. Manufacturer networks secure shelf space for their own brands. Manufacturer retail data gives suppliers direct visibility of replacement timing, size demand and customer service history. Manufacturer-owned stores also serve as launch channels for new products such as the Bridgestone UltraWeather all-weather line introduced in June 2026.
- Service platforms beyond tires. Monomoy Capital Partners closed its USD 1.3 billion purchase of Jiffy Lube International in July 2026, covering more than 2,000 service centers. Quick-service networks compete with tire dealers for maintenance visits and increasingly add tire sales to oil and service tickets. Quick-service operators add tire sales to oil-change visits, which puts them in direct competition with tire dealers for the same customers. The overlap between tire and quick-service networks raises competition for the maintenance visits that generate dealer service revenue.
Market Segmentation
National dealers with more than 40 outlets across three or more regions account for USD 20.46 billion, or 52.70% of 2025 dealer revenue, and are projected to reach USD 23.71 billion by 2030 at a 2.99% CAGR. The channel receives 41% of passenger and 46% of light truck replacement shipments, an estimated 109.24 million tires in 2025. Mavis Tire Express Services Corp., The Reinalt-Thomas Corporation (Discount Tire), Bridgestone Retail Operations, LLC and Monro, Inc. lead the group, and acquisitions in 2026 move further volume into national ownership. National dealer revenue eases to an estimated USD 20.41 billion in 2026 in line with lower replacement volumes, before recovering from 2027.
Local dealers with up to nine outlets in one regional distribution area account for USD 9.81 billion, or 25.28% of 2025 dealer revenue, and are projected to reach USD 11.37 billion by 2030 at a 3.00% CAGR. The channel receives 19% of passenger and 26% of light truck replacement shipments, an estimated 52.39 million tires, and relies on wholesale distributors such as American Tire Distributors, Inc., K&M Tire, Inc. and TireHub, LLC for daily delivery of a broad size range. Local dealers remain the main acquisition targets for regional and national groups seeking density in existing markets.
Regional dealers with 10 to 40 outlets across two or more regions account for USD 8.55 billion, or 22.02% of 2025 dealer revenue, and are projected to reach USD 9.91 billion by 2030 at a 3.00% CAGR. The channel receives 17% of passenger and 20% of light truck replacement shipments, an estimated 45.64 million tires, and forms the main acquisition pool for national consolidators, as the Belle Tire and DAS Drive Automotive Services transactions in 2026 show. Regional groups such as Belle Tire, with more than 180 stores, sit at the scale that national consolidators target.
Passenger tire customers account for USD 30.10 billion, or 77.53% of 2025 dealer revenue, and are projected to reach USD 34.20 billion by 2030 at a 2.59% CAGR. Dealers receive 77% of passenger replacement shipments, an estimated 172.59 million tires in 2025, led by sizes such as 225/65R17 at 6.0% and 205/55R16 at 3.3% of passenger replacement. Passenger customers generate most of the alignment, brake and maintenance work that dealers attach to tire sales, and their share of revenue eases to 76.01% by 2030 as the light truck parc grows faster than the car parc. Passenger customer revenue eases slightly in 2026 with lower shipments before growing with tire prices from 2027.
Light truck tire customers account for USD 8.72 billion, or 22.47% of 2025 dealer revenue, and are the faster-growing group at a 4.35% CAGR to USD 10.79 billion by 2030. Dealers receive 92% of light truck replacement shipments, an estimated 34.68 million tires in 2025, as general merchandise retailers take only 2%. Large fitments such as LT275/70R18 at 8.8% and LT265/70R17 at 7.8% of light truck replacement carry higher installation and balancing revenue per tire, which raises their share of dealer revenue to 23.99% by 2030. Pickup and SUV owners also buy more all-terrain and highway terrain tires, which carry higher prices than passenger touring tires.
By Geography
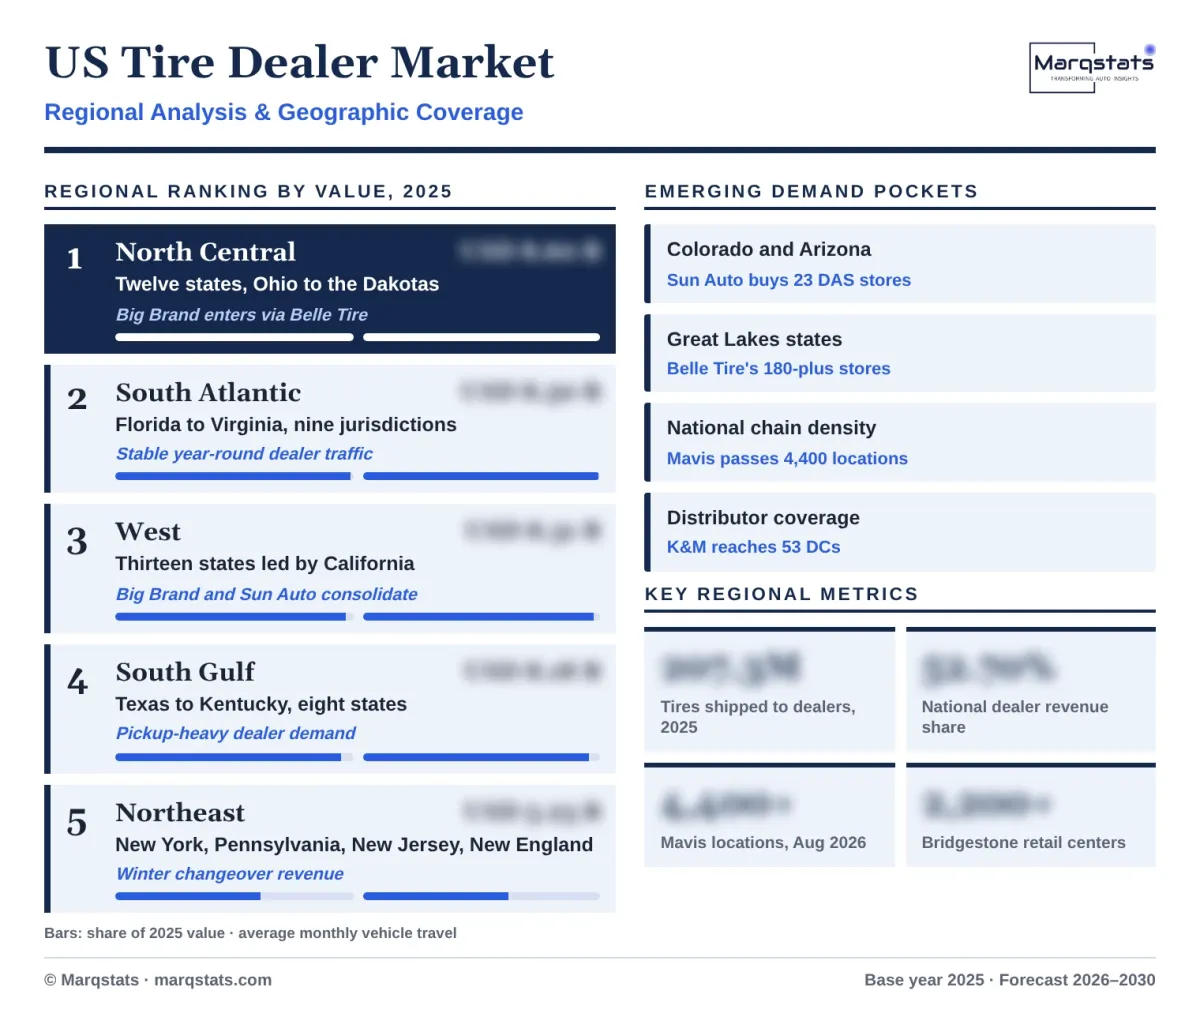
North Central
The North Central region is the largest regional market, accounting for 22.16% of 2025 dealer revenue, or USD 8.60 billion, across twelve states from Ohio and Michigan to Kansas and the Dakotas. Average monthly vehicle travel of 63.53 billion miles in the sampled 2025 months is the highest of the five FHWA regions, and Big Brand Tire & Service enters the region through Belle Tire, which operates in Michigan, Ohio, Indiana and Illinois. Severe winters across the region support seasonal tire changeovers and all-weather tire sales such as the Continental SecureContact AW. An estimated 22.16% of dealer revenue in the region equals USD 8.60 billion, the largest regional pool for national consolidators.
South Atlantic
The South Atlantic region accounts for 21.90% of 2025 dealer revenue, or USD 8.50 billion, across Florida, Georgia, the Carolinas, Virginia, Maryland, Delaware, West Virginia and the District of Columbia. Travel is the most stable across seasons, with December 2025 only 3.7% below October, which supports steady year-round dealer traffic for national chains and regional groups. The region also hosts the Goodyear plant in Fayetteville, North Carolina, scheduled to close by the end of 2027, and the Pirelli plant in Rome, Georgia. National chains with dense store networks along the Interstate 95 corridor compete for the region's year-round passenger replacement demand.
West
The West region accounts for 21.41% of 2025 dealer revenue, or USD 8.31 billion, across thirteen states led by California, Washington, Arizona and Colorado. Big Brand Tire & Service, headquartered in Moorpark, California, and Sun Auto Tire & Service, which entered Colorado and Arizona through DAS Drive Automotive Services in March 2026, are consolidating independent dealers in the region. Dry climates and long driving distances in the Mountain states support demand for all-terrain light truck tires through local dealers. California carries the largest share of the region's dealer revenue, supported by the highest population of any US state.
South Gulf
The South Gulf region accounts for 21.07% of 2025 dealer revenue, or USD 8.18 billion, across Texas, Oklahoma, Louisiana, Arkansas, Mississippi, Alabama, Tennessee and Kentucky. December 2025 travel of 57.615 billion miles rose 1.5% year on year, the fastest December gain of the five regions, supporting dealer traffic in pickup-heavy markets. Texas is the most populous state in the region, and pickup-heavy demand raises the light truck share of dealer revenue. Regional dealer groups and national chains both expand in the region through acquisitions of independent stores.
Northeast
The Northeast region accounts for 13.46% of 2025 dealer revenue, or USD 5.23 billion, across New York, Pennsylvania, New Jersey and the six New England states. Average monthly travel of 38.57 billion miles is the lowest of the five regions, and winter tire changeovers add seasonal installation revenue for dealers in the region. Dense urban markets favor chains with high store density near commuter routes and transit corridors. Winter tire sales add a second seasonal installation peak each year, which lifts revenue per customer for dealers that store tires off-season.
How Competition Is Evolving
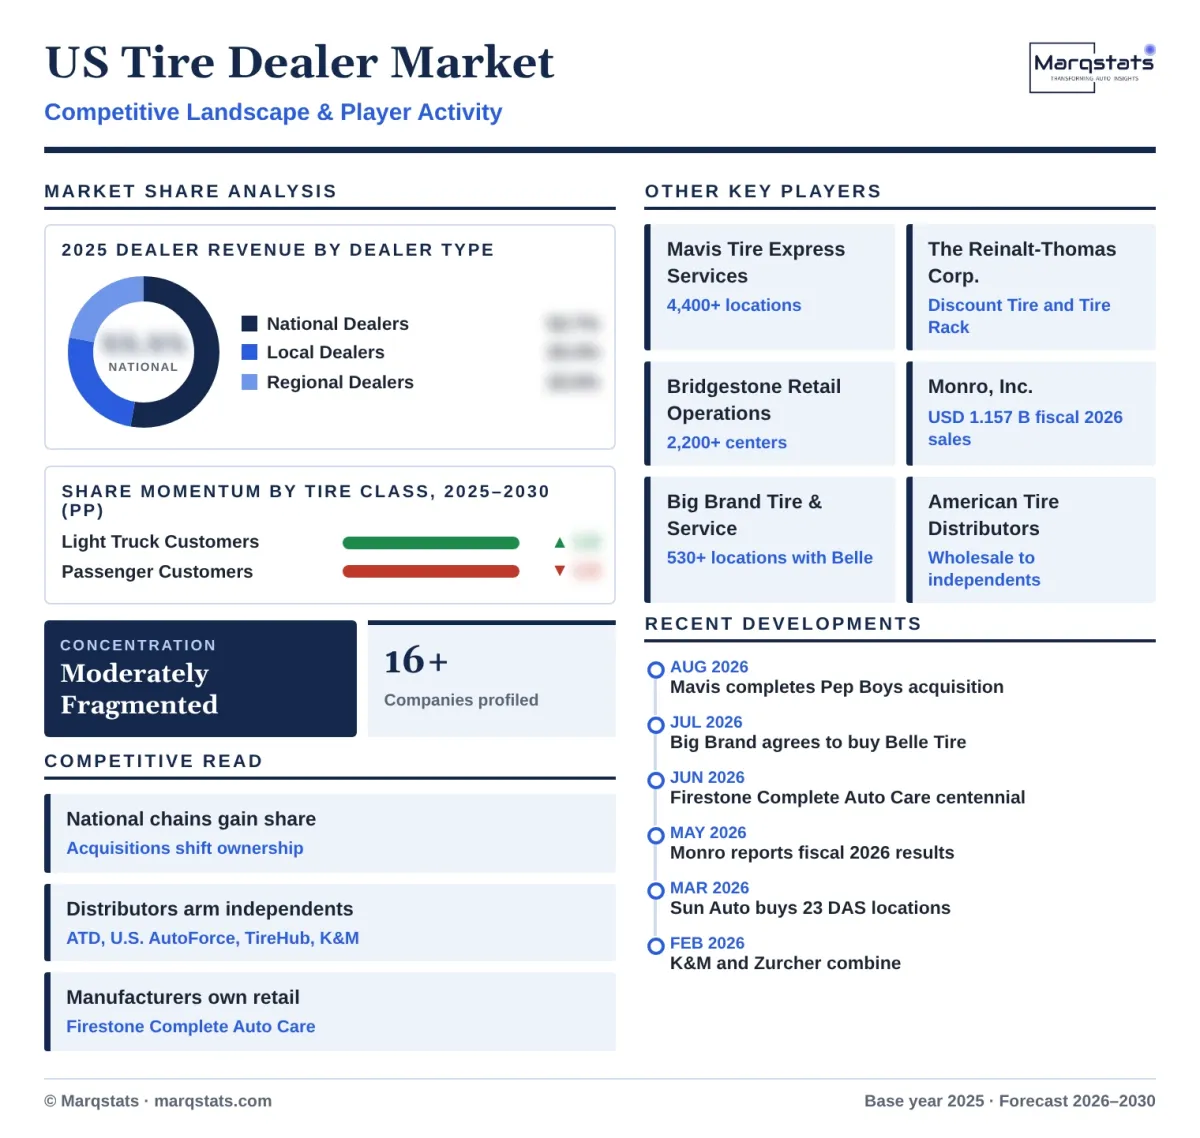
The US tire dealer market is moderately fragmented, with national chains gaining share from independent local and regional dealers. National dealers receive 41% of passenger and 46% of light truck replacement shipments, while local dealers receive 19% and 26%. Mavis Tire Express Services Corp. operates more than 4,400 owned and franchised locations after its Pep Boys acquisition, Bridgestone Retail Operations, LLC more than 2,200 centers, and Monro, Inc. 1,115 company-operated stores with 47 franchise locations. The Reinalt-Thomas Corporation, which trades as Discount Tire, combines a national store network with online sales through Tire Rack.
Competition centers on store density, service range and access to inventory. National chains compete on scale purchasing and multi-brand assortments, manufacturer-owned networks secure placement for their own brands, and independent dealers rely on wholesale distributors such as American Tire Distributors, Inc., U.S. Venture, Inc. through U.S. AutoForce, TireHub, LLC and K&M Tire, Inc. for same-day delivery. Private brands hold 14% of passenger and 12% of light truck replacement shipments, giving distributors and chains a margin lever through exclusive lines. General merchandise retailers such as Walmart Inc. and Costco Wholesale Corporation compete on price for high-volume passenger sizes.
Acquisitions are reshaping ownership rather than adding stores. Mavis completed its USD 700 million Pep Boys purchase in August 2026, Big Brand Tire & Service agreed to acquire Belle Tire in July 2026, and Sun Auto Tire & Service bought 23 DAS Drive Automotive Services locations in March 2026, while Monro closed 145 stores. Ownership consolidation strengthens the negotiating position of the largest chains with tire manufacturers and distributors on pricing, private-brand programs and delivery terms. Commercial truck tire dealers form a separate layer, covered in the Marqstats US Commercial Truck Tire Market report.
Companies Covered
Companies covered in the report include:
Recent Market Activity
Table of Contents
Coverage & Segmentation
The US tire dealer market comprises revenue earned by tire dealers in the United States from new tire sales, installation and the automotive services sold through tire and service centers, valued in US dollars. The market excludes wholesale distribution revenue, tire sales through general merchandise retailers and vehicle dealerships, and manufacturer revenue. Coverage uses a 2025 base year, a 2021–2025 historical period and a 2026–2030 forecast period, with 2026 as the estimated year. Replacement tire value is covered in the Marqstats US Replacement Tire Market report.
Segmentation covers three dealer types and five FHWA regions, with 16 retailers, distributors and service networks profiled. Dealer channel revenue is the primary series, the market value is a Marqstats estimate, and dealer-type and regional splits are derived from replacement shipment shares and vehicle travel. The used vehicle parc that drives dealer service visits is covered in the Marqstats United States Used Car Market report.