Market Snapshot
Key Takeaways
Market Overview & Analysis
Report Summary
The UAE finished vehicle logistics market covers the movement of assembled vehicles through Emirates gateways and inland networks: quay and terminal handling on discharge and loading, yard and compound storage between those events, inland and cross-border road transport, and the customs, documentation and freight forwarding work that accompanies both import and re-export. The measured unit is the vehicle movement rather than the vehicle, and duplicate handling of the same unit is controlled for so that a vehicle discharged, stored and re-exported counts once rather than three times.
Two structural facts define the market. The first is that flow is set by regional distribution demand rather than by domestic sales, so throughput can grow strongly in a year when Emirates vehicle registrations are flat. The second is that free-zone treatment allows a vehicle to be landed, held and re-exported without entering domestic customs territory, which is what makes the Emirates competitive as a staging point against holding inventory at origin or at destination. Both facts are policy-dependent rather than geographic, and both would survive a change of gateway within the country.
The commercial character of the market is changing faster than its volume. Basic quay-to-yard handling is a commoditised service priced against terminal tariffs, and it is not where participants are investing. Investment is going into yard capacity with vehicle-level inventory control, covered storage, longer-dwell compound operations and the integration of storage with preparation. Storage that was once a cost of waiting is being sold as a controlled inventory service, and that repricing is the reason revenue grows materially faster than movements across the forecast.
Annual Finished-Vehicle Movements Through Emirates Gateways
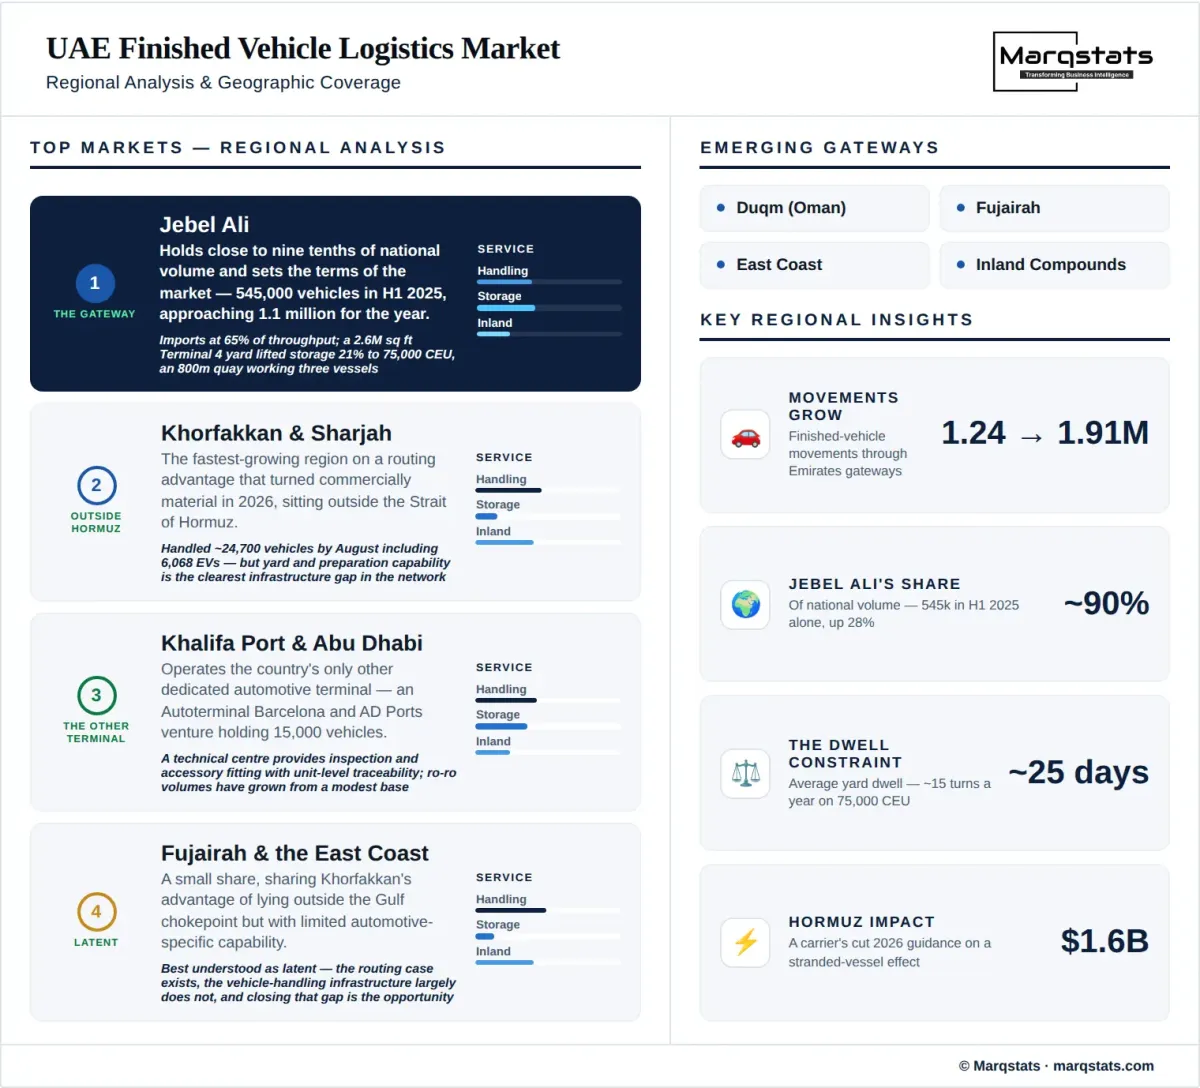
Finished-vehicle movements rise from 1.24 million in 2025 to 1.91 million by 2030, a 9.02% compound annual growth rate, reaching approximately 2.05 million by 2031. The series aggregates Jebel Ali, Khorfakkan and the Sharjah ports, Khalifa Port and the Abu Dhabi gateways, and the east coast, net of duplicate handling of the same unit. Jebel Ali contributed close to 1.1 million of the 2025 total.
Storage capacity is only meaningful against dwell, and the two together explain more about this market than either alone. At 75,000 car equivalent units of vehicle-storage capacity and close to 1.1 million vehicles handled, Jebel Ali turned its yard roughly fifteen times in 2025, implying an average dwell of about 25 days. That figure is the operating constraint: capacity expansion raises throughput only if dwell holds, and any lengthening of dwell consumes the 13,000 car equivalent units added at Terminal 4 without moving a single additional vehicle. Capacity announcements should always be read against a dwell assumption rather than treated as throughput headroom.
Blended logistics revenue per movement rises from USD 145 to USD 172, a 3.47% annual increase, which is why service value compounds at 12.81% against 9.02% growth in movements. The increase reflects a shift in what is being sold rather than tariff inflation. Quay handling is priced against published terminal rates and moves slowly. Yard storage with vehicle identification number-level inventory control, covered storage and longer-dwell compound services carry materially higher rates, and the facilities commissioned between 2025 and 2028 are weighted toward those services. Inland transport legs also lengthen as volume disperses across gateways.
Estimates are derived for the Jebel Ali component and modelled elsewhere. Port operator disclosure provides the throughput anchor for the dominant gateway; other gateways are estimated from published volume statements, terminal capacity and route announcements, and the inland component is modelled from flow direction. Confidence is medium. The vulnerable assumptions are the non-Jebel Ali gateway estimates and the blended rate, neither of which is published by any participant.
Market Dynamics
Key Drivers
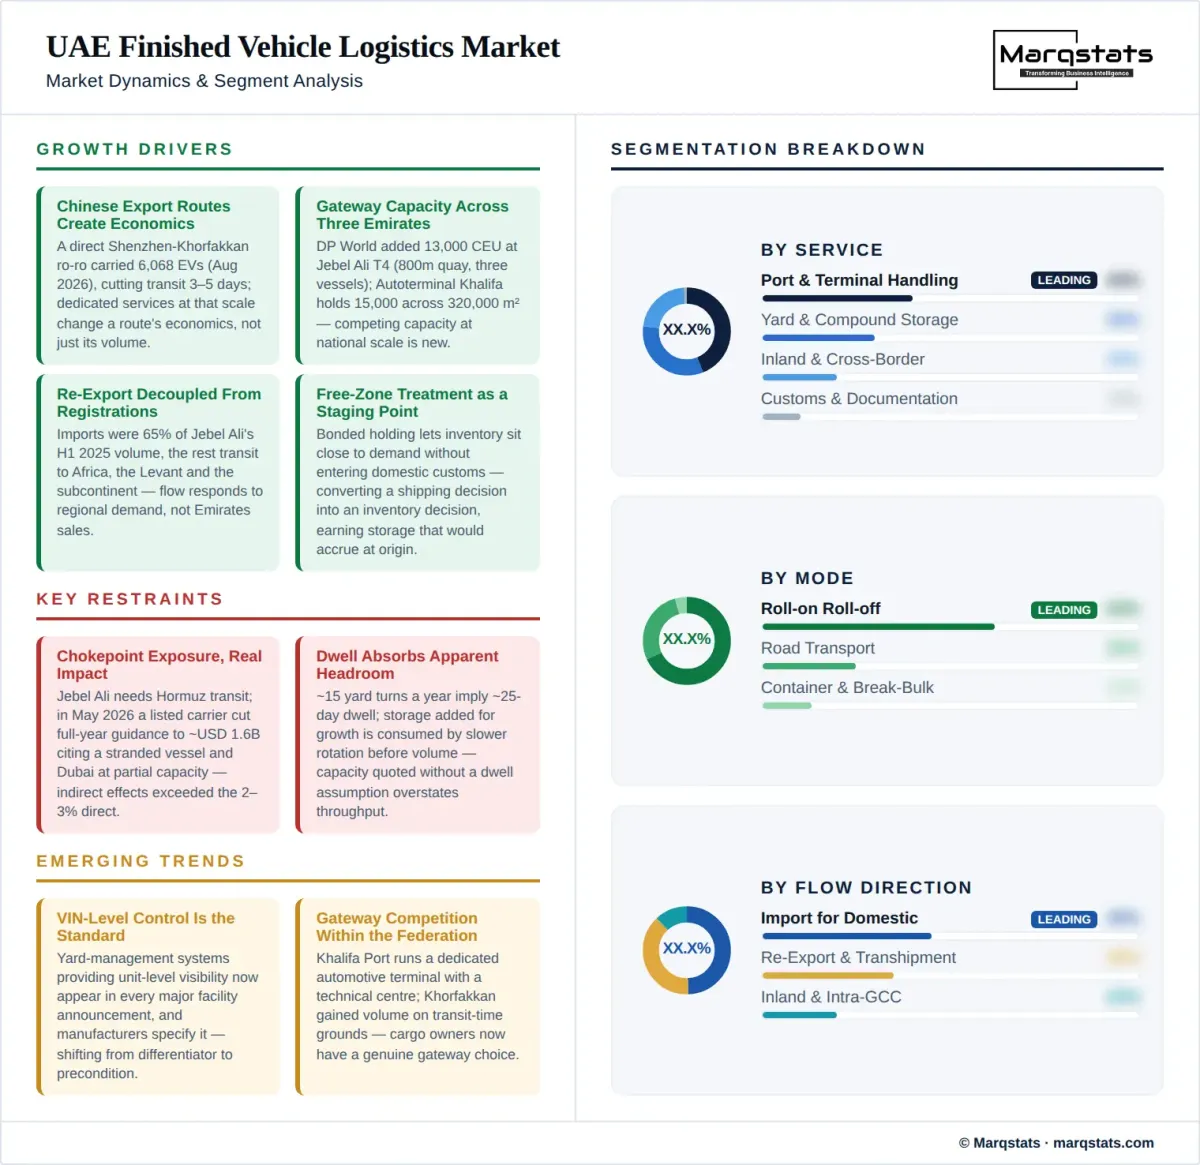
- Chinese export flows creating dedicated route economics. A direct roll-on roll-off sailing from Shenzhen to Khorfakkan carried 6,068 battery electric vehicles for a single manufacturer in August 2026, reportedly cutting maritime transit between China and the Emirates by three to five days. Dedicated services at that scale change the economics of a route rather than adding volume to an existing one, and they establish gateway relationships that persist after the initial shipments.
- Gateway capacity investment across three emirates simultaneously. DP World added 13,000 car equivalent units at Jebel Ali Terminal 4 on a 2.6 million square foot yard with an 800 metre quay working three vessels at once. Autoterminal Khalifa Port operates 15,000 vehicle capacity across 320,000 square metres with two berths, a 600 metre quay and 18.5 metres alongside. Competing capacity at national scale is new; for most of the past decade the question was whether Jebel Ali had room.
- Re-export and transit demand decoupled from domestic registrations. Imports accounted for 65% of Jebel Ali's vehicle volume in the first half of 2025, with the remainder moving as re-export and transhipment toward Africa, the Levant, Central Asia and the subcontinent. Transit flow responds to regional demand and to currency and credit conditions in destination markets, none of which correlate with Emirates vehicle sales.
- Free-zone treatment making the Emirates a viable staging point. Bonded holding allows inventory to sit close to demand without entering domestic customs territory, which converts a shipping decision into an inventory decision. Manufacturers and trading houses staging regional inventory in the Emirates rather than at origin generate storage and handling demand that would otherwise be earned in China, Japan or Korea.
- Yard capacity attaching preparation and inventory control. Facilities commissioned between 2025 and 2026 combine storage with vehicle-level visibility and preparation capability rather than offering land alone. A one-million-square-foot finished vehicles hub holding up to 6,500 vehicles with vehicle identification number-level inventory control, a 161,000 square foot facility with dedicated inspection and technical preparation space, and a vehicle processing centre with 65,000 square metres of covered storage 450 metres from the roll-on roll-off terminal all follow the same pattern.
Key Restraints
- Chokepoint exposure with measurable earnings impact. Jebel Ali sits inside the Gulf and requires transit through the Strait of Hormuz. In May 2026 a listed global vehicle carrier lowered full-year adjusted earnings guidance to approximately USD 1.6 billion from a range of USD 1.65 to 1.75 billion, citing a vessel stranded in the Strait, Dubai land operations running at partial capacity, and bunker cost volatility, while describing direct revenue exposure as 2 to 3%. The indirect fuel and charter effects exceeded the direct one.
- Dwell absorbing capacity that looks like headroom. Roughly fifteen yard turns a year at Jebel Ali imply an average dwell near 25 days, and dwell rises when destination-market demand softens or credit tightens. Storage capacity added for growth is consumed by slower rotation before it is consumed by volume, so a capacity figure quoted without a dwell assumption overstates the throughput it supports.
- Handling revenue commoditised at the quay. Terminal handling is priced against published tariffs and differentiates poorly, which caps margin on the largest single service line by volume. Participants seeking returns must move into storage, inventory control and preparation, and those services require capital and capability that a stevedoring operation does not possess.
- Volume dispersal fragmenting a scale-dependent business. Roll-on roll-off economics reward concentration, and the shift of volume toward Khorfakkan, the east coast and Omani gateways during 2026 splits a flow that previously arrived at one place. Fixed assets committed at one gateway cannot follow a diverted sailing, and operators serving several gateways carry duplicated overhead against a divided volume base.
Key Trends
- Vehicle-level inventory control becoming the service standard. Yard management systems providing vehicle identification number-level visibility now appear in every major facility announcement in the Emirates, and manufacturers and large trade buyers increasingly specify it. The capability is shifting from a differentiator to a precondition, which raises the capital threshold for entry into compound storage.
- Covered and climate-protected storage displacing open yard. A vehicle processing centre at Jebel Ali operates 65,000 square metres of covered storage with expansion potential, and covered capacity commands a premium in a climate where extended open-yard dwell degrades finish and interior condition. The economics improve as dwell lengthens, which links this trend directly to the routing volatility of 2026.
- Gateway competition emerging within the federation. Khalifa Port operates a dedicated automotive terminal with a technical centre performing pre-delivery inspection and accessory fitting, and Khorfakkan gained volume on transit-time and routing grounds. Cargo owners now have a genuine gateway choice inside the Emirates, which is a different competitive condition from the single-gateway structure that prevailed previously.
- Electric vehicle volume changing handling requirements at scale. A single manufacturer moved 6,068 battery electric vehicles through one gateway on one new service in August 2026. Battery electric units require state-of-charge management during storage, specific fire-safety separation and handling protocols, and terminal operators that cannot evidence those capabilities are excluded from the fastest-growing part of the flow.
Market Segmentation
Port and terminal handling is the largest service by both movement count and revenue, covering discharge and loading, quay-to-yard movement, lashing and securing, and vessel operations for roll-on roll-off and other modes. It is also the most commoditised, priced against published terminal tariffs with limited scope for differentiation. Its revenue share declines gradually across the forecast as storage and inland services grow faster.
Yard and compound storage is the fastest-growing service and the one attracting most investment, covering open and covered storage, vehicle identification number-level inventory control, condition monitoring and the compound operations that sit between discharge and onward movement. Rates are materially above handling, and the shift toward controlled inventory services rather than passive land rental is the principal driver of the rising blended rate per movement.
Inland and cross-border transport covers car-carrier road movement between gateways, compounds, free zones and dealer networks, and onward road movement into the wider Gulf. Demand grows faster than movements because volume dispersal across gateways lengthens the average inland leg, and because vehicles arriving at east coast ports for Dubai and Abu Dhabi destinations require road transport that a Jebel Ali arrival does not.
Customs, documentation and freight forwarding covers declaration handling, free-zone entry and exit formalities, re-export documentation and the coordination work that spans the chain. Revenue per movement is small but the activity is required on essentially every unit, and complexity rises with re-export share because destination-market requirements vary while domestic entry does not.
Import for domestic distribution accounts for the largest share of movements, consistent with imports representing 65% of Jebel Ali's vehicle throughput in the first half of 2025. Logistics intensity per unit is moderate, with a short inland leg to distributor compounds and relatively predictable dwell tied to sales cycles rather than to trade financing.
Re-export and transhipment covers vehicles moving onward to Africa, the Levant, Central Asia and the subcontinent, and is the flow that makes Emirates volume structurally larger than the domestic market. Dwell is longer and more variable than on import flow because onward movement depends on destination-market credit, documentation and vessel availability, which makes this the segment that consumes storage capacity most unpredictably.
Inland and intra-Gulf distribution covers road movement within the Emirates and across land borders into neighbouring markets. The segment grows fastest in movement terms as gateway dispersal lengthens domestic legs and as regional buyers increasingly take delivery from Emirates compounds rather than arranging their own port collection.
Roll-on roll-off is the dominant mode for finished vehicles and the one to which gateway infrastructure is matched, with an 800 metre quay at Jebel Ali Terminal 4 able to work three vessels simultaneously and a 600 metre quay with 18.5 metres alongside at Khalifa Port. Roll-on roll-off volumes rose 15% year on year into 2026, and dedicated services from Chinese ports are the fastest-growing source of that increase.
Container and break-bulk movement covers vehicles shipped in containers, typically used units and smaller consignments where roll-on roll-off space is unavailable or uneconomic, together with high-value units requiring enclosed transit. The mode carries higher handling cost per vehicle and is used where consignment size or vehicle condition makes it necessary rather than by preference.
Road transport covers car-carrier movement between gateways, compounds and delivery points inside the Emirates and across Gulf land borders. It is the mode most directly affected by gateway dispersal, since a vehicle landed at Khorfakkan for a Dubai destination generates a road leg that the same vehicle landed at Jebel Ali would not.
Passenger cars account for the large majority of movements across the forecast, reflecting the composition of both import and re-export flows from Chinese, Japanese, Korean, Thai and Indian sources. Handling and storage requirements are standardised, which is what allows the high-density yard operations that Emirates gateways are built around.
Commercial vehicles occupy a smaller share of movements but consume disproportionate yard area per unit and require different lashing, storage and handling arrangements. Demand follows regional construction, logistics and fleet renewal cycles rather than consumer purchase, which gives the segment a different growth rhythm from passenger cars.
High and heavy equipment covers construction, agricultural and industrial machinery moving on roll-on roll-off tonnage alongside vehicles. Volumes are small in unit terms but revenue per unit is the highest of the three categories, and Duqm handled more than 600 high and heavy units alongside its roll-on roll-off vehicle volume through August 2026, indicating that the category follows the same routing shifts.
By Geography
Jebel Ali
Jebel Ali holds close to nine tenths of national volume and sets the terms of the market. The port handled 545,000 vehicles in the first half of 2025, a 28% year-on-year increase, approaching 1.1 million for the full year, with imports at 65% of throughput sourced principally from China, Japan, Thailand, India and South Korea. A 2.6 million square foot Terminal 4 yard added 13,000 car equivalent units to lift total vehicle-storage capacity 21% to 75,000, served by an 800 metre quay working three roll-on roll-off vessels simultaneously.
Khorfakkan and Sharjah Ports
Khorfakkan grows fastest across the forecast on a routing advantage that became commercially material during 2026, sitting outside the Strait of Hormuz on the Gulf of Oman coast. The port handled around 24,700 vehicles by August 2026, including 6,068 battery electric vehicles on a new direct service from Shenzhen that reportedly cut maritime transit by three to five days. Yard and preparation capability there remains thin relative to the volume now arriving, which is the clearest infrastructure gap in the national network.
Khalifa Port and Abu Dhabi
Khalifa Port operates the country's only other dedicated automotive terminal, a joint venture between Autoterminal Barcelona and AD Ports Group holding 15,000 vehicles across 320,000 square metres with two berths, a 600 metre quay and 18.5 metres alongside. A technical centre provides pre-delivery inspection and accessory fitting with unit-level traceability, and connectivity to the adjacent economic zone and to road and rail networks supports onward distribution. Roll-on roll-off volumes there have grown strongly from a modest base.
Fujairah and the East Coast
Fujairah and the wider east coast hold a small share but share Khorfakkan's structural advantage of lying outside the Gulf chokepoint. Automotive-specific terminal capability is limited, and the position is best understood as latent rather than active: the routing case exists, the vehicle-handling infrastructure largely does not, and closing that gap is a defined investment opportunity.
Rest of the United Arab Emirates
The remaining areas hold a negligible share of movements. Finished vehicle logistics requires deep-water berths, roll-on roll-off ramps, large contiguous yard area and customs infrastructure, and that combination exists at four locations. Inland compound capacity outside the port hinterlands serves distribution rather than gateway function and is counted within the inland transport and storage segments rather than as a separate geography.
How Competition Is Evolving
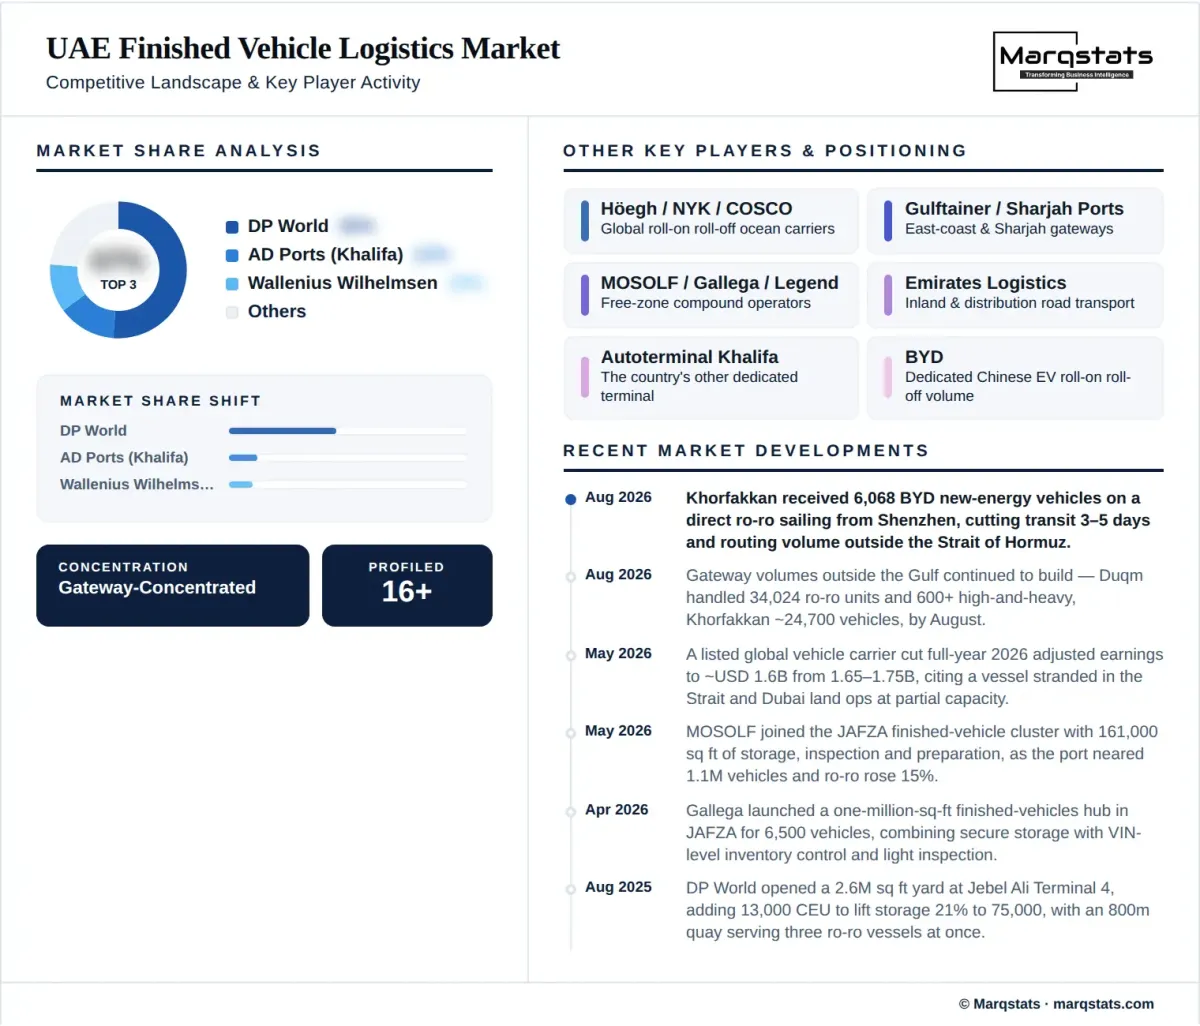
The market is highly concentrated at the gateway and fragmented everywhere else, and the two layers behave differently enough that a single concentration statement misleads. One operator handles close to nine tenths of national finished-vehicle volume through Jebel Ali and simultaneously controls the free-zone land on which the yard and preparation cluster has been built. That combination of quay and hinterland is the strongest position in the chain, and it is not contested by any participant operating at national scale.
Below the gateway, three groups compete without occupying the same ground. Global vehicle carriers and their logistics arms bring ocean tonnage and, in at least one case, a dedicated vehicle processing centre 450 metres from the roll-on roll-off terminal with 65,000 square metres of covered storage. Free-zone yard operators including recent entrants from Europe and the Gulf compete on storage capacity, inventory control and preparation capability rather than on handling rates. Regional road transport operators serve the inland legs, a fragmented segment where gateway dispersal is creating demand faster than capacity.
Competitive advantage is shifting from handling capacity to inventory capability, and the 2026 routing disruption accelerated that shift. A carrier's own guidance revision citing a stranded vessel and partial Dubai land operations demonstrated that gateway concentration is a risk as well as an advantage, and cargo owners responded by testing alternatives. Operators positioned at a single gateway face a strategic choice between defending share there and establishing presence at east coast ports where volume is arriving faster than capability exists. Consolidation is likelier to take the form of capacity agreements across gateways than of acquisitions.
Companies Covered
The report profiles 16+ companies with full strategy and financials analysis, including:
Recent Market Activity
Table of Contents
Coverage & Segmentation
The study covers the United Arab Emirates with gateway-level detail for Jebel Ali, Khorfakkan and the Sharjah ports, Khalifa Port and Abu Dhabi, Fujairah and the east coast, and the remaining areas. It measures annual finished-vehicle movements as the primary unit and annual logistics service revenue in United States dollars as the secondary measure. The base year is 2025, the historical period covers 2023 to 2025, and the forecast period runs from 2026 to 2030 with an indicative 2031 endpoint. Segmentation covers service, flow direction, mode and vehicle type.
Three exclusions define the boundary. Ocean freight revenue is excluded because it is earned by carriers largely outside Emirates jurisdiction, while the terminal, yard and inland services those vessels generate inside the country are included. Value-added processing work performed on the vehicle is excluded and belongs to the vehicle processing services market. Movement and work are different line items on the same flow, which makes the two markets additive rather than overlapping. Vehicle trading margin and aftermarket service on registered vehicles are excluded. Movements are counted net of duplicate handling, so a vehicle discharged, stored and re-exported counts once.