Market Snapshot
Key Takeaways
Market Overview & Analysis
Report Summary
The UAE automotive vehicle processing services market covers the paid work performed on a finished vehicle between the point it lands in the Emirates and the point it leaves for a customer or a foreign market. Four activities constitute it: pre-delivery inspection and technical preparation, refurbishment and reconditioning, accessory fitment and customisation, and export-ready preparation with the documentation and compliance work attached to it. Electric vehicle diagnostics and battery-state assessment sit inside those activities as a rising share of the work rather than as a separate line. Vehicle identification number-level yard management is included where it is sold as a service rather than bundled into a storage rate.
The market exists because of geography and free-zone structure rather than because of domestic demand. Jebel Ali Free Zone hosts more than 940 automotive companies from 88 countries and facilitated close to 48% of Dubai's automotive trade by value in 2024, against an automotive trade value of approximately AED 102 billion. A cluster of that density allows a vehicle to be landed, held under bond, worked on and re-exported without entering the domestic customs territory, which is what makes processing in the Emirates competitive against processing at origin or at destination. Removing the free-zone treatment would remove most of the market.
Value per vehicle is the variable that matters commercially, and it is rising for a specific reason. A vehicle that receives a light inspection before onward shipment generates a fraction of the revenue of one that is reconditioned, has accessories fitted for a destination market specification, undergoes battery-state assessment and is prepared with export documentation. The facilities opening between 2026 and 2028 are built for the second kind of work, not the first. Capacity announcements should therefore be read as a bid to move up the value ladder rather than as a bid for throughput share.
Vehicles Receiving Paid Value-Added Processing
Vehicles receiving paid value-added processing rise from 172,000 in 2025 to 630,000 by 2030, a 29.65% compound annual growth rate, reaching approximately 743,000 by 2031. The count measures vehicles on which a chargeable processing service is performed, not vehicles handled at Emirates ports. Total finished-vehicle throughput across Emirates ports is estimated at 1,240,000 in 2025 rising to 1,910,000 by 2030, and the processed population is a minority of it throughout.
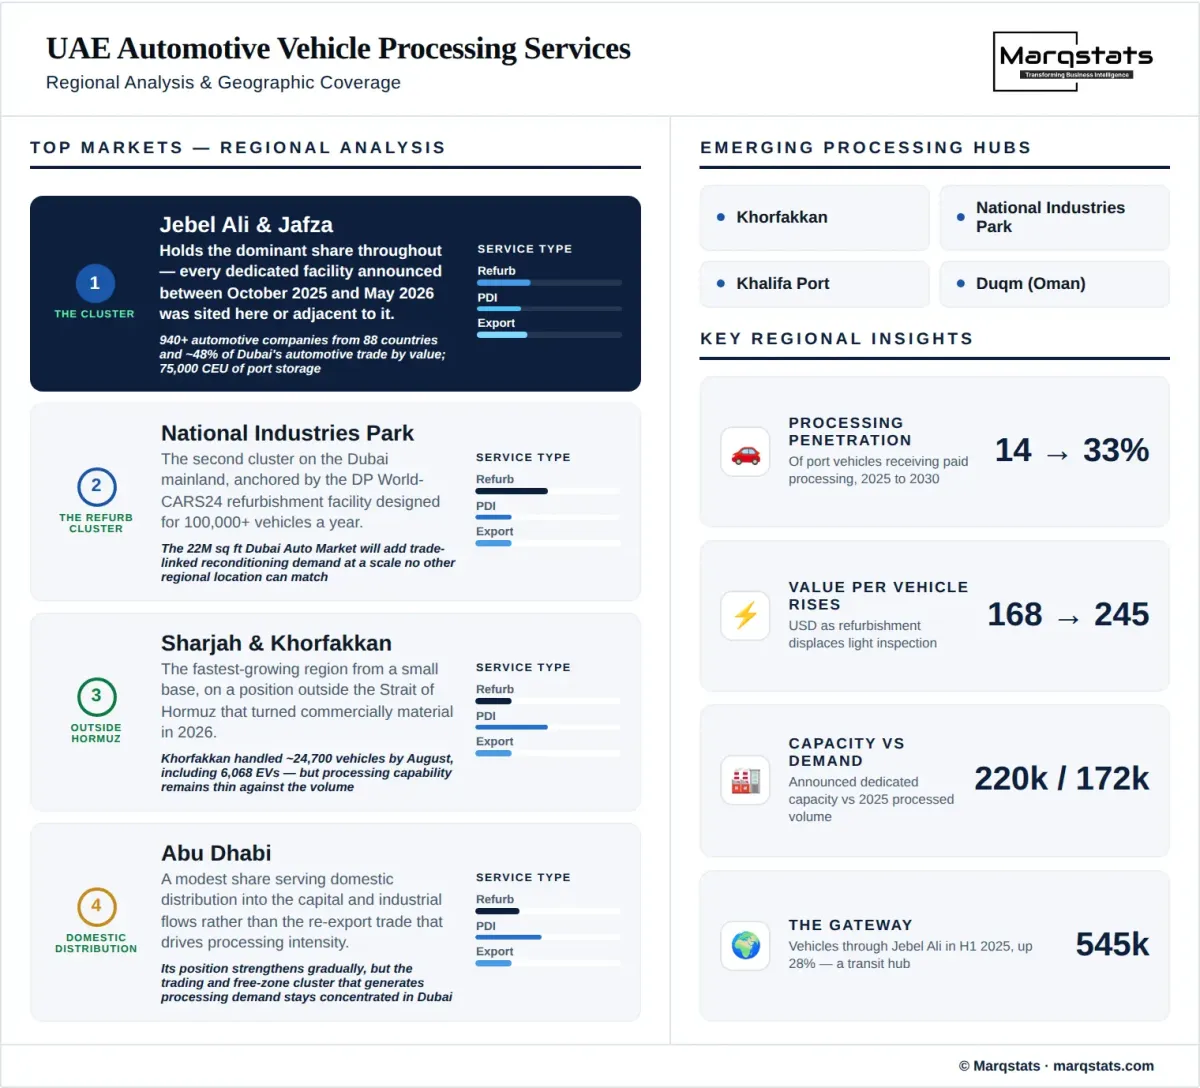
Penetration, not throughput, is where the growth comes from. Total port throughput grows at 9.02% a year across the forecast, which is a strong figure for a logistics flow but a small one against 29.65% growth in processed vehicles. The difference is the share of arriving vehicles that receive paid work, and that share roughly doubles, from 13.9% in 2025 to a projected 33.0% by 2030 — about one vehicle in seven becoming one in three. A forecast built on throughput growth alone would understate this market by a factor of three.
The penetration path is anchored on announced capacity rather than on assumption. Legend Holding's Jebel Ali Free Zone hub is designed to manage more than 120,000 vehicles annually at full operation, holding 5,000 vehicles in its first phase and more than 20,000 by January 2028. The DP World and CARS24 facility at National Industries Park is designed for more than 100,000 vehicles a year from August 2026 across 220,000 square feet with more than 140 internal vehicle checkpoints. Those two alone exceed 220,000 vehicles of annual dedicated capacity by 2028, against a processed population of 172,000 in 2025. Gallega's one-million-square-foot hub holding up to 6,500 vehicles and the MOSOLF facility with its dedicated inspection and technical preparation space add further capability.
Blended revenue per processed vehicle rises from USD 168 to USD 245, a 7.84% annual increase, which is why service value compounds at 39.80% against 29.65% growth in vehicle count. The increase is a mix effect rather than price inflation. Light pre-delivery inspection performed alongside storage sits at the bottom of the range; refurbishment, destination-specification accessory fitment, battery-state assessment on electric vehicles and export documentation preparation sit well above it. As dedicated refurbishment capacity opens, the composition of the processed population shifts toward the higher-value work, and the blended rate follows.
Estimates are modelled. No participant reports vehicle processing revenue as a segment, and port throughput statistics do not distinguish vehicles that received paid work from those that were only handled and stored. The estimate applies an addressable processing share to import and re-export flows and cross-checks it against announced dedicated facility capacity. Confidence is medium, with the throughput anchor materially stronger than the penetration assumption.
Market Dynamics
Key Drivers
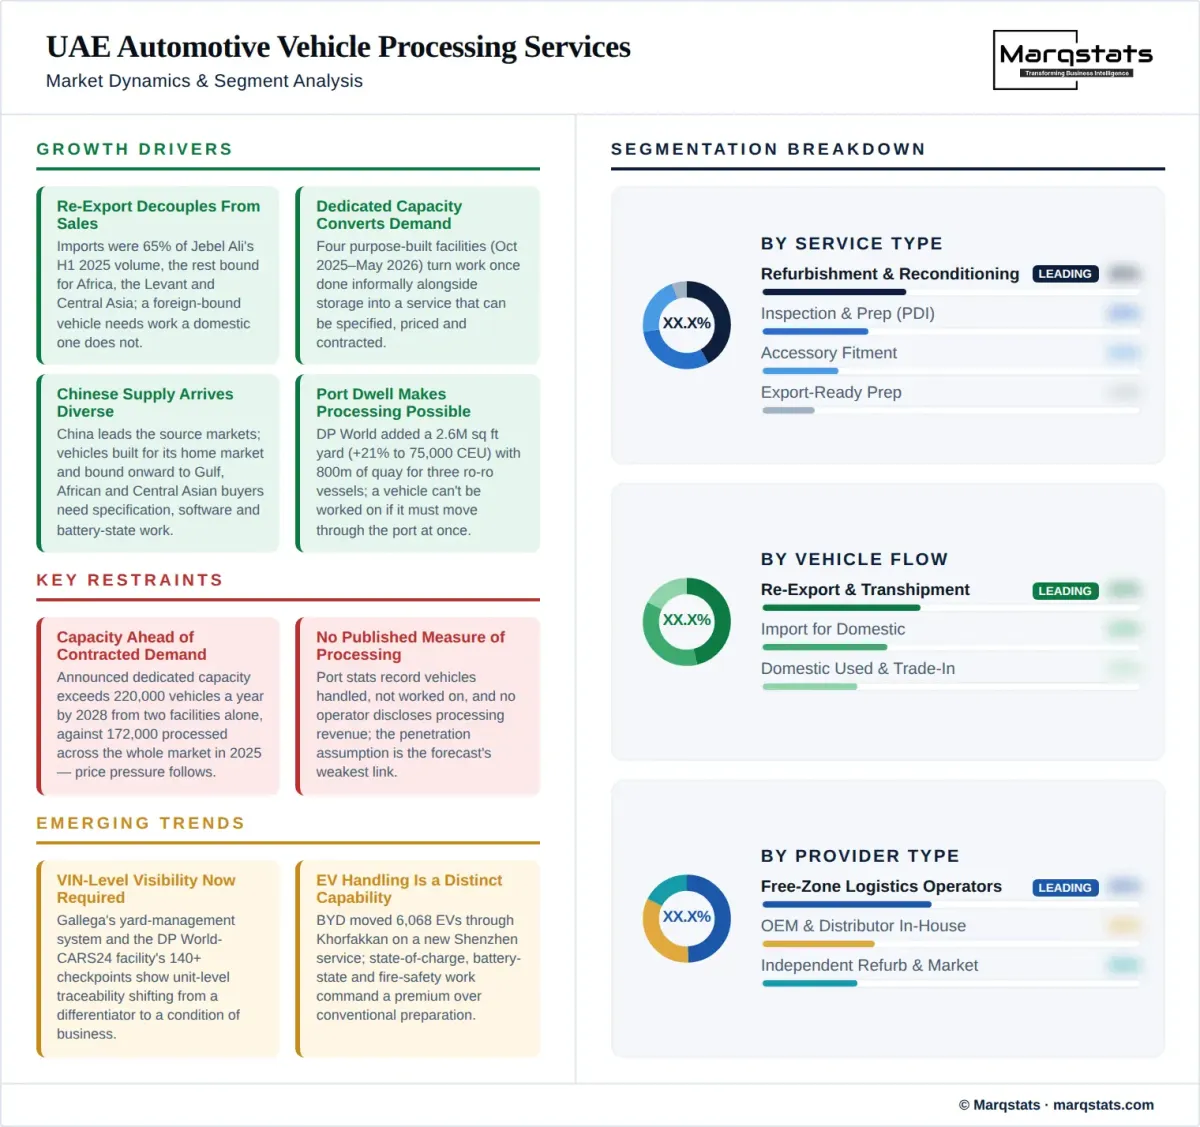
- Re-export flows decoupling demand from domestic sales. Imports accounted for 65% of Jebel Ali's vehicle volume in the first half of 2025, with the balance moving as re-export and transhipment toward Africa, the Levant and Central Asia. A vehicle destined for a foreign market frequently requires specification adjustment, accessory fitment and documentation that a domestically registered vehicle does not, so the transit population generates more processing work per unit than the resident one.
- Dedicated capacity converting an incidental activity into a purchased service. Four facilities announced or opened between October 2025 and May 2026 provide purpose-built processing capability where previously the work was performed informally alongside storage. Purpose-built capacity with defined checkpoints, yard management systems and inspection bays creates a service that can be specified, priced and contracted, which is the change that turns latent demand into recorded revenue.
- Chinese vehicle supply arriving in specification-diverse volume. China leads the source markets feeding Jebel Ali alongside Japan, Thailand, India and South Korea. Vehicles built for the Chinese domestic market and destined onward to Gulf, African and Central Asian buyers require specification checks, software and language configuration, accessory adaptation and in the case of electric models battery-state verification before onward sale.
- Port capacity investment removing the physical constraint. DP World added a 2.6 million square foot vehicle yard at Jebel Ali, raising port storage capacity 21% to 75,000 car equivalent units, with 800 metres of quay able to handle three roll-on roll-off vessels simultaneously. Dwell capacity is what makes processing possible: a vehicle cannot be worked on if it must move through the port immediately.
- A retail and trade platform being built at unprecedented scale. The Dubai Auto Market, announced November 2025 by DP World with Dubai Municipality and Jebel Ali Free Zone, covers 22 million square feet with more than 1,500 showrooms, cluster-based workshop zones, an auction house and customs facilities, and is designed for more than 800,000 vehicles annually against current Dubai automotive sales of approximately AED 6.8 billion. Auction and trade platforms generate reconditioning demand as a direct function of the volume that passes through them.
Key Restraints
- Capacity arriving ahead of contracted demand. Announced dedicated capacity exceeds 220,000 vehicles a year by 2028 from two facilities alone, against 172,000 vehicles processed across the entire market in 2025. Utilisation risk sits with the operators, and a period of price competition on basic preparation work is the likely consequence, which compresses the blended rate at the lower end of the service range even as the mix shifts upward.
- Routing sensitivity to regional security conditions. Jebel Ali lies inside the Gulf and requires vessel transit through the Strait of Hormuz. During 2026 volume shifted to ports outside that chokepoint, with Duqm handling 34,024 roll-on roll-off units and Khorfakkan around 24,700 vehicles by August, and a new direct Shenzhen to Khorfakkan service reportedly cutting sea transit by three to five days. Processing capacity built at Jebel Ali cannot follow a diverted vessel.
- No published measure of what is actually processed. Port statistics record vehicles handled, not vehicles worked on, and no operator discloses processing revenue separately. Buyers cannot benchmark price, investors cannot verify utilisation, and the penetration assumption that drives this forecast is the weakest link in it. That opacity also allows capacity announcements to be read as demand evidence when they are not.
- In-house preparation retaining a large share of the work. Established distributors operate their own preparation centres and perform pre-delivery inspection internally as part of the vehicle margin rather than as a purchased service. That work is real but not addressable by third-party providers, and the boundary between the two moves with distributor economics rather than with service quality.
Key Trends
- Vehicle identification number-level visibility becoming a competitive requirement. Gallega's finished vehicles hub combines storage with a yard management system providing vehicle-level inventory visibility, and the DP World and CARS24 facility operates more than 140 internal vehicle checkpoints. Traceability at unit level is shifting from a differentiator to a condition of doing business with manufacturers and large trade buyers.
- Electric vehicle handling emerging as a distinct processing capability. BYD moved 6,068 electric vehicles through Khorfakkan on a new direct service from Shenzhen launched in August 2026. Electric vehicles require state-of-charge management during storage, battery-state assessment before sale and different handling protocols, and providers able to evidence that capability command a premium over conventional preparation.
- Processing integrating with trading and auction platforms. The DP World and CARS24 facility pairs refurbishment with a used-vehicle marketplace operator, and the Dubai Auto Market pairs showroom and auction capacity with workshop zones. Bundling reconditioning with the sale channel captures the value uplift that reconditioning creates, rather than charging a service fee for it.
- Free-zone clustering deepening rather than dispersing. Jebel Ali Free Zone hosts more than 940 automotive companies from 88 countries and facilitated close to 48% of Dubai automotive trade by value in 2024, and the facilities announced since late 2025 have concentrated there rather than dispersed to lower-cost locations. Proximity to the port, to customs treatment and to trade counterparties outweighs land cost in this activity.
Market Segmentation
Pre-delivery inspection and technical preparation is the largest service type by vehicle count and the smallest by revenue per unit, covering arrival inspection, damage assessment, protective material removal, fluid and battery checks, functional testing and preparation for onward movement. It is the service that dedicated facilities such as the MOSOLF site, with its warehouse space set aside for inspection and technical preparation, are built to perform at scale. Its share of vehicle count falls slowly as higher-value work grows faster.
Refurbishment and reconditioning is the largest service type by value across the forecast and the fastest-growing, covering cosmetic and mechanical restoration of used and trade-in vehicles to a saleable standard. The DP World and CARS24 facility at National Industries Park is the clearest dedicated commitment to this segment, designed for more than 100,000 vehicles a year with more than 140 internal checkpoints. Revenue per vehicle is several times the inspection rate, which is why the blended rate rises as this segment grows.
Accessory fitment and customisation covers destination-specification adjustment, protection packages, trim and equipment installation and the configuration work that adapts a vehicle built for one market to the expectations of another. Demand is driven by the re-export flow rather than by domestic sales, since a vehicle moving to a different regulatory and climatic environment requires adaptation that a domestically sold unit does not.
Export-ready preparation and documentation covers final condition verification, sealing and protection for onward shipment, and the compliance and documentation work attached to re-export. The segment grows with re-export volume and with the complexity of destination-market requirements, and it is the service most closely tied to free-zone customs treatment, since the documentation advantage is what makes processing in the Emirates preferable to processing at destination.
Import for domestic distribution covers vehicles landed in the Emirates for sale within the country, and represents the majority of arriving volume given that imports accounted for 65% of Jebel Ali's vehicle throughput in the first half of 2025. Processing intensity per vehicle is comparatively low, because distributors perform much of the preparation in-house and because no destination-market adaptation is required.
Re-export and transhipment covers vehicles that pass through the Emirates toward Africa, the Levant, Central Asia and the wider region. Processing intensity per vehicle is the highest of the three flows, because these vehicles require specification adaptation, documentation and condition preparation for onward markets. The segment is the reason processing demand in the Emirates is structurally larger than domestic vehicle sales would suggest.
Domestic used and trade-in vehicles enter processing from local trade rather than from the port, and generate the highest revenue per unit through full reconditioning. The segment grows with the used-vehicle marketplace and auction infrastructure being built around Jebel Ali and the Dubai Auto Market, and it is the flow least exposed to shipping route diversion because its supply originates inside the country.
Internal combustion vehicles account for the majority of processed volume throughout the forecast, reflecting the composition of both the import and re-export flows. Processing requirements are well established, competition is broadest and revenue per vehicle is the lowest of the three powertrain categories, making this the segment where price pressure from new capacity appears first.
Battery electric vehicles are the fastest-growing powertrain segment in processing, requiring state-of-charge management during storage, battery-state assessment before sale, specific handling and fire-safety protocols and software configuration. A single manufacturer moved 6,068 electric vehicles through Khorfakkan on a new direct service from Shenzhen in August 2026, indicating the scale at which electric volume now arrives. Revenue per vehicle is materially above the internal combustion rate.
Hybrid and plug-in hybrid vehicles occupy an intermediate position, requiring battery and high-voltage system checks without the full storage-management and safety protocol burden of battery electric units. The segment grows with the powertrain mix of Chinese and Japanese export volume into the region and represents a capability step that providers typically acquire before committing to full battery electric handling.
Free zone logistics operators hold the largest share, combining storage, handling and processing under a single free-zone licence and customs treatment. Gallega, MOSOLF and Legend Holding all fit this pattern, entering processing from a logistics base rather than from an automotive service base. Their advantage is land, customs position and proximity to the quay; their constraint is technical depth in refurbishment work.
Manufacturer and distributor in-house operations perform preparation as part of the vehicle margin rather than as a sold service, and hold a substantial share of the total work performed while contributing little addressable revenue to third-party providers. Established Emirates distributor groups operate preparation centres of significant scale, and the boundary between in-house and outsourced preparation shifts with distributor economics rather than with capability.
Independent refurbishment and marketplace operators grow fastest across the forecast, entering from the used-vehicle trading side and integrating reconditioning with the sale channel. The DP World and CARS24 arrangement is the clearest example, pairing a port and free-zone landlord with a marketplace operator that captures the value uplift reconditioning creates rather than charging a fee for the work.
By Geography
Jebel Ali and Jafza
Jebel Ali and the surrounding free zone hold the dominant share throughout, and every dedicated facility announced between October 2025 and May 2026 was sited there or adjacent to it. The free zone hosts more than 940 automotive companies from 88 countries and facilitated close to 48% of Dubai automotive trade by value in 2024. Port storage capacity rose 21% to 75,000 car equivalent units with the addition of a 2.6 million square foot yard, and 800 metres of quay allow three roll-on roll-off vessels to work simultaneously.
National Industries Park and Dubai Mainland
National Industries Park and the wider Dubai mainland form the second cluster, anchored by the AED 55 million DP World and CARS24 refurbishment facility designed for more than 100,000 vehicles annually from August 2026. The 22 million square foot Dubai Auto Market announced in November 2025, with more than 1,500 showrooms, workshop zones, an auction house and customs facilities, will add trade-linked reconditioning demand at a scale no other location in the region can match.
Sharjah and Khorfakkan
Sharjah and Khorfakkan grow fastest from a small base, benefiting from a position outside the Strait of Hormuz that became commercially material during 2026. Khorfakkan handled around 24,700 vehicles by August 2026, including 6,068 electric vehicles moved by a single manufacturer on a new direct service from Shenzhen that reportedly cut sea transit by three to five days. Processing capability there remains thin relative to the volume now arriving.
Abu Dhabi
Abu Dhabi holds a modest share, serving domestic distribution into the capital and industrial vehicle flows rather than the re-export trade that drives processing intensity. Its position strengthens gradually with industrial and logistics development, but the automotive trading and free-zone cluster that generates processing demand remains concentrated in Dubai.
Rest of the United Arab Emirates
The remaining emirates hold a negligible share throughout. Vehicle processing economics require proximity to a port, free-zone customs treatment and a concentration of trade counterparties, and that combination exists in two locations. Capacity built elsewhere would compete on land cost against a cluster whose advantage is customs position and counterparty density, neither of which is replicable by price.
How Competition Is Evolving
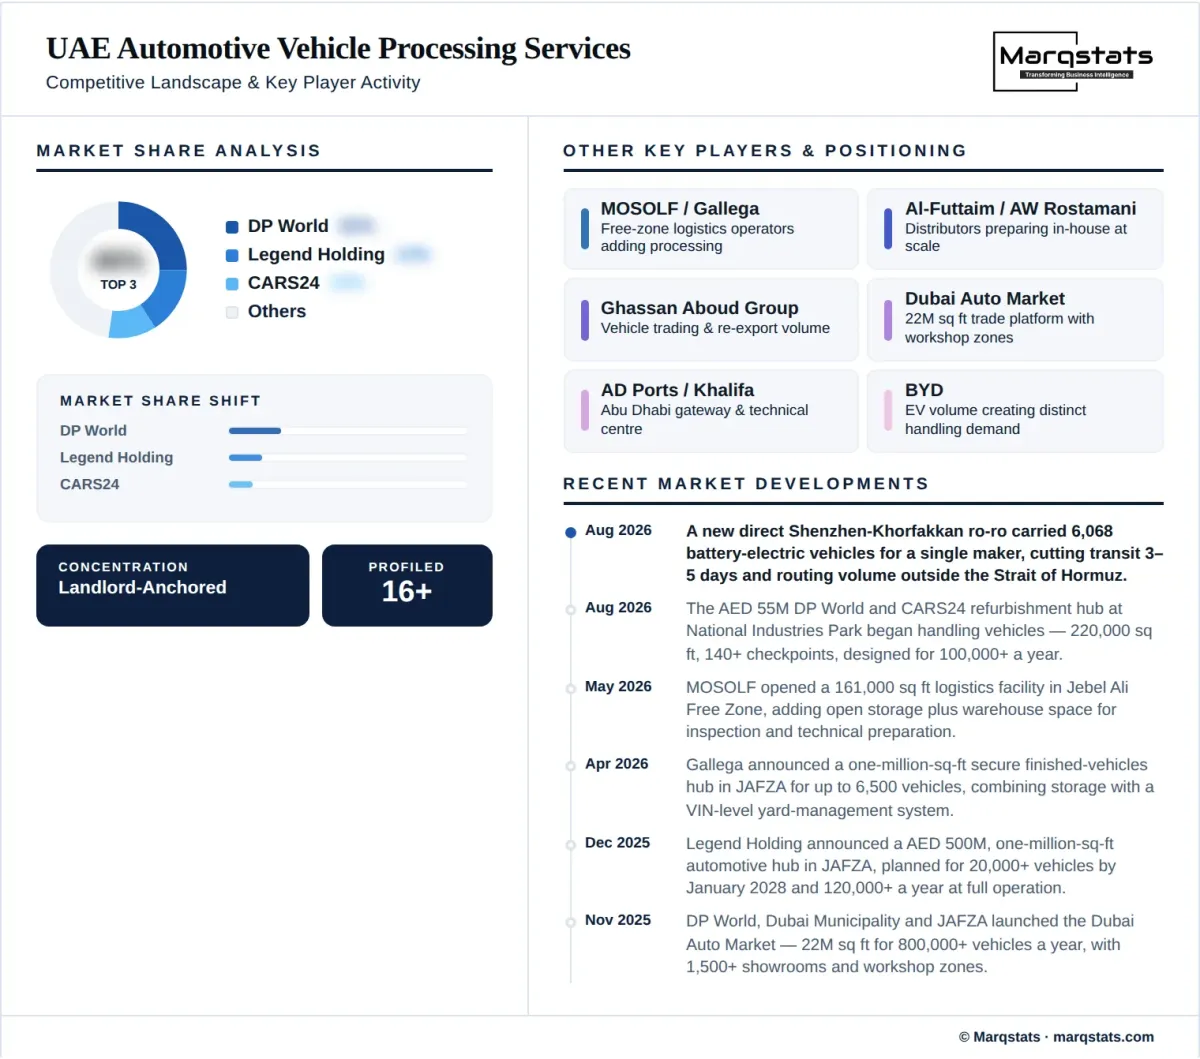
The market is moderately fragmented and reorganising rapidly, with the landlord and port operator occupying the position of greatest structural advantage. DP World controls the quay, the free-zone land, the National Industries Park site and the Dubai Auto Market development, and participates in processing through partnership rather than by competing with its own tenants. That position allows it to select which operators receive capacity and on what terms, and it is more durable than any individual facility.
Below the landlord, three groups compete without directly overlapping. Free-zone logistics operators including MOSOLF, Gallega and Legend Holding entered from a storage and handling base and are building processing capability onto it, with Legend Holding's AED 500 million commitment the largest single investment announced. Established distributor groups perform preparation in-house at scale and rarely sell it. Marketplace and refurbishment specialists such as CARS24 enter from the trading side and integrate reconditioning into the sale channel, which is a different business model rather than a competing bid for the same contracts.
The near-term competitive pressure is utilisation rather than price at the top of the market. Announced dedicated capacity exceeds 220,000 vehicles a year by 2028 from two facilities alone, against 172,000 vehicles processed across the whole market in 2025. Basic preparation work is the most substitutable and will absorb the discounting; refurbishment, electric vehicle handling and export documentation are harder to replicate and should hold rate. Providers that entered on land and storage economics without technical depth are the most exposed, and consolidation is more likely to arrive through capacity being re-let than through acquisition.
Companies Covered
The report profiles 16+ companies with full strategy and financials analysis, including:
Recent Market Activity
Table of Contents
Coverage & Segmentation
The study covers the United Arab Emirates with cluster-level detail for Jebel Ali and the free zone, National Industries Park and the Dubai mainland, Sharjah and Khorfakkan, Abu Dhabi, and the remaining emirates. It measures vehicles receiving paid value-added processing as the primary unit and annual processing service revenue in United States dollars as the secondary measure, against a reference series for total finished-vehicle throughput. The base year is 2025, the historical period covers 2023 to 2025, and the forecast period runs from 2026 to 2030 with an indicative 2031 endpoint. Segmentation covers service type, vehicle flow, powertrain and provider type.
Three exclusions define the boundary and one of them is the principal sizing risk. Port handling, ocean and roll-on roll-off freight, inland transport and storage rental are excluded and belong to finished vehicle logistics; this market measures work performed on the vehicle, not movement of it. Vehicle trading margin is excluded, including the uplift a refurbished vehicle earns on resale, since that accrues to the trader rather than to the processing service. Aftermarket maintenance and repair on registered vehicles in use is excluded. Most importantly, the market must not be sized against total port throughput: 1,240,000 vehicles were handled in 2025 against 172,000 that received paid processing, and equating the two overstates the market roughly sevenfold.