Market Snapshot
Key Takeaways
Market Overview & Analysis
Report Summary
The Middle East finished vehicle logistics market covers the movement of assembled vehicles through regional gateways and inland networks: quay and terminal handling on discharge and loading, yard and compound storage together with the processing performed there, inland and cross-border road transport, and the customs, documentation and transit work that accompanies both import and re-export. The measured unit is the vehicle movement, with duplicate handling of the same unit removed so that a vehicle discharged, stored and forwarded counts once.
Two economic models operate side by side in the region and they require different infrastructure. The United Arab Emirates functions as a hub, where throughput is driven by re-export and transshipment and where free-zone treatment, customs transit and short dwell determine competitiveness. Saudi Arabia functions on consumption scale, where volume is import-to-consumption and the requirement is distribution reach into a large domestic market rather than rapid onward movement. A facility designed for one model performs poorly in the other, and that distinction should precede any regional investment decision.
The commercial centre of gravity is shifting from transport toward integrated service. A stand-alone transport contract competes on rate against published tariffs and differentiates poorly, while an integrated port, yard, pre-delivery inspection and inland offer captures a vehicle across several revenue events and creates switching cost. Chinese manufacturers, whose frequent model launches make short dwell, vehicle-level visibility and fast re-export commercially valuable, are the customer group driving that shift most directly.
Finished-Vehicle Movements Through Middle East Gateways
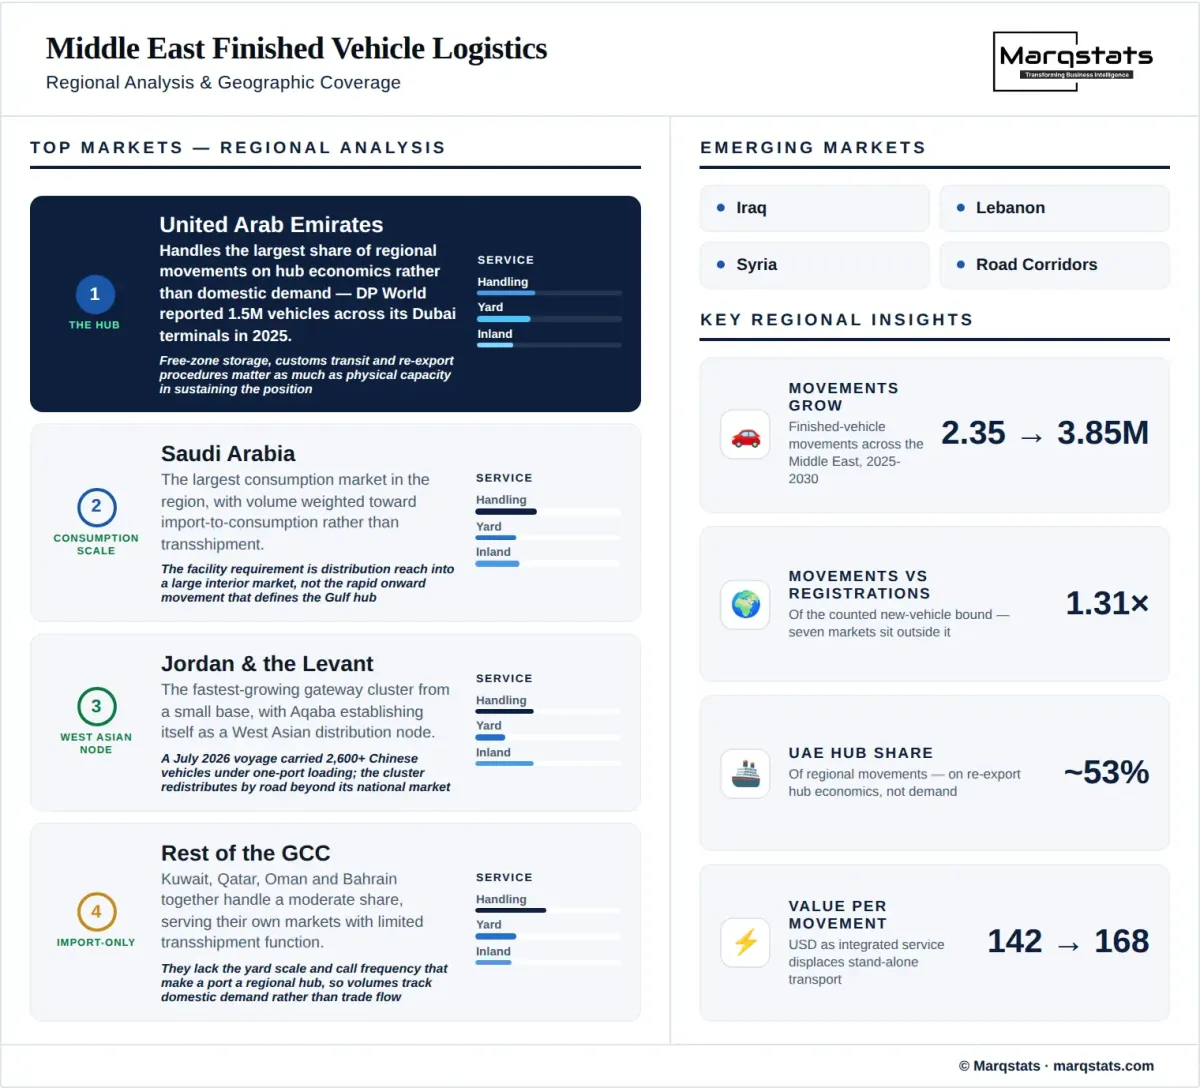
Finished-vehicle movements across the Middle East rise from 2.35 million in 2025 to 3.85 million by 2030, a 10.38% compound annual growth rate, with an indicative 2031 figure near 4.20 million. The series aggregates Gulf, Red Sea and Levantine gateways together with inland and cross-border distribution, net of repeat handling of the same unit.
The relationship between movements and registrations is the first thing to establish, because a registration-based estimate will understate this market substantially. The observable new-vehicle lower bound across the Gulf states and Israel is approximately 1.79 million units in 2025, and Iraq, Iran, Jordan, Lebanon, Syria, Palestine and Yemen fall outside that bound. Regional movements run roughly 1.31 times that figure, and the excess comprises imports into the uncounted markets together with re-export and transshipment volume that never becomes a registration anywhere in the region.
Two narrower studies measure components of this market. Gulf roll-on roll-off throughput accounts for approximately 79% of regional movements throughout the forecast, and United Arab Emirates finished-vehicle movements across all modes account for about 53% in 2025 falling to 50% by 2030. Those two overlap each other on Emirati roll-on roll-off volume, and their union covers roughly 88% of the regional total in 2025 declining to 87% by 2030. The balance is movement through non-Gulf gateways and non-roll-on roll-off modes outside the Emirates, and it is the fastest-growing part of the market.
Blended revenue per movement rises from USD 142 to USD 168, a 3.42% annual increase, which is why service value compounds at 14.15% against 10.38% growth in movements. The increase reflects service mix rather than tariff inflation. Terminal handling is priced against published rates and moves slowly, while yard storage with vehicle-level inventory control, pre-delivery inspection, technical preparation and customs handling carry materially higher rates, and regional capacity investment is weighted toward those activities.
Market Dynamics
Key Drivers
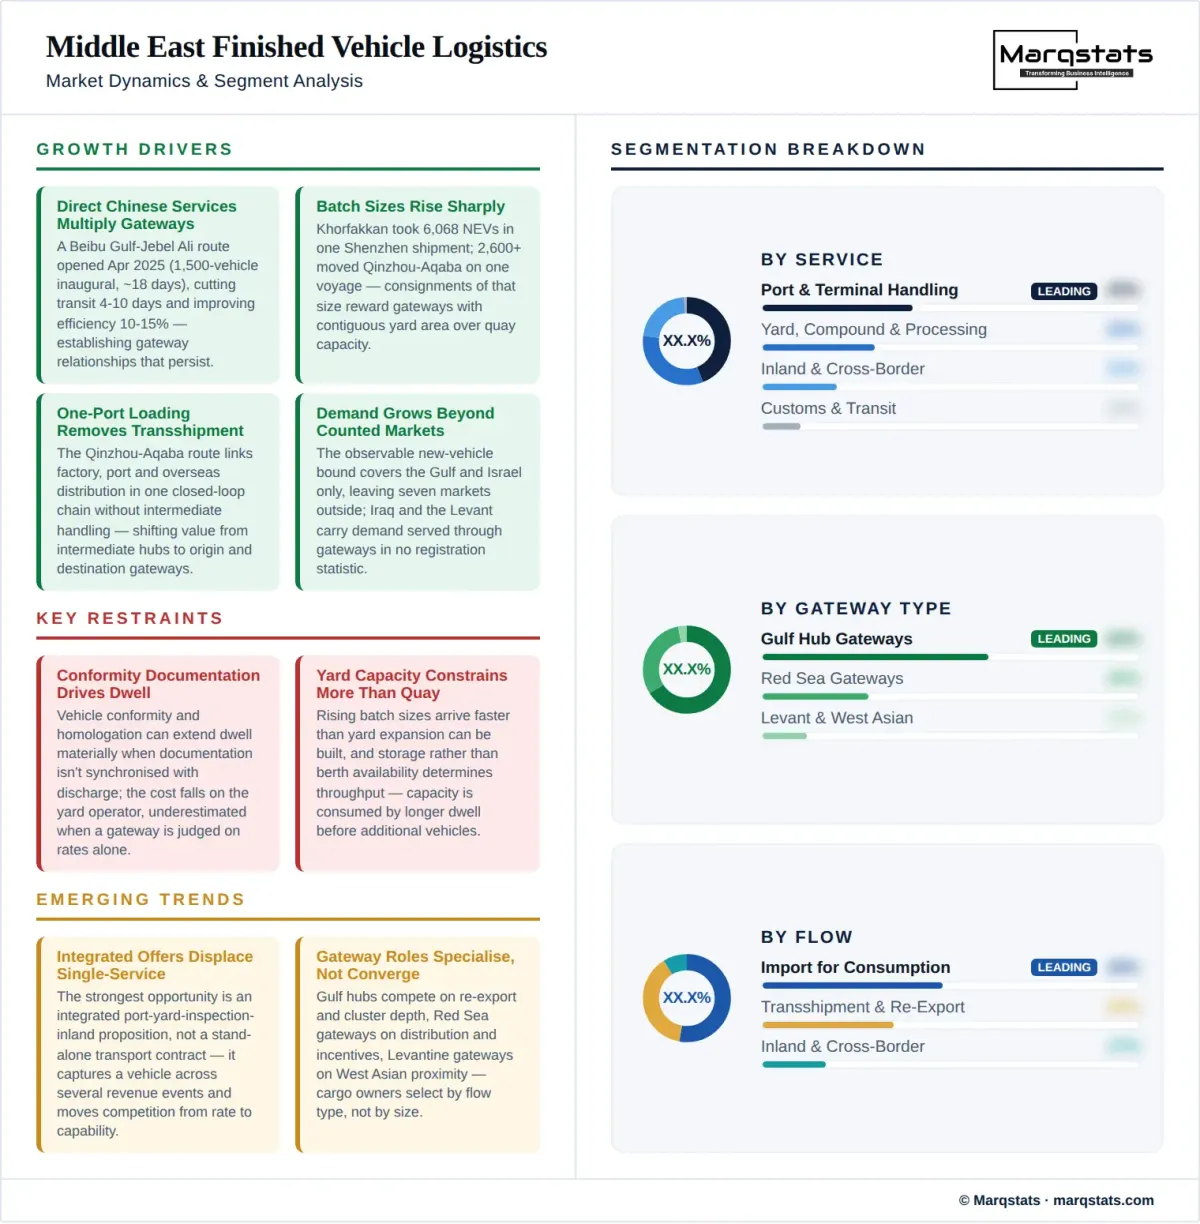
- Direct Chinese services multiplying regional gateways. A Beibu Gulf to Jebel Ali route opened in April 2025 with an inaugural 1,500-vehicle sailing across roughly 4,700 nautical miles in about eighteen days, cutting transit by four to ten days and improving logistics efficiency by a reported 10 to 15%. Direct services at that scale change route economics rather than adding volume to an existing pattern, and each new corridor establishes a gateway relationship that persists.
- Batch shipment sizes rising sharply. Khorfakkan received 6,068 new energy vehicles in a single shipment from Shenzhen in August 2026, and more than 2,600 Chinese-built vehicles moved from Qinzhou to Aqaba on one voyage in July 2026. Consignments of that size change yard planning, discharge sequencing and storage requirements, and they reward gateways with contiguous yard area over those with only quay capacity.
- One-port loading removing intermediate transshipment. The Qinzhou to Aqaba route uses a model that links factory, port and overseas distribution in a single closed-loop chain without intermediate handling. Removing a transshipment leg shortens transit, reduces damage exposure and lowers cost, and it shifts value from intermediate hub ports toward origin and destination gateways.
- Processing capacity arriving between discharge and delivery. MOSOLF opened a 161,000 square foot automotive logistics facility in Jebel Ali Free Zone in May 2026 combining open vehicle storage with an almost 11,000 square foot warehouse for pre-delivery inspection and technical preparation, at a point when Jebel Ali roll-on roll-off volumes were up 15% year on year. Capacity of this kind converts a transit event into a service relationship.
- Regional demand growing beyond the counted markets. The observable new-vehicle lower bound covers the Gulf states and Israel only, leaving seven regional markets outside it. Iraq and the Levant carry substantial vehicle demand served through gateways that appear in no registration statistic, and volume growth in those markets accrues to finished-vehicle logistics before it appears anywhere else.
Key Restraints
- Conformity documentation becoming a dwell driver. Vehicle conformity assessment and homologation can extend dwell materially when documentation and inspection are not synchronised with vessel discharge. The cost falls on the yard operator and the cargo owner rather than on the authority, and it is the constraint most often underestimated when a new gateway is evaluated on handling rates alone.
- Yard capacity constraining more than quay capacity. Rising batch sizes arrive faster than yard expansion can be planned and built, and storage rather than berth availability determines how much volume a gateway can absorb. Capacity added for growth is consumed by longer dwell before it is consumed by additional vehicles, so a capacity figure quoted without a dwell assumption overstates the throughput it supports.
- Electric vehicle handling requirements outpacing yard readiness. Battery state of charge management, damaged-battery procedures and yard fire safety are becoming operational requirements as new energy vehicle share rises in imported flows. The region needs more electric-vehicle-ready yards with charging, battery isolation and vehicle-level software integration, and the investment generates compliance capability rather than additional revenue per vehicle.
- Stand-alone transport competing on rate alone. A transport contract without yard, processing or customs capability attached competes against published tariffs with no differentiation, which caps margin on the largest single service by volume. Operators seeking returns must integrate across the chain, and that requires land, capital and capability that a haulage business does not hold.
Key Trends
- Integrated offers displacing single-service contracts. The strongest regional opportunity is an integrated port, yard, pre-delivery inspection and inland proposition rather than a stand-alone transport agreement. Integration captures a vehicle across several revenue events, creates switching cost for the cargo owner and moves the competitive basis from rate to capability.
- Vehicle-level visibility becoming a procurement requirement. Chinese manufacturers operating frequent model launches value short dwell, vehicle identification number visibility and fast re-export, and increasingly specify all three. Systems that make vehicle-level status visible to a cargo owner before and during transit are shifting from differentiator to condition of doing business at scale.
- Gateway roles specialising rather than converging. Gulf hubs compete on re-export capability and cluster depth, Red Sea gateways on domestic distribution reach and transit incentives, and Levantine gateways on proximity to West Asian demand. Those are different propositions rather than variants of one, and cargo owners are increasingly selecting among them by flow type rather than defaulting to the largest port.
- Processing capacity concentrating in free zones rather than dispersing. Value-added handling capability is being built inside free-zone estates adjacent to the quay rather than at inland locations, because customs treatment and proximity to discharge matter more than land cost for vehicles destined onward. That concentration reinforces existing hub positions even as gateway competition intensifies.
Market Segmentation
Port and terminal handling is the largest service by both movement count and revenue throughout, covering discharge and loading, quay-to-yard movement, lashing and vessel operations. It is also the most commoditised, priced against published terminal tariffs, and its revenue share declines gradually across the forecast as higher-value services grow faster around it.
Yard, compound and processing is the fastest-growing service and the one attracting most regional investment, covering storage, vehicle-level inventory control, pre-delivery inspection and technical preparation. Facilities combining storage with dedicated preparation space, as at the Jebel Ali Free Zone site opened in May 2026, define the segment's direction, and rates sit materially above handling.
Inland and cross-border transport covers car-carrier movement between gateways, compounds and dealer networks, and across land borders into markets without their own deep-water vehicle capability. The segment grows faster than movements because gateway dispersal lengthens average inland legs and because Levantine and Iraqi demand is served substantially by road from coastal gateways.
Customs, documentation and transit processing covers declaration handling, free-zone entry and exit, re-export documentation and transit procedures across multiple customs territories. Revenue per movement is modest but the activity applies to essentially every unit, and its importance exceeds its revenue share because documentation timing is a principal determinant of dwell.
Import for domestic consumption is the largest flow by movement count, dominated by Saudi Arabia's large domestic market and by demand in Iraq, the Levant and the smaller Gulf states. Dwell is comparatively predictable because it follows distributor sales cycles, and service intensity per vehicle is moderate with the inland leg carrying most of the value beyond handling.
Transshipment and re-export covers vehicles passing through regional gateways toward Africa, Central Asia, the subcontinent and other destinations, and it is the flow that makes regional movements exceed regional registrations. Dwell is longer and more variable because onward movement depends on destination credit, documentation and vessel availability, making this the least predictable consumer of yard capacity.
Inland and cross-border distribution covers movement between regional markets by road, including volume landed at one country's gateway for sale in another. The segment grows fastest as gateway specialisation separates the point of discharge from the point of sale, and it is the mechanism through which landlocked and gateway-poor markets are served.
Gulf hub gateways handle the largest share of regional movements, combining deep quay capacity, extensive yard area, free-zone customs treatment and the densest processing cluster in the region. Their economics rest on re-export and transshipment rather than on domestic consumption, which makes their throughput structurally larger than the vehicle demand of the countries they sit in.
Red Sea gateways serve a large domestic market together with Red Sea and East African transshipment, and grow strongly across the forecast on transit incentives and port modernisation. Their competitive position rests on dwell cost and distribution reach into the interior rather than on hub cluster depth, which is a materially different proposition from the Gulf model.
Levantine and West Asian gateways are the smallest by volume and the fastest-growing, with Aqaba receiving more than 2,600 Chinese vehicles on a single voyage in July 2026 under a one-port loading model. Their role extends beyond their own national markets, serving West Asian redistribution by road into territories with limited or no direct vehicle-handling capability.
Direct services from Chinese ports are the fastest-growing origin corridor and the one reshaping regional gateway competition. Routes from Beibu Gulf to Jebel Ali and from Qinzhou to Aqaba, together with the Shenzhen to Khorfakkan service, have opened within eighteen months, each cutting transit and each establishing a gateway relationship that persists beyond the inaugural sailing.
Northeast and Southeast Asian origins remain the largest corridor by volume, covering established Japanese, Korean and Thai export flows on liner schedules with long-standing regional gateway relationships. Growth is steady rather than rapid, and the corridor's importance is stability: it underpins the base load against which newer direct services are incremental.
European, American and other origins account for a smaller share weighted toward premium and specialist vehicles with higher value per unit. Service frequency is lower and consignment sizes smaller, which raises handling cost per vehicle but also supports higher-value preparation and inspection work at destination.
By Geography
United Arab Emirates
The United Arab Emirates handles the largest share of regional movements on hub economics rather than domestic demand. DP World reported 1.5 million vehicles across its Dubai terminals in 2025 with Jebel Ali accounting for close to 1.1 million, and roll-on roll-off volumes were up 15% year on year when new processing capacity was announced. Free-zone storage, customs transit and re-export procedures matter as much as physical capacity in sustaining that position.
Saudi Arabia
Saudi Arabia is the largest consumption market in the region and grows strongly across the forecast, with volume weighted toward import-to-consumption rather than transshipment. Transit incentives and port modernisation support Red Sea competitiveness, and the facility requirement is distribution reach into a large interior market rather than the rapid onward movement that defines the Gulf hub model.
Jordan and the Levant
Jordan and the Levant are the fastest-growing gateway cluster from a small base, with Aqaba establishing itself as a West Asian distribution node. A July 2026 voyage carried more than 2,600 Chinese-built vehicles from Qinzhou under a one-port loading model that removed intermediate transshipment. The cluster's significance exceeds its national markets because it redistributes by road into territories without comparable gateway capability.
Rest of the GCC
Kuwait, Qatar, Oman and Bahrain together handle a moderate share, serving their own markets with limited transshipment function. Roll-on roll-off economics reward concentration, and these gateways lack the yard scale and call frequency that make a port a regional hub, so their volumes track domestic vehicle demand rather than trade flow.
Rest of the Middle East
The remaining regional markets hold a modest but growing share, and they are the least precisely measured part of the estimate because most fall outside the observable new-vehicle bound entirely. Iraq carries substantial demand served through neighbouring gateways and by road, and volume there accrues to finished-vehicle logistics before it appears in any registration statistic.
How Competition Is Evolving
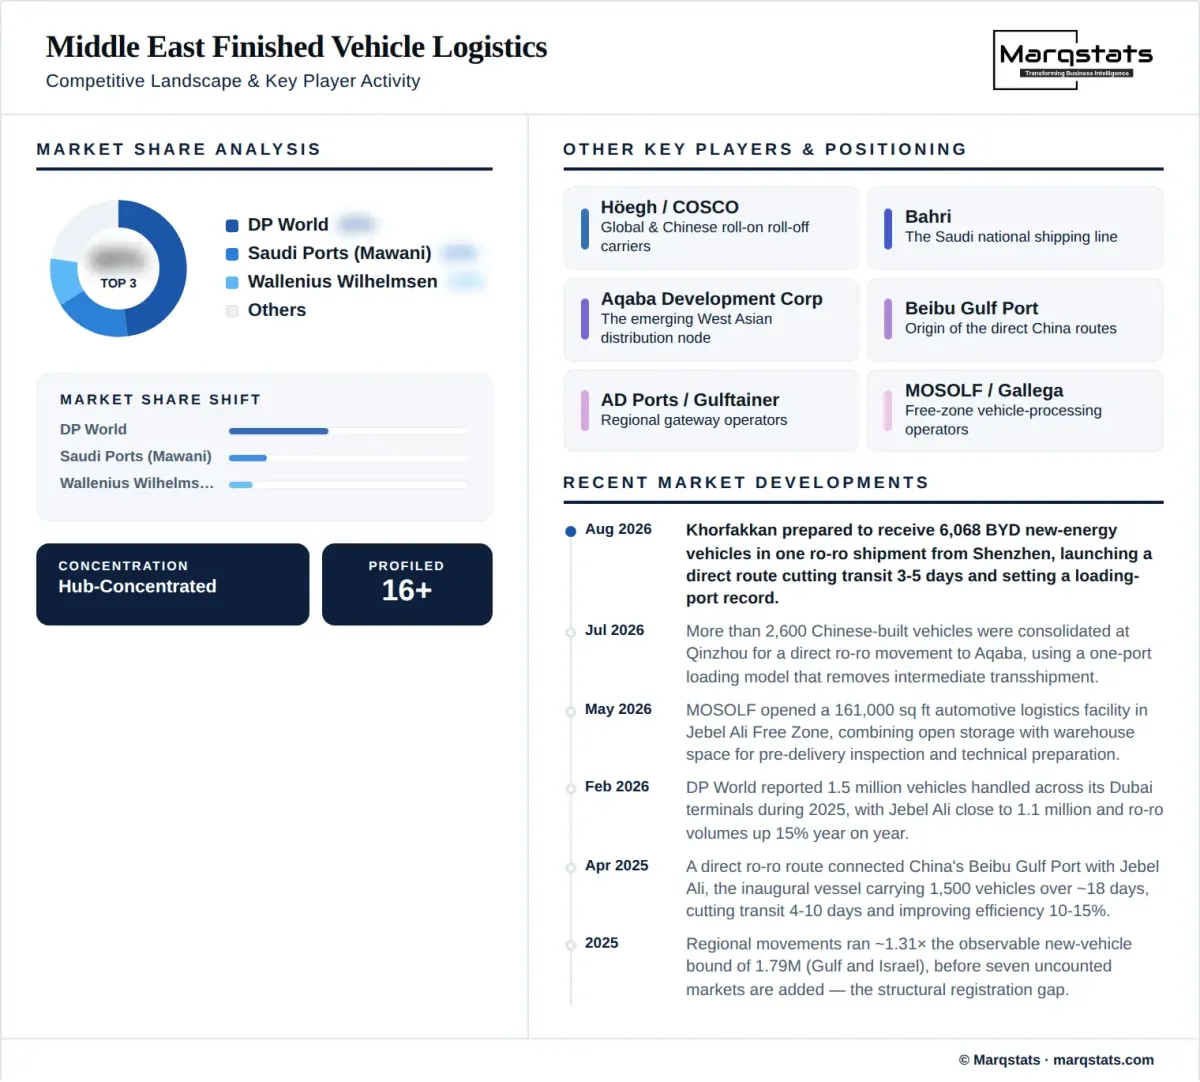
The market is concentrated at the largest gateways and fragmented across everything downstream of them. One operator handles the largest single share of regional volume through the Dubai port system while also controlling the free-zone land on which the surrounding processing cluster has been built, and that combination of quay and hinterland remains the strongest position in the regional chain. Saudi gateway operators hold comparable positions within a larger consumption market and compete on transit cost and distribution reach rather than on cluster depth.
Carriers and route decisions increasingly determine which gateways compete at all. Direct services from Chinese ports have opened three new or strengthened corridors within eighteen months, and each was a routing decision taken by a carrier and a cargo owner rather than won by a port on its handling rates. A gateway without the yard area to absorb a 6,068-vehicle consignment or the customs capability to clear it quickly is not in contention regardless of its tariff, which places route planning at the point of competitive decision.
The durable advantage is integration rather than scale at any single stage. An operator combining terminal access, yard capacity, pre-delivery inspection and inland distribution captures a vehicle across several revenue events and holds it through switching cost, while a participant present at only one stage competes on rate. That is why processing capacity is being built inside free zones adjacent to the quay, and why the strongest regional propositions increasingly span the whole chain from discharge to dealer rather than a single link in it.
Companies Covered
The report profiles 16+ companies with full strategy and financials analysis, including:
Recent Market Activity
Table of Contents
Coverage & Segmentation
The study covers the Middle East with country and cluster-level detail for the United Arab Emirates, Saudi Arabia, Jordan and the Levant, the rest of the Gulf Cooperation Council, and the remaining regional markets. It measures annual finished-vehicle movements as the primary unit and annual service revenue in United States dollars as the secondary measure. The base year is 2025, the historical period covers 2023 to 2025, and the forecast period runs from 2026 to 2030 with an indicative 2031 endpoint. Segmentation covers service, flow, gateway type and origin corridor.
Four boundaries define the market. Ocean freight revenue is excluded because it is earned by carriers largely outside regional jurisdiction, while the terminal, yard, inland and documentation services those vessels generate inside the region are included. Vehicle conformity assessment as a regulatory activity is excluded, though its effect on dwell is analysed. Vehicle trading margin and aftermarket service are excluded. Movements are counted net of repeat handling, so a vehicle discharged, stored and re-exported counts once rather than at each handling event.
Two narrower studies measure components of this market at their own scales. Gulf roll-on roll-off throughput represents approximately 79% of regional movements, and United Arab Emirates finished-vehicle movements across all modes represent about 53% falling to 50%. Those two overlap each other on Emirati roll-on roll-off volume, so their figures cannot be added to one another, and neither can be added to the regional total reported here.