Market Snapshot
Key Takeaways
Market Overview & Analysis
Report Summary
The UAE used car import and re-export market comprises the inbound trade value and unit volume of used passenger vehicles entering the United Arab Emirates under customs heading 8703, together with analysis of the onward re-export leg that carries a majority of those vehicles to third countries. Market size is measured on the inbound leg to avoid double-counting: the same physical vehicle appears twice if the import and re-export legs are added, so the re-export flow is a destination split within the inbound total rather than incremental market value. On that basis the market stood at USD 4.35 billion and 591,161 units in 2025.
No customs classification anywhere in the world separates used from new vehicles inside passenger-car headings, and the UAE does not publish shipment-level customs data. Every figure is therefore constructed rather than looked up, and the construction is disclosed in full. Two independent signals separate used from new: average unit value per origin at six-digit line level, and shipment-description evidence from trade records. Their discriminating power is best seen inside a single origin. Japan's 2025 exports to the UAE include 38,239 units of petrol vehicles above 3,000 cc at USD 46,834 per unit — new Land Cruiser and Lexus LX stock destined for franchised dealers — alongside 87,013 hybrid units at USD 6,151 per unit, which is used Prius and Aqua auction inventory. Same origin, same year, same reporting authority; only unit value separates them.
The method also guards against the most expensive error in used-vehicle trade analysis, which is treating low unit value as proof of used status. India shipped 81,022 passenger cars to the UAE in 2025 at an average USD 6,328 per unit, a figure that reads as auction stock but is in fact new small-car output from Indian export plants; only 2% is assessed as used. China was the UAE's single largest origin by units at 571,937 vehicles, of which 191,946 were new-energy vehicles, but at an implied USD 13,389 per unit that is a new-vehicle export programme and only about 5% is assessed as used. Screening on price alone would have added more than 130,000 phantom used vehicles to the total.
A second measurement boundary matters as much as the first. The UAE did not report its own 2025 annual trade statistics to the international database at the time of extraction, so all import figures are mirror data — reconstructed from what 53 partner countries declared exporting to the UAE, supplemented by a China anchor from national association statistics and by shipment-level records. Mirror data is measured free-on-board at origin rather than landed at destination, and it captures nothing from origins that do not report. Fourteen origins carry quantities estimated by the statistics division rather than reported. These are stated as limitations rather than smoothed away, because the direction of the resulting bias is understatement, not overstatement.
Used Car Import Volume and Unit Forecast
Inbound used-vehicle volume into the United Arab Emirates reached 591,161 units in 2025 and is forecast to reach 755,000 units by 2030, a 5.01% compound annual growth rate. The path is not smooth. The 2026 estimate of 455,000 units sits 23% below 2025, because the Strait of Hormuz disruption cut Jebel Ali container throughput by 60% in the first half of 2026 and reduced Japanese used-vehicle exports to the UAE by roughly 65% across January to May, with March recording 1,499 units against 18,023 in February.
Unit volume and trade value compound at different rates, 5.01% against 7.48%, because the blended landed value per imported vehicle rises from USD 7,357 to USD 8,265 as the age and specification mix shifts toward newer stock. Volume also divides along a hard regulatory line rather than a commercial one: 266,980 of the 591,161 units imported in 2025, or 45.16%, arrived from right-hand-drive origins and cannot be registered for UAE road use, so that volume is re-export inventory by law. Japan and the United States together supplied 503,266 used units, 85.1% of the total, and the two are not substitutable because right-hand-drive demand cannot be served from left-hand-drive stock.
Market Dynamics
Key Drivers
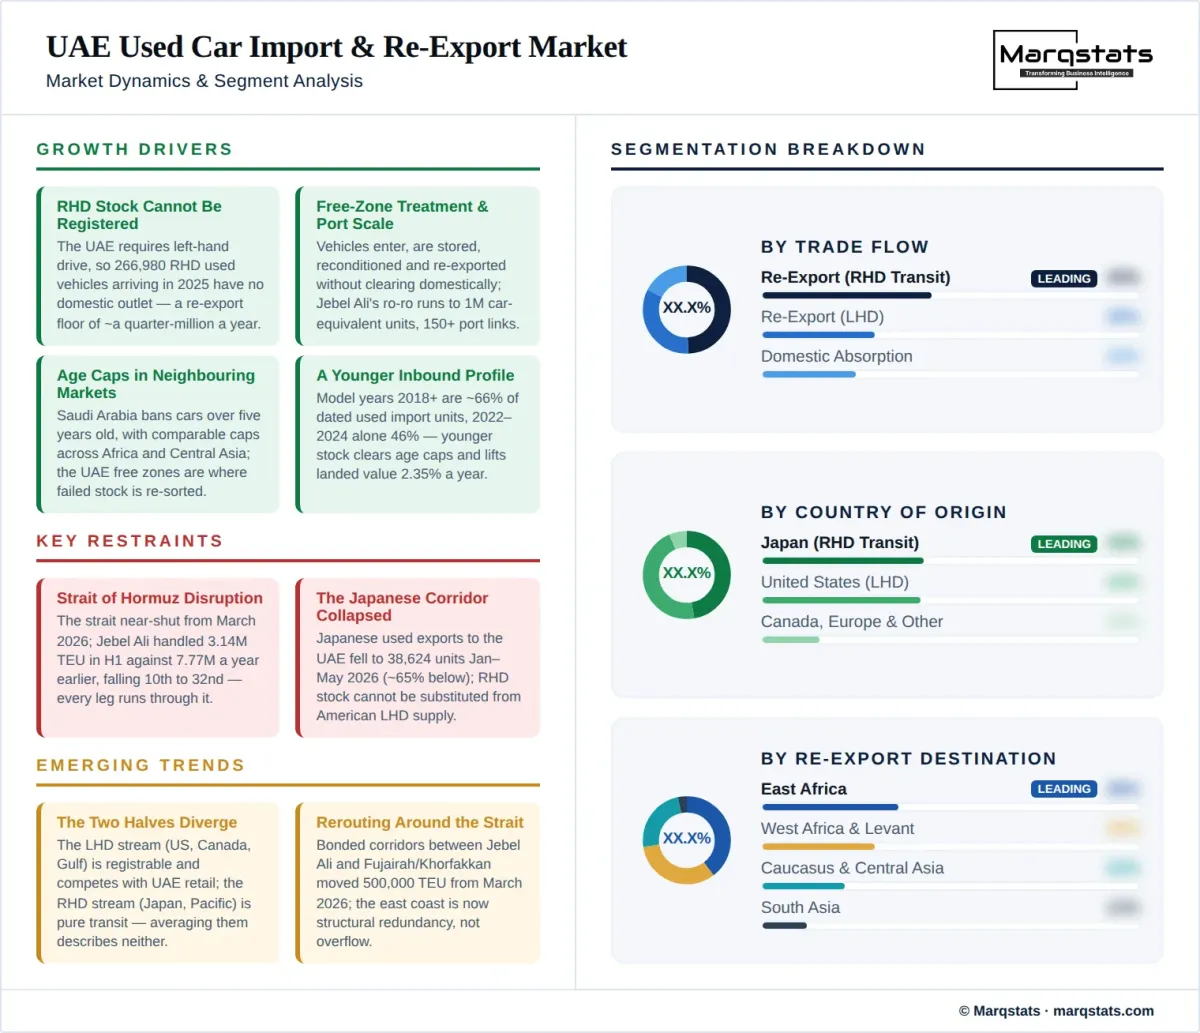
- Regulatory exclusion of right-hand-drive stock from domestic sale. Because the UAE requires left-hand-drive configuration for road registration, the 266,980 right-hand-drive used vehicles arriving in 2025 have no domestic retail outlet and must be re-consigned. This is not a market preference that can shift; it is a registration rule, and it guarantees a re-export flow of roughly a quarter-million vehicles a year independent of UAE consumer demand.
- Free-zone customs treatment and port infrastructure. Vehicles can enter, be stored, inspected, reconditioned and re-exported without clearing into the domestic market. Jebel Ali's roll-on/roll-off capacity runs to one million car equivalent units with 27,000 units of quayside storage and connections to more than 150 ports, while the free zone hosts automotive companies from 70 countries. That combination is what makes consolidation economics work at scale.
- Age restrictions in neighbouring import markets. Saudi Arabia prohibits the import of cars more than five years old, and comparable age caps operate across several African and Central Asian destinations. Vehicles that fail one market's age test are re-sorted toward another, and the UAE's free zones are where that sorting physically happens — which is precisely why a hub with no domestic demand for the stock still attracts it.
- A younger inbound age profile than the trade assumes. Model years 2018 and newer make up roughly 66% of dated used import units, with 2022–2024 alone at 46%. Younger stock clears the age caps in restrictive destination markets, carries higher landed value and supports the 2.35% annual increase in blended unit value across the forecast period.
- Structural demand growth in destination markets. East and West African, Caucasus and Central Asian vehicle parcs are expanding from low bases with limited domestic assembly, and their fleets are supplied almost entirely by imported used vehicles. The transit hubs that serve them — Poti and Batumi for the Caucasus, Mombasa and Dar es Salaam for East Africa — draw stock consolidated in the UAE.
Key Restraints
- Strait of Hormuz disruption. The strait came close to shutting from March 2026 before partially and unevenly reopening in June. Jebel Ali handled 3.14 million TEU in the first half of 2026 against 7.77 million a year earlier, a decline of nearly 60%, with second-quarter throughput down more than 90% year on year, and the port fell from tenth to thirty-second in the global rankings. Every leg of this market runs through that corridor.
- Collapse of the Japanese corridor. Japanese used-vehicle exports to the UAE fell to 38,624 units across January–May 2026, roughly 65% below the prior year, with March at 1,499 units against 18,023 in February. The UAE dropped from Japan's number-one used-vehicle destination to third behind Russia at 84,328 units and Tanzania at 74,486. Because Japanese stock is right-hand-drive, the lost volume cannot be substituted from American supply.
- Mirror-data blindness and the absence of an official series. The UAE publishes no shipment-level customs data and reported no 2025 annual statistics to the international database, so no participant in this market can observe it directly. Twelve partner countries including China, Qatar, Oman, Iraq, Russia and Viet Nam had made no 2025 submission at extraction, and re-export volumes are not netted out of any published figure.
- Destination-market policy risk. Age caps, emissions standards, steering-configuration rules and outright import bans in destination markets can close a corridor with little notice, and the vehicles already consolidated in a UAE free zone for that destination become distressed inventory. The concentration of demand in a small number of African and Central Asian markets makes this a live rather than theoretical exposure.
Key Trends
- Divergence between the two halves of the market. The left-hand-drive stream from the United States, Canada and the Gulf is domestically registrable and competes with UAE retail supply, while the right-hand-drive stream from Japan and the Pacific is pure transit. These halves respond to different shocks, price on different curves and serve different customers, and averaging them produces a number that describes neither.
- Value concentration in the European corridor. Europe is small in units but disproportionate in used value: shipment records value used-tagged German consignments at USD 177.8 million, Dutch at USD 72.8 million and Belgian at USD 37.2 million — nearly-new premium stock moving through Antwerp, Zeebrugge, Rotterdam and Bremerhaven at unit values five to ten times the Japanese average.
- Rerouting around the strait. Bonded road and rail corridors between Jebel Ali and the Gulf of Oman ports of Fujairah and Khorfakkan moved 500,000 TEU from March 2026, running roughly 3,000 truck movements a day with 700 additional trucks deployed. Fujairah's position outside the strait is converting it from an overflow facility into structural redundancy for vehicle as well as container traffic.
- Electrification reaching the transit stream. Used battery-electric vehicles are entering the flow at modest but growing scale — 3,238 units arrived from Japan in 2025 at an average USD 7,451, alongside a smaller higher-value European used-EV re-export flow. Destination-market charging availability, not vehicle supply, is the binding constraint on how fast this share grows.
Market Segmentation
Right-hand-drive vehicles account for 266,980 used units and USD 1.76 billion of landed value in 2025, or 45.16% of the used import stream. Japan alone supplies 252,382 of those units, with Singapore at 3,844, Australia at 3,507, New Zealand at 3,307, India at 1,620, the United Kingdom at 773 and Hong Kong at 468. Because the UAE drives on the right and requires left-hand-drive configuration for registration, none of this stock can be retailed to a domestic motorist outside the classic-vehicle exemption for cars roughly thirty years and older. The entire segment is transit inventory by regulatory definition.
Left-hand-drive vehicles account for 324,181 used units and USD 2.59 billion, or 54.84% of the stream. The United States dominates at 250,884 units, followed by Canada at 18,871, China at 28,597, Kuwait at 6,851, Saudi Arabia at 6,030, Germany at 3,081 and South Korea at 3,055. This is the only part of the import flow that can compete for UAE domestic retail demand, and it is therefore the segment where import supply and the domestic used-car market interact. Even here, a substantial share is re-consigned to left-hand-drive destination markets in West Africa, the Levant and Central Asia.
The inbound leg is the measurement basis for this market: 591,161 used passenger vehicles worth USD 4.35 billion in 2025, sitting inside a total passenger-car import flow of 1,418,773 units worth USD 22.51 billion. Used vehicles are 41.67% of inbound units but only 19.32% of inbound value, the arithmetic signature of a hub taking large volumes of low-value auction stock alongside smaller volumes of high-value new inventory. Blended landed value is USD 7,357 for used against USD 15,865 across all inbound passenger cars.
The re-export leg carries the majority of inbound used vehicles onward to third countries, and its floor is measurable at 266,980 units — the right-hand-drive stock that cannot legally remain. The true figure is higher, because left-hand-drive vehicles are also consolidated and re-consigned, but no public source nets re-export out of any import series and the UAE publishes no re-export unit statistics for vehicles. This report therefore states the regulatory floor as a hard number and the balance as a range rather than inventing a point estimate. Applying re-export rates of 40% to 60% to the left-hand-drive stream implies a total re-export flow between roughly 397,000 and 461,000 units in 2025, against a domestic used-car market of about 880,000 transactions.
Domestic absorption is the residual: left-hand-drive imported stock that clears into the UAE market and is retailed to a resident buyer. It is bounded above by the 324,181 left-hand-drive used units and is materially lower in practice. Imported vehicles must pass a product-status assessment before traffic registration, and non-GCC-specification vehicles carry documented exposure — around 26% of vehicle-report activity in one recent year involved non-GCC-spec cars. Absorbed imports add specification and price diversity to domestic supply but are a minority of it; the domestic market is fed principally by the resident parc and by fleet defleet.
Japan is the largest single used origin, supplying an estimated 252,382 used units within a total Japanese passenger-car flow of 311,583 units worth USD 3.73 billion, an assessed used share of 81%. The UAE was Japan's number-one used-vehicle destination worldwide in 2025, absorbing 231,203 units in the January–November period alone against a full-year total of approximately 252,600 — a figure that corroborates the independent estimate above to within one-tenth of one percent. The corridor then contracted violently: exports fell to 38,624 units across January–May 2026, roughly 65% below the prior year, with March at 1,499 units against 18,023 in February as vessels were delayed, diverted or unable to reach Dubai.
The United States is the second-largest used origin at an estimated 250,884 units within a total flow of 272,700 units worth USD 3.43 billion — an assessed used share of 92%, the highest of any major origin. Average unit value across the entire US flow is USD 12,572, and the largest single line is 221,141 units of petrol vehicles between 1,500 cc and 3,000 cc at USD 9,601 per unit, the signature of auction and salvage inventory rather than new-vehicle export. American stock is left-hand drive, so unlike the Japanese flow it is registrable in the UAE and competes directly with domestic retail supply.
Canada contributed an estimated 18,871 used units at an average USD 12,462 across its total flow of 22,201 units, an assessed used share of 85%. Its distinguishing feature is coding: 14,015 units were declared under the residual customs line at USD 5,670 per unit, which is the classic home for used vehicles that do not fit a specific subheading. Canada also ranked first among all origins by used-tagged shipment count at 565 records, more than Japan's 527, which reflects the depth of Canadian shipment-level export reporting rather than the true size of the flow.
This right-hand-drive Pacific tier supplies smaller volumes at very high assessed used shares: Australia 3,507 units at 90%, New Zealand 3,307 at 95%, Singapore 3,844 at 90% and Hong Kong 468 at 60%. Average unit values are the lowest in the dataset — USD 10,040 for Australia, USD 2,165 for New Zealand and USD 1,730 for Singapore — reflecting the absence of local assembly and, in Singapore's case, vehicles de-registered under the certificate-of-entitlement system. Every unit in this tier is transit inventory.
The European corridor is small in units but carries the highest used value density in the market. Shipment-level records value used-tagged German consignments at USD 177.8 million across 75 shipments, Dutch at USD 72.8 million across 33 and Belgian at USD 37.2 million across 50 — average consignment values of USD 2.37 million, USD 2.21 million and USD 744,000 respectively. Germany's total flow averages USD 71,832 per unit and is predominantly new, so its used share is assessed at only 12%, while the Netherlands and Belgium function as consolidation gateways rather than production origins and carry assessed used shares of 45% and 55%.
China was the UAE's largest origin by units in 2025 at 571,937 vehicles, making the UAE the third-largest destination for Chinese vehicle exports, of which 191,946 were new-energy vehicles. At an implied USD 13,389 per unit this is a new-vehicle export programme and only about 5% — an estimated 28,597 units — is assessed as used. Intra-GCC movement is a distinct phenomenon: Saudi Arabia at 6,030 used units and an assessed 35% share, and Kuwait at 6,851 units and 45%, both moving by land as well as sea and reflecting a mix of re-exported new stock and genuine used vehicles crossing borders.
Vehicles from model years 2022 to 2024 account for approximately 46% of dated units in the used import sample, the largest single cohort and the one that clears age restrictions in every major destination market. This is nearly-new stock: short-cycle lease returns, fleet defleet and early trade-ins from the origin markets. It carries the highest landed value in the flow and is the principal reason blended unit value is forecast to rise 2.35% annually to USD 8,265 by 2030.
The 2018 to 2021 cohort takes the used import profile to roughly 66% of dated units at model year 2018 and newer. Vehicles in this band sit at the boundary of the five-year age caps operated by several destination markets, which makes their routing highly sensitive to the month of shipment as well as the destination. They are the workhorse of the re-export trade: old enough to price competitively, young enough to clear most regulatory thresholds.
Vehicles older than model year 2018 account for approximately one-third of dated units. This cohort is excluded from Saudi Arabia and from other age-capped destinations, so it routes to markets without age restrictions, principally in East and West Africa and parts of Central Asia. It carries the lowest landed values in the flow and is where the classic assumption of end-of-life dumping actually holds — but on a minority of the volume, not the majority.
Petrol vehicles dominate the used import flow and will do so throughout the forecast period. The largest single line in the entire dataset is 221,141 units of American petrol vehicles between 1,500 cc and 3,000 cc at USD 9,601 per unit, followed by 82,845 Japanese units in the same displacement band at USD 10,909. Destination-market fuel infrastructure and servicing capability both favour petrol, and the segment is the least exposed to policy risk in importing countries.
Hybrid vehicles are the clearest single signature of used auction supply in the trade data. Japanese non-plug-in hybrid stock — Prius, Aqua and Corolla hybrid inventory — accounted for 87,013 units arriving in 2025 at USD 6,151 per unit, and a further 20,649 plug-in hybrid units arrived from the United States at USD 7,394. Hybrids combine low landed cost with fuel economy that matters disproportionately in destination markets where fuel is expensive relative to income.
Used battery-electric vehicles are a small but structurally interesting part of the flow: 3,238 units from Japan at USD 7,451 per unit, 1,127 from the United States at USD 33,505 and 128 from Canada at USD 7,155, alongside a higher-value European used-EV re-export stream. The constraint on growth is not vehicle availability but destination-market charging infrastructure and battery-health verification, neither of which the trade currently prices reliably.
Diesel passenger vehicles are a marginal share of the flow. Japan supplied 8,140 units above 2,500 cc at USD 28,918 per unit and 1,385 units in the 1,500 to 2,500 cc band at USD 5,010, while American diesel volumes are negligible. The segment's relevance is concentrated in older large SUVs routed to markets where diesel infrastructure and relative fuel pricing remain favourable.
East Africa is the principal destination for right-hand-drive stock consolidated in the UAE, serving Kenya, Tanzania and Uganda through Mombasa and Dar es Salaam. The corridor is visible in the trade data in both directions: Kenya appears among the top origins by used-tagged shipment count at 54 records and Tanzania at 14, reflecting return and repositioning movements alongside the dominant outbound flow. Tanzania's emergence as Japan's second-largest used-vehicle destination at 74,486 units in the first five months of 2026 shows demand rerouting directly to origin when the UAE hub is disrupted.
West Africa and the Levant take predominantly left-hand-drive stock, which places them in direct competition with UAE domestic absorption for the American and Canadian flow. Ghana, Benin, Cameroon, Congo and Libya all appear in the shipment records at low volumes, as do Iraq, Jordan and Lebanon. These destinations generally operate looser age restrictions than the Gulf, which makes them the natural home for the pre-2018 cohort.
Georgia is the analytical marker for this corridor: it carries an assessed used share of 85% on its own inbound flow, and Poti and Batumi function as the transit points onward to Armenia, Azerbaijan and Central Asia. Kazakhstan, Uzbekistan and Armenia all appear in the shipment records, and Mongolia's sharp growth as a direct Japanese destination in 2026 indicates the same demand pool sourcing around the Gulf when the corridor is constrained.
Sri Lanka and Pakistan take right-hand-drive stock and appear in the trade records at modest volumes, with Sri Lanka ranking fourth among Japan's direct destinations at 32,398 units in the first five months of 2026. This corridor competes with the UAE hub rather than depending on it: when freight economics or currency movements favour direct shipment from Japan, volume bypasses Dubai entirely, which is one reason UAE inbound volume is more variable than destination demand.
By Geography
Dubai and Jebel Ali
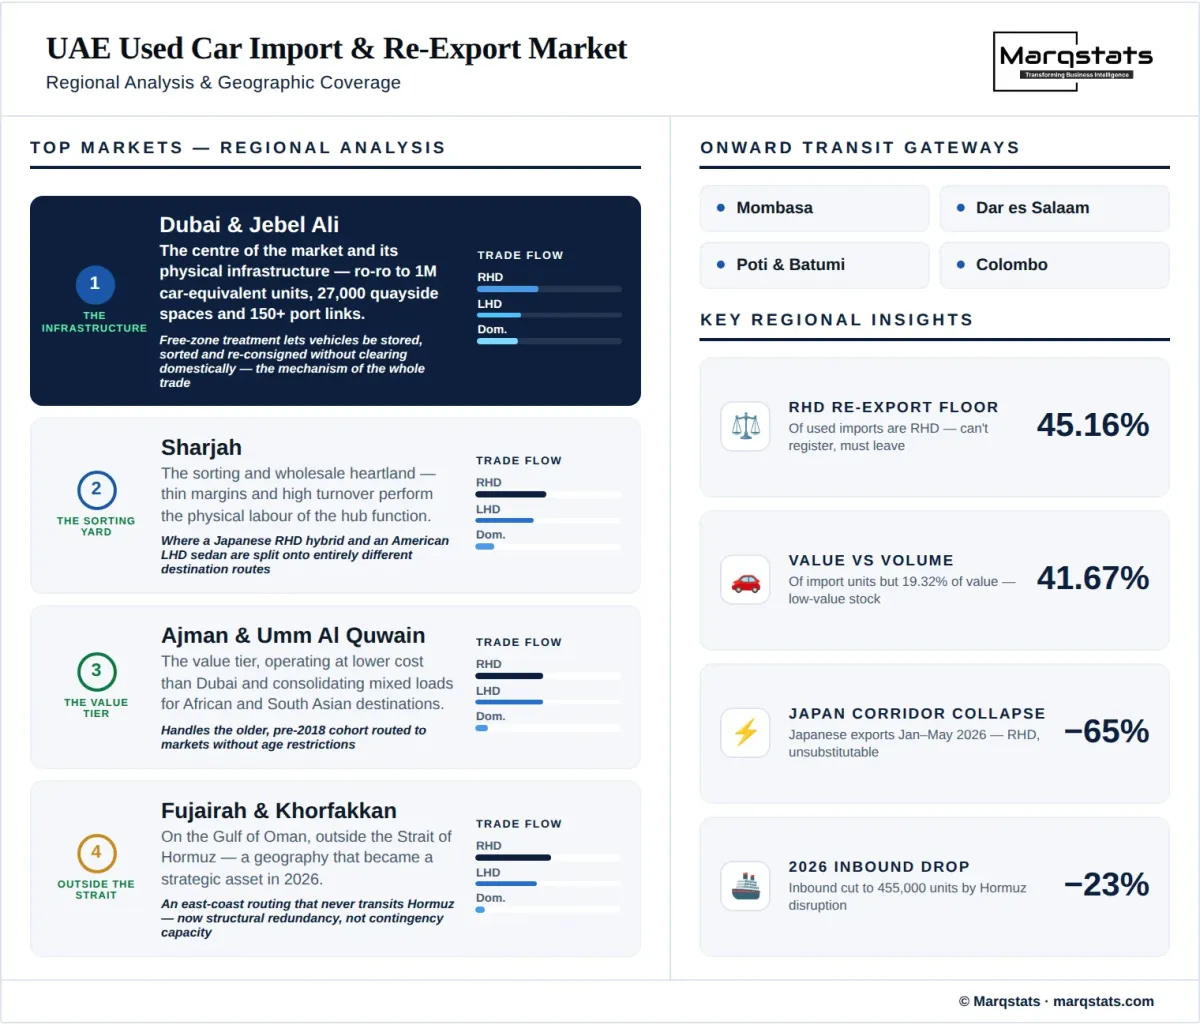
Dubai is the centre of the market and Jebel Ali is its physical infrastructure. The port's roll-on/roll-off berths handle up to one million car equivalent units with quayside storage for 27,000, and the adjoining free zone hosts automotive companies from 70 countries with connections to more than 150 ports. Free-zone treatment allows vehicles to be stored, inspected, reconditioned and re-consigned without clearing into the domestic market, which is the mechanism that makes the whole trade possible. The port's 2026 disruption — first-half throughput of 3.14 million TEU against 7.77 million a year earlier and a fall from tenth to thirty-second globally — is therefore a market-wide event, not a local one.
Sharjah
Sharjah is the sorting and wholesale heartland of the trade. Its used-vehicle complexes aggregate imported stock alongside domestic trade-ins, grade it, and consign it onward by destination and steering configuration. The emirate's operators work on thin margins and high turnover and provide the physical labour of the hub function: matching a vehicle's age, specification and steering to a destination market's regulatory profile. Sharjah is where a Japanese right-hand-drive hybrid and an American left-hand-drive sedan are separated onto entirely different routes.
Ajman and Umm Al Quwain
Ajman is a substantial used-vehicle trading and re-export location in its own right, operating at lower cost than Dubai and serving buyers who consolidate mixed loads for African and South Asian destinations. Together with Umm Al Quwain it forms the value tier of the hub, handling older and lower-priced stock — principally the pre-2018 cohort routed to markets without age restrictions. Neither emirate publishes vehicle throughput statistics, so their share is inferred from trade structure rather than measured.
Fujairah and Khorfakkan
Fujairah and Khorfakkan sit on the Gulf of Oman, outside the Strait of Hormuz, and 2026 converted that geography from a convenience into a strategic asset. Bonded road and rail corridors between Jebel Ali and these ports moved 500,000 TEU from March 2026, running roughly 3,000 truck movements a day with 700 additional trucks deployed. For a trade whose entire value proposition is reliable transshipment, an east-coast routing that does not transit the strait is now a structural feature of the UAE's offer rather than contingency capacity.
How Competition Is Evolving
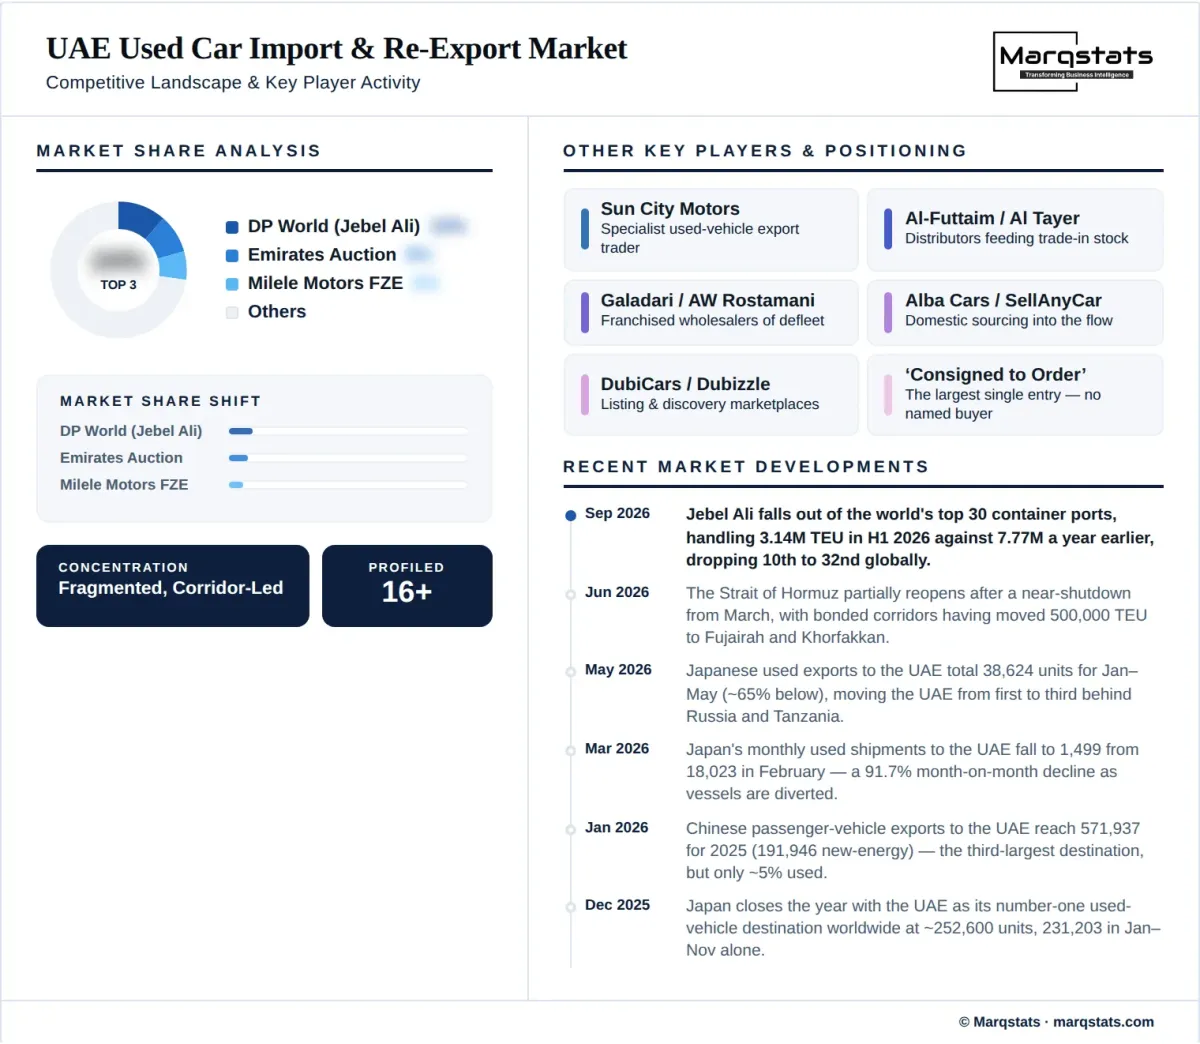
The UAE used car import and re-export market is highly fragmented. Shipment-level records for 2025 identify 874 distinct UAE consignees and 752 distinct shippers across 10,859 inbound passenger-car shipments, and within the used-tagged subset alone 250 consignees and 225 shippers across 52 origin countries. No participant holds a share capable of setting prices, and the largest single consignee entry in the data is a placeholder for shipments consigned to order with no named buyer — which is itself evidence of how much of this trade moves without a committed end purchaser at the point of shipment.
Participants divide into four distinct roles that only partially overlap. Port and free-zone operators provide the roll-on/roll-off capacity, bonded storage and customs treatment on which the hub function depends. Franchised distributor groups feed the flow from the domestic side, wholesaling trade-ins and defleet stock that does not meet their certified pre-owned standards. Specialist export traders buy, consolidate, grade and re-consign by destination, and are the operators who actually perform the steering-configuration and age-cap sorting that defines the market. Auction houses supply the wholesale and distressed inventory layer, handling new, used, damaged and salvaged vehicles.
Competitive advantage in this market is a function of destination-market knowledge rather than inventory scale. The operators who performed best through the 2026 disruption were those with multiple destination corridors and the ability to re-route stock consolidated for one market toward another when a corridor closed — and those with east-coast routing through Fujairah and Khorfakkan rather than exclusive dependence on Jebel Ali. Conversely, operators concentrated on Japanese right-hand-drive supply had no substitution available when that corridor fell 65%, because American stock cannot serve a right-hand-drive destination. Steering configuration is not a preference in this market; it is a hard constraint on who can sell what to whom.
Companies Covered
The report profiles 16+ companies with full strategy and financials analysis, including:
Recent Market Activity
Table of Contents
Coverage & Segmentation
This report covers used passenger vehicles imported into the United Arab Emirates and re-exported onward, with 2021–2025 as the historical period, 2025 as the base year and 2026–2030 as the forecast period. Market size is reported as inbound trade value in US dollars and corroborated by unit volume and blended landed value per vehicle. Segmentation covers steering configuration, trade flow, country of origin, vehicle age cohort, powertrain and destination market for re-export, with analysis by emirate and port for Dubai and Jebel Ali, Sharjah, Ajman and Umm Al Quwain, and Fujairah and Khorfakkan.
Three scope boundaries define the market perimeter. First, the market is sized on the inbound leg only. The re-export leg carries the same physical vehicles at an uplifted value, so adding the two legs would double-count; re-export is therefore analysed as a destination split within the inbound total, with its regulatory floor of 266,980 right-hand-drive units stated as a hard number and the balance given as a 40% to 60% range on the left-hand-drive stream rather than as an invented point estimate. Second, coverage is limited to customs heading 8703 — motor cars and other vehicles principally designed for the transport of persons. Goods vehicles under heading 8704, including pickups and light commercial vehicles, are excluded, which understates the total used-vehicle trade by an amount that cannot be quantified from the available data. Third, all figures derive from mirror data reconstructed from 53 reporting partners plus a China anchor and shipment-level records, because the UAE reported no 2025 annual statistics and publishes no shipment-level customs data of its own.
The domestic UAE used-car retail market — vehicles transacted between UAE buyers and sellers, whatever their origin — is a separate market with its own supply, pricing and channel structure, and is covered in the companion UAE Used Car Market report rather than here. The boundary between the two matters commercially: import volume is not domestic supply, and the 591,161 used vehicles entering the UAE in 2025 cannot be read against the roughly 880,000 domestic used-car transactions in that year without first removing the re-export flow and the right-hand-drive stock that has no domestic outlet.