Market Snapshot
Key Takeaways
Market Overview & Analysis
Report Summary
The GCC automotive roll-on roll-off logistics market covers the services performed on finished vehicles at Gulf ports and in their immediate hinterland: quay and terminal handling on discharge and loading, stevedoring and vessel operations, yard and compound storage, the customs and transit processing attached to import and re-export, and value-added vehicle services delivered within the port estate. The measured population is vehicles moving on roll-on roll-off tonnage, which is the dominant but not the only mode by which finished vehicles reach the region.
Two flows must be kept apart, and conflating them is the most common analytical error in this market. Import consumption is vehicles landed for sale within the country of arrival, and it tracks national vehicle demand. Transshipment and re-export is vehicles passing through toward other markets, and it tracks regional and continental demand together with trade financing conditions. Dubai's throughput is structurally larger than United Arab Emirates retail sales for precisely this reason, and a port investor sizing opportunity from national registrations will understate the addressable base substantially.
Value is migrating from stevedoring toward services performed while the vehicle is stationary. Quay-to-yard handling is priced against published terminal tariffs and differentiates poorly, while pre-delivery inspection, technical preparation, extended storage, customs handling and onward distribution carry materially better margins. That shift is visible in where Gulf operators are investing, and it is the reason revenue in this market compounds faster than vehicle throughput across the forecast.
Automotive RoRo Throughput at GCC Ports
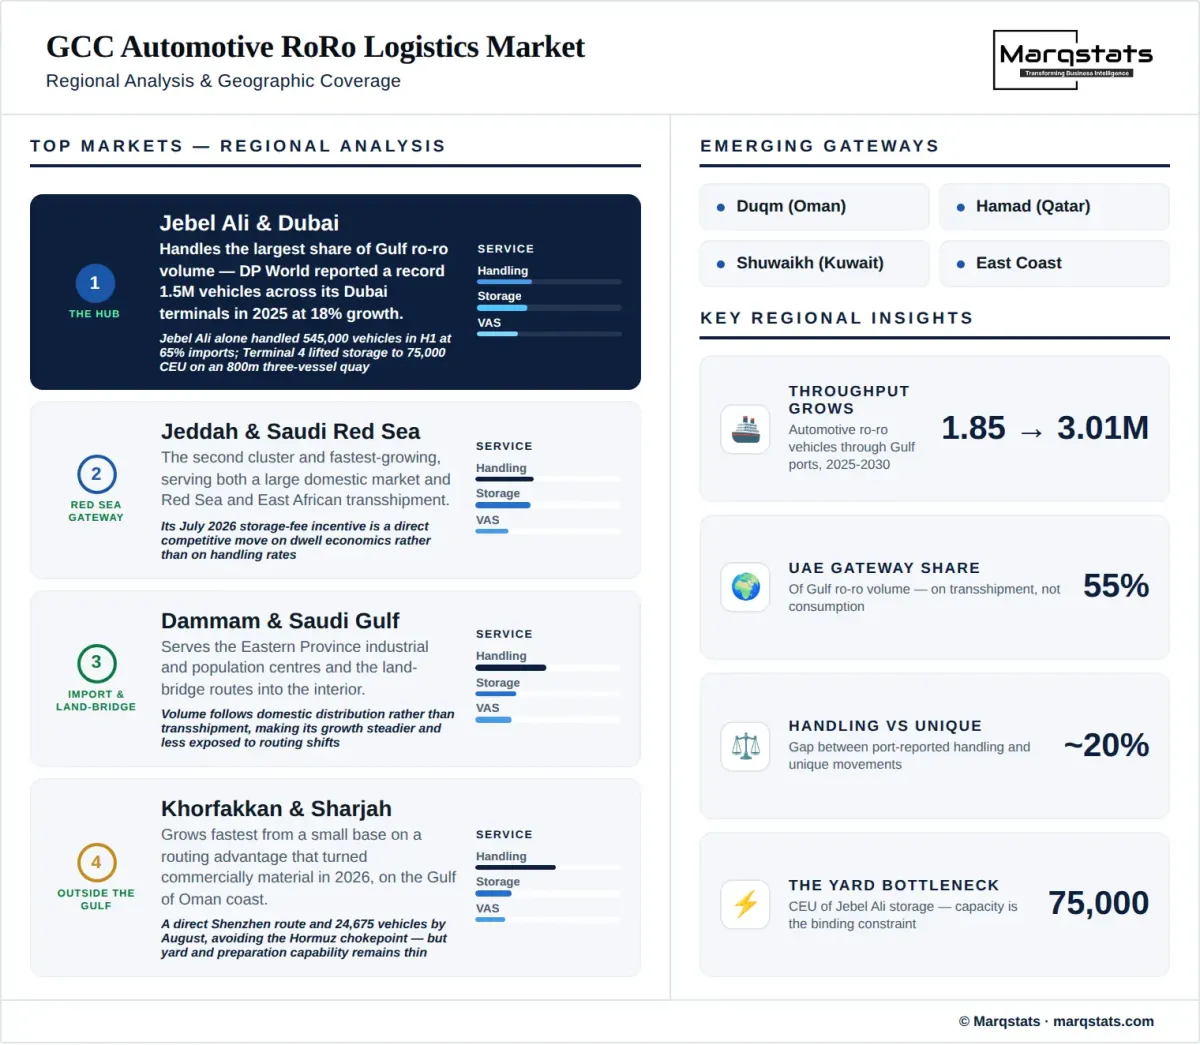
Automotive roll-on roll-off throughput across Gulf ports rises from 1.85 million vehicles in 2025 to 3.01 million by 2030, a 10.22% compound annual growth rate, with an indicative 2031 figure near 3.27 million. The series counts vehicles moving on roll-on roll-off tonnage net of repeat handling of the same unit, so a vehicle discharged, stored and later re-exported is counted once rather than at each handling event.
That distinction reconciles two figures that otherwise appear to contradict each other. DP World's reported 1.5 million vehicles handled across Dubai terminals in 2025 is a handling measure that includes units touched more than once, principally transshipment cargo discharged and subsequently loaded. Measured as unique vehicles, United Arab Emirates finished-vehicle movements across all modes are approximately 1.24 million in the same year, of which roll-on roll-off accounts for around 82%. Port-reported throughput and unique vehicle movements differ by roughly a fifth, and quoting one where the other is meant will misstate the market.
Country composition is more balanced than the headline gateway figures suggest. The United Arab Emirates handles approximately 55% of Gulf roll-on roll-off volume in 2025, falling gently to about 53% by 2030, while Saudi Arabia accounts for roughly 34% rising to 35% as Red Sea and Gulf gateway capacity and incentives develop. The remaining share sits with Qatar, Kuwait, Oman and Bahrain. Emirati dominance rests on transshipment rather than on consumption, and Saudi volume is weighted toward import for a large domestic market.
Blended revenue per vehicle rises from USD 98 to USD 118, a 3.78% annual increase, which is why service value compounds at 14.40% against 10.22% growth in throughput. The increase reflects service mix rather than tariff inflation. Terminal handling moves with published rates and slowly; storage with inventory control, technical preparation and customs handling carry higher rates, and the capacity commissioned across the forecast is weighted toward those activities. Longer dwell associated with larger batch shipments also raises revenue per unit independently of rate changes.
Market Dynamics
Key Drivers
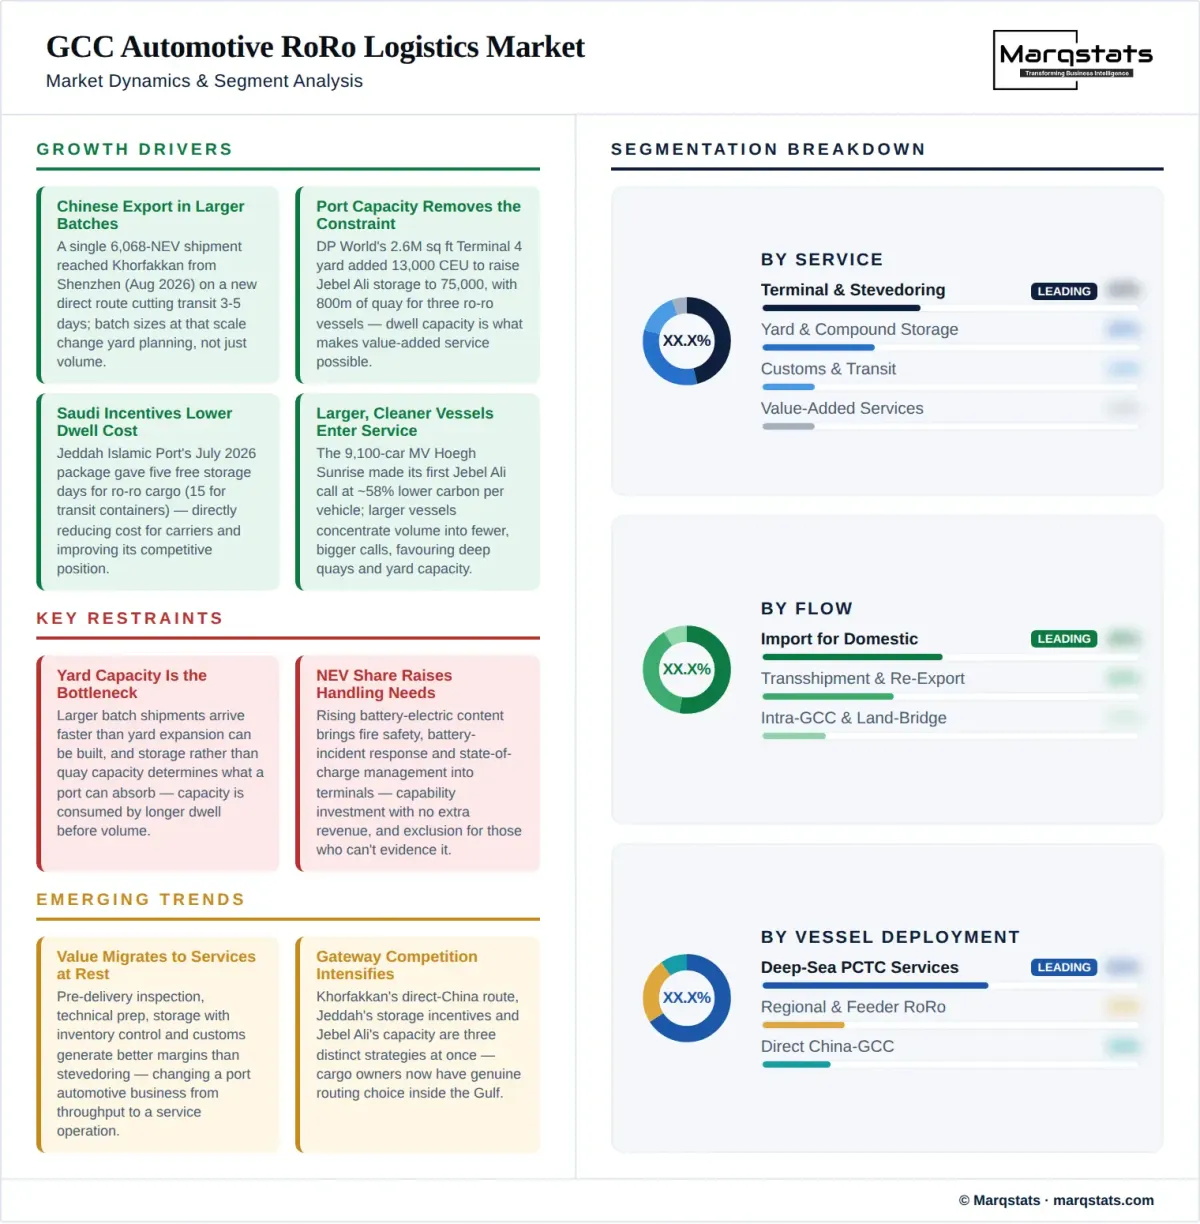
- Chinese export volume arriving in larger and more frequent batches. A single shipment of 6,068 new energy vehicles reached Khorfakkan from Shenzhen in August 2026 on a newly inaugurated direct route expected to cut sea transit by three to five days, and the port's commercial terminal had handled 24,675 vehicles by that month. Batch sizes at that scale change yard planning, discharge sequencing and storage requirements rather than simply adding volume to an existing pattern.
- Port capacity investment removing the physical constraint at the principal gateway. DP World's 2.6 million square foot Terminal 4 yard added 13,000 car equivalent units to raise Jebel Ali storage capacity to 75,000, with an 800 metre quay handling three roll-on roll-off vessels simultaneously. Dwell capacity is what makes value-added service possible, because a vehicle cannot be prepared or inspected if it must clear the terminal immediately.
- Saudi port incentives lowering dwell cost directly. Jeddah Islamic Port introduced a 60-day logistics incentive package in July 2026 including five days of storage-fee exemption for roll-on roll-off cargo and vehicles, with transit containers granted 15 days and general transit cargo five. Measures of this kind reduce cost pressure for vehicle carriers, transshipment operators and re-exporters at the Kingdom's largest Red Sea gateway and improve its competitive position against alternatives.
- Larger and cleaner vessel classes entering Gulf service. The 9,100-car-capacity MV Hoegh Sunrise made its first Jebel Ali call in September 2025 carrying 1,200 vehicles from Europe, an Aurora-class carrier offering approximately 58% lower carbon per transported vehicle than the prevailing standard and designed for future zero-carbon fuels. Larger vessels concentrate volume into fewer, bigger calls, which favours ports with deep quays and substantial yard capacity.
- Free-zone and bonded treatment sustaining the transshipment model. Bonded storage, customs transit and re-export rules allow a vehicle to be landed, held and forwarded without entering domestic customs territory, which is what makes Gulf staging competitive against holding inventory at origin or destination. The advantage is regulatory rather than geographic and it underpins the share of throughput that never becomes a local registration.
Key Restraints
- Yard capacity emerging as the binding strategic bottleneck. Larger batch shipments from Chinese manufacturers arrive faster than yard expansion can be planned and built, and storage rather than quay capacity is the constraint that determines how much volume a port can absorb. Capacity added for growth is consumed by longer dwell before it is consumed by additional vehicles, so headline capacity figures overstate the throughput they support.
- New-energy vehicle share raising safety and handling requirements. Rising battery electric content in imported fleets brings fire safety, battery incident response, state-of-charge management and damaged-vehicle procedures into terminal operations. Ports and yard operators face capability and compliance investment that generates no additional revenue per vehicle, and operators unable to evidence it face exclusion from the fastest-growing share of the flow.
- Stevedoring revenue commoditised against published tariffs. Terminal handling is the largest service by volume and the least differentiated, priced against published rates with limited scope for premium. Operators seeking returns must move into storage, preparation and customs handling, and those activities require capital, land and capability that a pure stevedoring operation does not possess.
- Direct route economics dependent on volume density. Direct China to Gulf services save several days of transit and improve manufacturer inventory turns, but require sufficient backhaul and volume density to remain economic. A route inaugurated on a single large shipment is not yet a service, and the gap between demonstration sailings and sustained frequency is where several announced routes will be tested.
Key Trends
- Value migrating from handling to services performed at rest. Pre-delivery inspection, technical preparation, storage with inventory control, customs handling and onward distribution generate better margins than stevedoring, and Gulf operators are investing accordingly. The shift changes what a port automotive business is, from a throughput operation measured in moves to a service operation measured in revenue per vehicle.
- Gateway competition intensifying within the region. Khorfakkan's direct China route, Jeddah's storage incentives and continued Jebel Ali capacity investment represent three distinct competitive strategies pursued simultaneously, where the region previously had one dominant gateway and several minor ones. Cargo owners now have genuine routing choice inside the Gulf, and route selection is becoming a commercial decision rather than a default.
- Vessel size and emissions performance converging as a selection criterion. The newest tonnage combines the largest capacity with the lowest carbon intensity per vehicle, so a manufacturer optimising for cost and for reported emissions selects the same vessel. Ports able to accommodate that tonnage capture volume from those able only to handle older classes, which links quay depth and yard capacity directly to environmental positioning.
- Storage duration becoming a negotiated commercial variable. Port incentive packages granting free storage days for roll-on roll-off cargo turn dwell from a cost imposed on the shipper into a term of competition between gateways. Where storage is free for a defined period, routing decisions respond to the length of that window as much as to handling rates or transit time.
Market Segmentation
Terminal and stevedoring handling is the largest service by both vehicle count and revenue throughout, covering discharge and loading, quay-to-yard movement, lashing and securing and vessel operations. It is also the most commoditised, priced against published terminal tariffs with limited differentiation, and its share of revenue declines gradually as higher-value services grow faster around it.
Yard and compound storage grows fastest and attracts the largest share of investment, covering open and covered storage, vehicle-level inventory control, condition monitoring and the compound operations between discharge and onward movement. Rates sit materially above handling, and the shift from passive land rental toward controlled inventory services is the principal driver of rising revenue per vehicle.
Customs, documentation and transit processing covers declaration handling, free-zone entry and exit formalities, re-export documentation and transit procedures across Gulf customs territories. Revenue per vehicle is modest but the activity applies to essentially every unit, and complexity rises with transshipment share because destination requirements vary while domestic entry does not.
Value-added vehicle services cover pre-delivery inspection, technical preparation, accessory fitment and condition rectification performed within the port estate or its immediate hinterland. The segment carries the highest revenue per vehicle and the strongest margins, and it is where Gulf operators are directing capability investment because it converts a transit event into a service relationship.
Import for domestic distribution accounts for the largest share of Gulf roll-on roll-off volume, consistent with imports representing 65% of Jebel Ali throughput in the first half of 2025 and with Saudi Arabia's large domestic market. Dwell is comparatively predictable because it follows distributor sales cycles rather than trade financing, and service intensity per vehicle is moderate.
Transshipment and re-export covers vehicles passing through Gulf ports toward Africa, the Levant, Central Asia and the subcontinent, and it is the flow that makes regional throughput structurally larger than regional vehicle sales. Dwell is longer and more variable because onward movement depends on destination credit, documentation and vessel availability, which makes this segment the least predictable consumer of yard capacity.
Intra-Gulf and land-bridge distribution covers vehicles landed at one Gulf port and moved by road to another Gulf market, a pattern that grows as gateway competition disperses arrivals. The segment expands faster than total throughput because routing decisions increasingly separate the point of discharge from the point of sale, generating road movements that a single-gateway model would not.
Passenger cars and sport-utility vehicles account for the large majority of roll-on roll-off volume, reflecting the composition of Gulf import and transshipment flows from Chinese, Japanese, Korean, Thai, Indian and European sources. Handling is standardised and stowage density is highest, which is what allows the high-throughput yard operations Gulf gateways are built around.
Commercial vehicles occupy a smaller share of units but consume disproportionate yard area and require different lashing, stowage and handling arrangements. Demand follows regional construction, logistics and fleet renewal cycles rather than consumer purchase, and revenue per unit runs above the passenger car average.
High and heavy and static cargo covers construction, agricultural and industrial machinery and non-self-propelled units moving on roll-on roll-off tonnage. Volumes are modest in unit terms but revenue per unit is the highest of the three categories, and the segment requires specialist handling equipment and operator competence that not every Gulf terminal holds.
Deep-sea pure car and truck carrier services account for most Gulf volume, operated by global carriers on liner schedules connecting Asian, European and American loading ports to regional gateways. Vessel size is rising, with 9,100-car-capacity tonnage now calling at Jebel Ali, which concentrates volume into fewer and larger calls and favours ports with deep quays and substantial yard capacity.
Direct China to Gulf services grow fastest and represent the clearest structural change in regional routing, inaugurated at Khorfakkan in August 2026 with a 6,068-vehicle shipment from Shenzhen and a transit saving of three to five days. Their durability depends on volume density and backhaul economics rather than on demand, and the gap between an inaugural sailing and a sustained service is where the segment's forecast risk sits.
Regional and feeder roll-on roll-off services move vehicles between Gulf ports and onward to East African, Red Sea and subcontinental destinations on smaller tonnage. The segment grows with transshipment volume rather than with import demand, and it is the mechanism through which Gulf gateways serve markets too small to justify direct deep-sea calls.
By Geography
Jebel Ali and Dubai Ports
Jebel Ali and the wider Dubai port system handle the largest share of Gulf roll-on roll-off volume, with DP World reporting a record 1.5 million vehicles across its Dubai terminals in 2025 at 18% growth. Jebel Ali alone handled 545,000 vehicles in the first half of that year, up 28%, with imports at 65% of throughput. Terminal 4 added a 2.6 million square foot yard and 13,000 car equivalent units to reach 75,000 CEUs, served by an 800 metre quay working three vessels simultaneously.
Jeddah and Saudi Red Sea Ports
Jeddah and the Saudi Red Sea gateways form the second cluster and grow fastest across the forecast, serving both a large domestic market and Red Sea and East African transshipment. Jeddah Islamic Port's July 2026 incentive package, granting five days of storage-fee exemption for roll-on roll-off cargo and vehicles alongside longer allowances for transit cargo, is a direct competitive move on dwell economics rather than on handling rates.
Dammam and Saudi Gulf Ports
Dammam and the Saudi Gulf coast ports serve the Kingdom's Eastern Province industrial and population centres and the land-bridge routes into the interior. Volume follows domestic distribution rather than transshipment, which makes the cluster's growth steadier and less exposed to the trade financing and routing conditions that move Emirati throughput.
Khorfakkan and Sharjah Ports
Khorfakkan grows fastest from a small base on a routing advantage that became commercially material during 2026, sitting outside the Gulf on the Gulf of Oman coast. The port handled 24,675 vehicles by August 2026 and inaugurated a direct route from Shenzhen with a 6,068-vehicle new energy shipment, cutting sea transit by three to five days. Yard and preparation capability remains thin relative to arriving volume.
Rest of the GCC
Qatar, Kuwait, Oman and Bahrain together hold a modest share, handling import volume for their own markets with limited transshipment function. Roll-on roll-off economics reward concentration, and these gateways lack the yard scale and call frequency that make a port a regional hub, so their share tracks domestic vehicle demand rather than trade flow.
How Competition Is Evolving
The market is concentrated at the gateway and fragmented across the services layered on top of it. One operator handles the largest single share of Gulf automotive volume through the Dubai port system while also controlling the free-zone land on which the surrounding yard and preparation cluster sits, and that combination of quay and hinterland is the strongest position in the regional chain. Saudi gateway operators hold comparable positions within a larger domestic market and are competing on cost terms rather than on capacity.
Vessel operators exert influence disproportionate to their visibility in port statistics. Global carriers determine which gateways receive direct calls and at what frequency, and their fleet decisions, including the deployment of 9,100-car-capacity tonnage, effectively select which ports can compete for the largest flows. A gateway without the quay depth and yard capacity to serve that tonnage loses volume regardless of its handling rates, which places carriers rather than terminals at the point of competitive decision.
Competition between Gulf gateways has become genuinely three-sided, and each participant is pursuing a different lever. Dubai competes on capacity and cluster depth, Jeddah on dwell cost through storage incentives, and Khorfakkan on transit time through direct routing outside the Gulf. Those are not variations of one strategy but three distinct propositions, and a cargo owner can now select among them on commercial grounds. The gateways that add value-added service capability alongside their chosen lever will hold volume when the lever alone stops differentiating.
Companies Covered
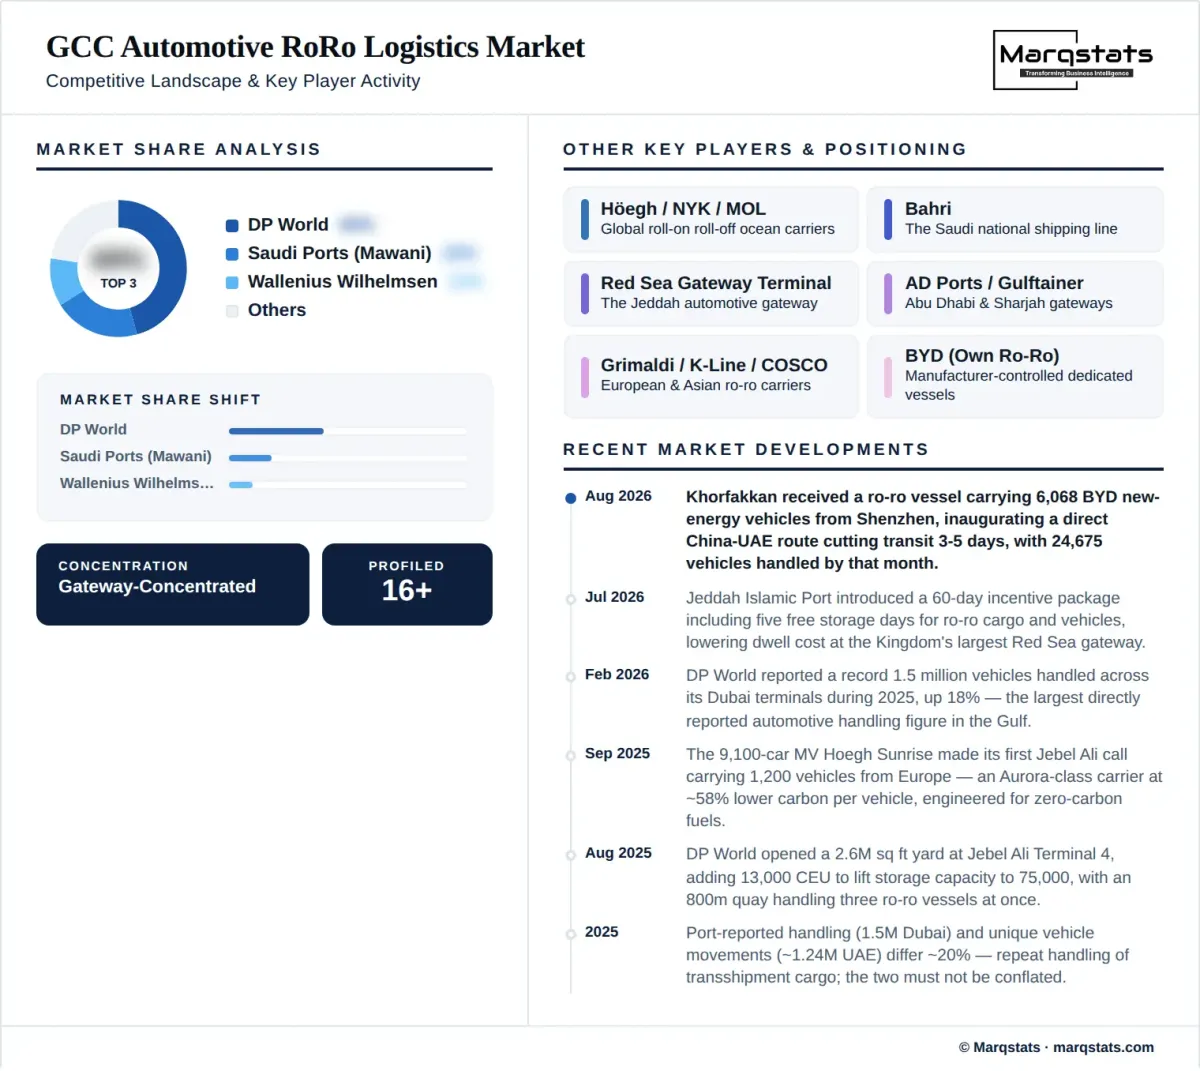
The report profiles 16+ companies with full strategy and financials analysis, including:
Recent Market Activity
Table of Contents
Coverage & Segmentation
The study covers the six Gulf Cooperation Council states with gateway-level detail for Jebel Ali and the Dubai ports, Jeddah and the Saudi Red Sea ports, Dammam and the Saudi Gulf ports, Khorfakkan and the Sharjah ports, and the remaining Gulf gateways. It measures annual automotive roll-on roll-off throughput in vehicles as the primary unit and annual service revenue in United States dollars as the secondary measure. The base year is 2025, the historical period covers 2023 to 2025, and the forecast period runs from 2026 to 2030 with an indicative 2031 endpoint.
Four boundaries define the market. Ocean freight revenue is excluded because it is earned by carriers largely outside Gulf jurisdiction, while the terminal, yard and processing services those vessels generate inside the region are included. Vehicle conformity assessment and customs clearance as regulatory activities are excluded, since they occur separately from the physical handling service and conflating them overstates revenue. Vehicles arriving in containers or on conventional break-bulk tonnage are excluded, as are vehicles moving entirely by road. Throughput is counted net of repeat handling of the same unit.
Roll-on roll-off accounts for approximately 82% of United Arab Emirates finished-vehicle movements, so the Emirati component of this market sits inside the wider national finished vehicle logistics market rather than beside it, while the Saudi and other Gulf components fall outside that national study entirely. The two measures overlap on the Emirati roll-on roll-off flow and neither contains the other, so they describe intersecting populations rather than markets that combine.