Market Snapshot
Key Takeaways
Market Overview & Analysis
Report Summary
The Middle East automotive port logistics market covers the port-side portion of the finished-vehicle chain: vessel discharge and loading, yard storage and inventory control, the customs, bonded and transit interface, and vehicle handling performed within the port perimeter or the adjacent free zone. Inland distribution and standalone dealer pre-delivery inspection fall outside scope unless they are performed as part of the port logistics chain. The boundary is functional rather than geographic, so a preparation facility inside a free zone serving port flows is included while an identical facility at a dealer network is not.
The measurement unit is the handling event, and adopting it rather than the vehicle is the single most important methodological decision on this page. Ports do not experience a transhipped vehicle once; they discharge it, hold it and load it again, consuming quay time, yard area and gate slots at each step. Capacity planning, tariff setting and investment cases are all built on that basis, so a study intended to inform port investment must count the same way the port does. The consequence is that this market is numerically larger than the regional finished-vehicle movement total even though its functional scope is narrower.
Two offsetting adjustments connect the two figures and both must be stated together. Counting events rather than unique vehicles raises this market relative to the movement total, because transhipment and re-export flows are handled more than once. Excluding inland transport, cross-border road movement and standalone dealer preparation lowers it, because those movements appear in the all-mode measure and not here. The two run in opposite directions and partially cancel, netting to a ratio of about 1.28 times in 2025. Neither adjustment on its own explains the gap, and using only one will produce a reconciliation that appears to fail.
Finished Vehicles Handled Through Middle East Ports
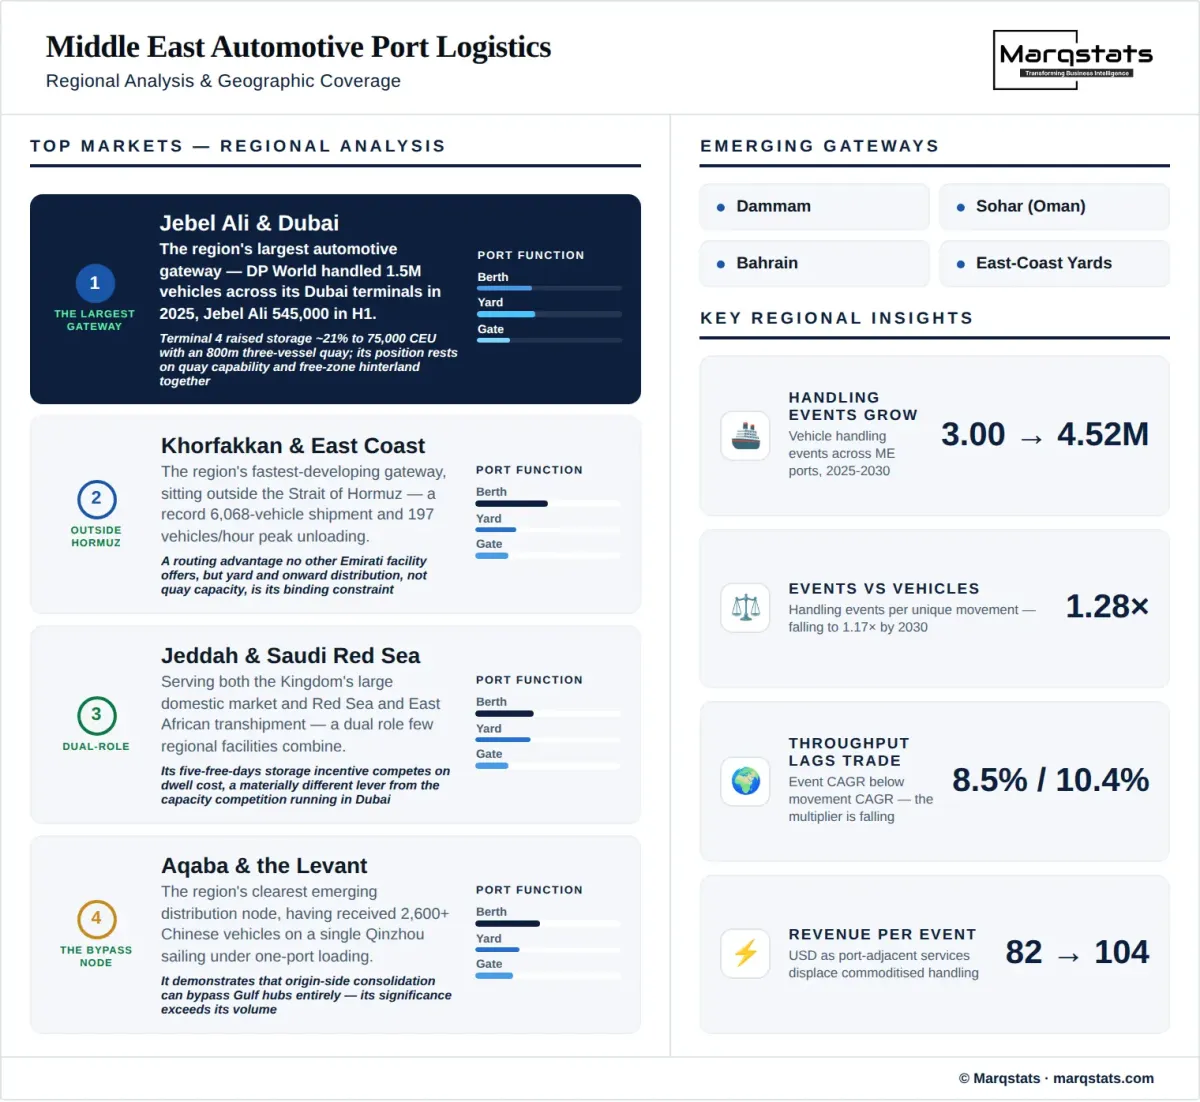
Annual vehicle handling events across Middle East ports rise from 3.00 million in 2025 to 4.52 million in 2030, an 8.54% compound annual growth rate and an absolute increase of 1.52 million events. The indicative 2031 endpoint is approximately 4.91 million. Dubai's terminals provide the largest directly reported anchor in the series, with 1.5 million vehicles handled across the DP World Dubai system in 2025, and Jebel Ali alone handling 545,000 vehicles in the first half of that year. The remaining gateways are built from route, shipment and capacity evidence rather than by converting national registrations into port movements.
Port-side service revenue grows from USD 246.00 million to USD 470.08 million, a 13.83% compound annual growth rate. Revenue compounds more than five points faster than event volume because revenue per handling event rises from USD 82 to USD 104, an increase of about 4.87% each year. The rise is mix rather than tariff inflation. Quay handling is priced against published terminal tariffs and moves slowly, while yard storage with inventory control, technical preparation, battery handling and digital inventory services carry materially higher rates, and the capacity being commissioned across the region is weighted toward exactly those.
The growth rate deserves careful reading because it is lower than the underlying trade growth and that inversion is deliberate. Regional finished-vehicle movements compound at 10.38% while port handling events compound at 8.54%, a gap of nearly two points. The cause is the falling repeat-handling multiplier: as direct China services reach Jebel Ali, Khorfakkan and Aqaba, and as one-port loading removes intermediate transhipment altogether, the same vehicle generates fewer port touches on its journey. Ports gain volume and lose touches simultaneously, and the second effect partially offsets the first.
Market Dynamics
Key Drivers
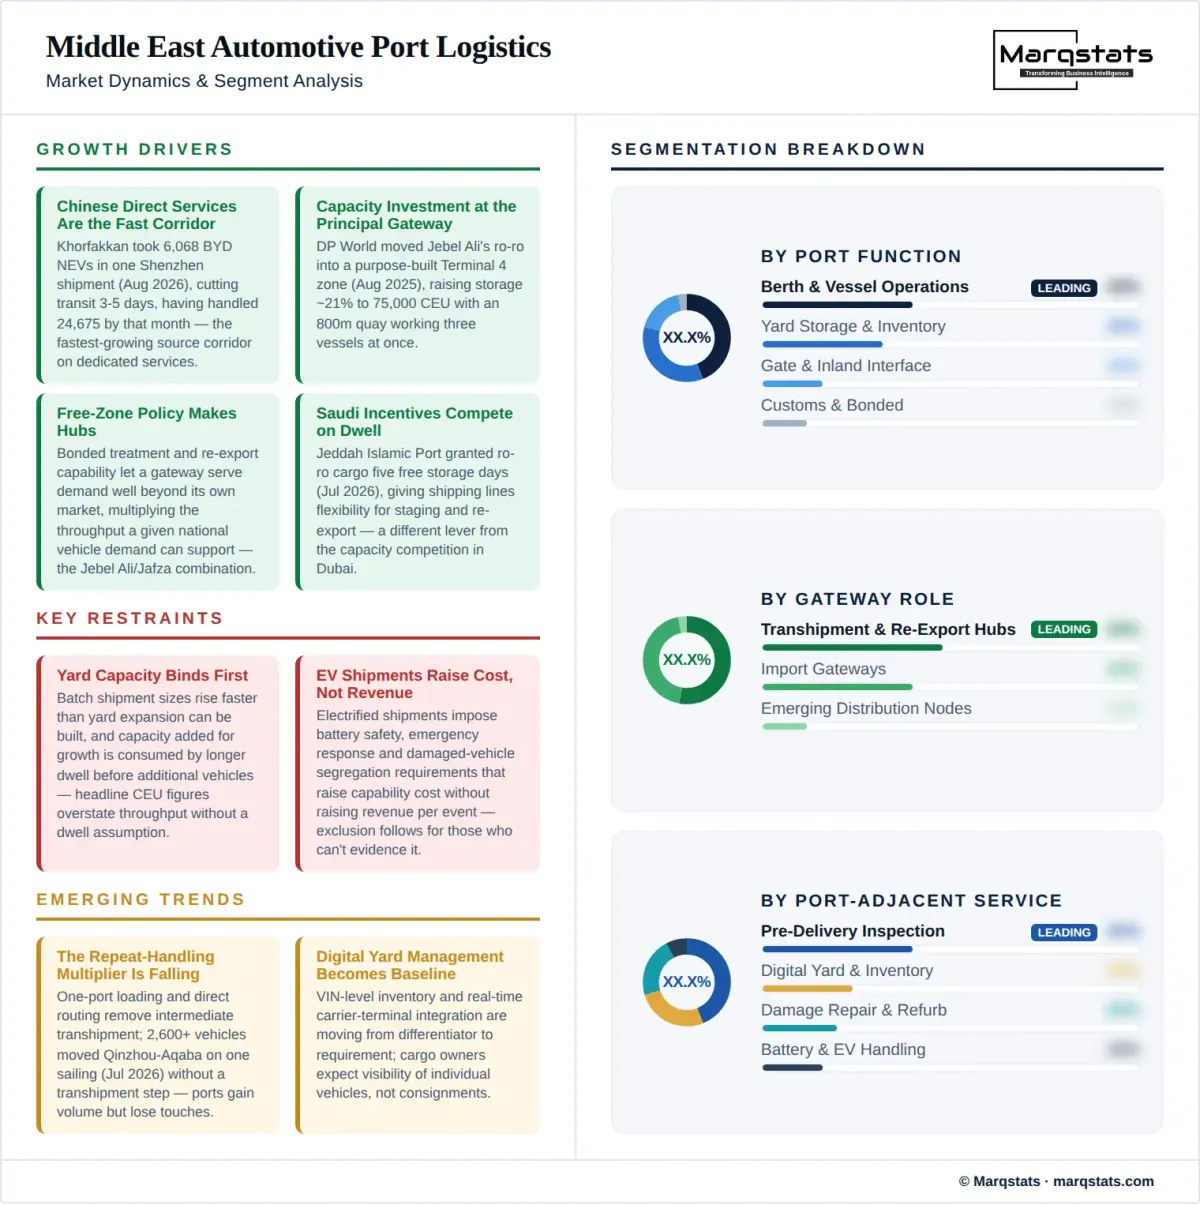
- Chinese origin flows are the fastest-growing source corridor and are arriving through dedicated direct services. Khorfakkan received 6,068 BYD new energy vehicles in a single shipment from Shenzhen in August 2026 on a route expected to shorten transit by three to five days, having handled 24,675 vehicles by that month.
- Port capacity investment is running at scale at the principal gateway. DP World moved Jebel Ali's roll-on roll-off operations into a purpose-built Terminal 4 zone with a 2.6 million square foot yard in August 2025, raising vehicle storage capacity almost 21% to 75,000 car equivalent units and adding an 800-metre quay able to work three vessels simultaneously.
- Free-zone policy converts national import ports into regional redistribution hubs, as the Jebel Ali and Jafza combination demonstrates. Bonded treatment and re-export documentation capability allow a gateway to serve demand well beyond its own market, multiplying the throughput a given national vehicle demand can support.
- Saudi port incentives are competing directly on dwell cost rather than on handling rates. Jeddah Islamic Port granted roll-on roll-off cargo and vehicles five days free of storage charges under a July 2026 package, giving shipping lines and cargo owners flexibility for staging, transhipment and re-export.
- Larger and cleaner vessel classes are entering regional service, with Aurora-class carriers able to move 9,100 vehicles at roughly 58% lower carbon per vehicle than the prevailing standard. A gateway lacking the quay depth and yard capacity to serve that tonnage loses the associated volume regardless of its handling rates.
Key Restraints
- Yard capacity is the most frequently binding constraint and the slowest to relieve. Batch shipment sizes are rising faster than yard expansion can be planned and built, and capacity added for growth is consumed by longer dwell before it is consumed by additional vehicles, so headline car equivalent unit figures overstate the throughput they support unless quoted with a dwell assumption.
- Electrified vehicle shipments impose battery safety, emergency response and damaged-vehicle segregation requirements that raise capability cost without raising revenue per event. Operators unable to evidence those procedures face exclusion from the fastest-growing share of the flow, which is the commercially serious consequence.
- Quay handling revenue is commoditised against published tariffs with limited scope for differentiation, so the largest activity by volume is the least profitable per unit. Operators seeking margin must move into yard, preparation and inventory services rather than compete on discharge rates.
- Customs inspection, bonded status and re-export documentation directly determine dwell, and a vehicle held for paperwork occupies yard space exactly as one awaiting a buyer does. Terminal operators carry the capacity cost of regulatory processes they do not control and cannot accelerate.
Key Trends
- The repeat-handling multiplier is falling as one-port loading and direct routing remove intermediate transhipment. More than 2,600 Chinese vehicles moved from Qinzhou to Aqaba on a single sailing in July 2026 under a model that links factory, port and overseas distribution without a transhipment step, which is the clearest expression of the shift.
- Digital yard management, vehicle identification number level inventory and real-time carrier and terminal integration are moving from differentiator to requirement, as cargo owners expect visibility of individual vehicles rather than of consignments.
- Handling productivity is becoming a published competitive metric. Khorfakkan reported peak unloading productivity of 197 vehicles per hour alongside its throughput figures, framing operational performance as a commercial claim rather than an internal measure.
- Port-adjacent service capability is where operators are directing investment, because inspection, preparation, battery handling and repair carry higher rates than handling and attach to dwell the operator already controls.
Market Segmentation
Berth and vessel operations cover quay allocation, discharge and loading, and the stevedoring labour and equipment they require. This is the largest function by event volume and the most commoditised by revenue, priced against published terminal tariffs with limited differentiation. Capability is defined by quay length, depth and simultaneous vessel handling, and the 800-metre Jebel Ali quay working three roll-on roll-off vessels at once represents the regional benchmark.
Yard storage and inventory covers vehicle holding between vessel and onward movement, together with the inventory control, condition monitoring and retrieval services layered on it. It is the function where capacity most often binds and where revenue attaches to dwell, making it structurally more attractive than handling. Capacity is measured in car equivalent units, with Jebel Ali at 75,000 following its Terminal 4 expansion.
The gate and inland interface covers vehicle release, transporter loading and the handover to onward carriage, including the scheduling and documentation that govern it. Gate capacity is the least visible of the three physical constraints and the most easily overlooked in investment cases, yet a gateway with adequate berth and yard capacity can still throttle throughput at release if gate slots and transporter access are not sized to match.
The customs, bonded and transit interface covers clearance processing, bonded and free-zone status management, transit documentation and re-export paperwork. It generates modest direct revenue but exercises disproportionate influence over dwell and therefore over yard revenue and capacity consumption. Bonded and free-zone capability is also what allows a gateway to serve re-export flows at all, making it a precondition for hub status rather than a service line.
Berth-constrained gateways cannot accept vessels quickly enough to clear the volume offered, typically because quay length, depth or simultaneous handling capability limits the tonnage they can serve. The constraint is the most capital-intensive to relieve and the most visible, and it increasingly determines which gateways can compete for the largest vessel classes as carriers deploy 9,100-vehicle tonnage on regional routes.
Yard-constrained gateways can work vessels but cannot hold the vehicles those vessels discharge, which is the most common binding constraint in the region and the one most sensitive to dwell. A yard sized for a given throughput at four days of average dwell fails at seven, so the constraint can bind without any change in volume, and rising batch shipment sizes tighten it faster than expansion programmes can respond.
Gate-constrained gateways hold vehicles they cannot release at the rate required, whether through transporter availability, documentation processing or physical gate throughput. The constraint is the least capital-intensive to relieve and the most frequently ignored, and because it presents as yard congestion it is often misdiagnosed as a yard problem and answered with yard investment that does not resolve it.
Pre-delivery inspection and technical preparation performed within the port chain covers condition assessment, accessory fitment, specification adjustment and release preparation before onward distribution. It carries substantially higher revenue per vehicle than handling and attaches to dwell the operator already controls, which is why regional investment is concentrating here rather than in additional quay capability.
Battery and electrified vehicle handling covers state-of-charge management, fire safety provision, battery incident response capability and damaged-vehicle segregation. It is the fastest-growing service requirement and the most awkward commercially, because it imposes capability investment without a corresponding rate increase, while an operator unable to evidence it is progressively excluded from new energy vehicle flows.
Damage repair and refurbishment addresses transit damage, weather exposure and handling incidents before vehicles reach distributors, and covers both cosmetic rectification and mechanical work. The service carries high revenue per vehicle on a modest event share, and its availability within the port perimeter avoids the additional movement and delay that off-site repair imposes on the chain.
Digital yard management and vehicle identification number level inventory systems provide individual vehicle visibility, location tracking, automated retrieval sequencing and real-time integration with carriers and cargo owners. These systems are shifting from differentiator to baseline expectation, and their absence increasingly disqualifies a gateway from the flows of manufacturers who manage distribution centrally.
Import gateways serve national vehicle demand, discharging vehicles that clear customs and enter the local market. Dwell is comparatively predictable because it tracks distributor sales cycles, yard planning is therefore more tractable, and each vehicle generates a single handling event. Growth in this role tracks national vehicle demand directly and is the most forecastable component of regional port throughput.
Transhipment and re-export hubs handle vehicles destined for third markets across Africa, Central Asia, the Levant and the subcontinent, generating two handling events per vehicle and the highest yard consumption per unit of throughput. Dwell is the least predictable because it tracks destination-market financing rather than local sales, and this role carries the entire exposure to the falling repeat-handling multiplier.
Emerging distribution nodes are gateways transitioning from national import points toward regional redistribution roles, of which Aqaba is the clearest current example following the Qinzhou one-port loading service. The role is the fastest-growing and the least established, and its viability depends on whether origin-side consolidation continues to favour direct delivery over hub transhipment.
By Geography
Jebel Ali and Dubai Gateways
The Dubai port system is the region's largest automotive gateway, with DP World handling 1.5 million vehicles across its Dubai terminals in 2025 and Jebel Ali accounting for 545,000 in the first half of that year. The August 2025 move of roll-on roll-off operations into a purpose-built Terminal 4 zone added a 2.6 million square foot yard, raising storage capacity almost 21% to 75,000 car equivalent units, alongside an 800-metre quay working three vessels simultaneously. Its position rests on the combination of quay capability and free-zone hinterland rather than on either alone.
Khorfakkan and the UAE East Coast
Khorfakkan is the region's fastest-developing automotive gateway and sits outside the Strait of Hormuz, which is a routing advantage no other major Emirati facility offers. It received 6,068 BYD new energy vehicles in a single shipment from Shenzhen in August 2026 on a new direct route cutting transit by three to five days, had handled 24,675 vehicles by that month, and reported peak unloading productivity of 197 vehicles per hour. Its constraint is yard and onward distribution capability rather than quay capacity.
Jeddah and Saudi Red Sea Gateways
The Saudi Red Sea gateways serve both the Kingdom's large domestic market and Red Sea and East African transhipment, giving them a dual role few regional facilities combine. Jeddah Islamic Port granted roll-on roll-off cargo and vehicles five days free of storage charges in July 2026 as part of a wider logistics-hub strategy, competing on dwell cost rather than on handling rates, which is a materially different lever from the capacity competition running in Dubai.
Dammam and Saudi Gulf Gateways
The Saudi Gulf coast gateways serve domestic distribution into the Eastern Province and the industrial corridor, with flows weighted toward import for consumption rather than transhipment. Their handling event multiplier is correspondingly the lowest of the major clusters, since most vehicles are touched once, and their growth tracks Saudi vehicle demand and inland distribution capability more closely than it tracks regional trade patterns.
Aqaba and Levant Gateways
Aqaba is the region's clearest emerging distribution node, having received more than 2,600 Chinese vehicles on a single sailing from Qinzhou in July 2026 under a one-port loading model that removes transhipment before vehicles reach Jordan. Its significance exceeds its volume because it demonstrates that origin-side consolidation can bypass Gulf hubs entirely, and its trajectory depends on whether that model extends to further origin ports and destination markets.
How Competition Is Evolving
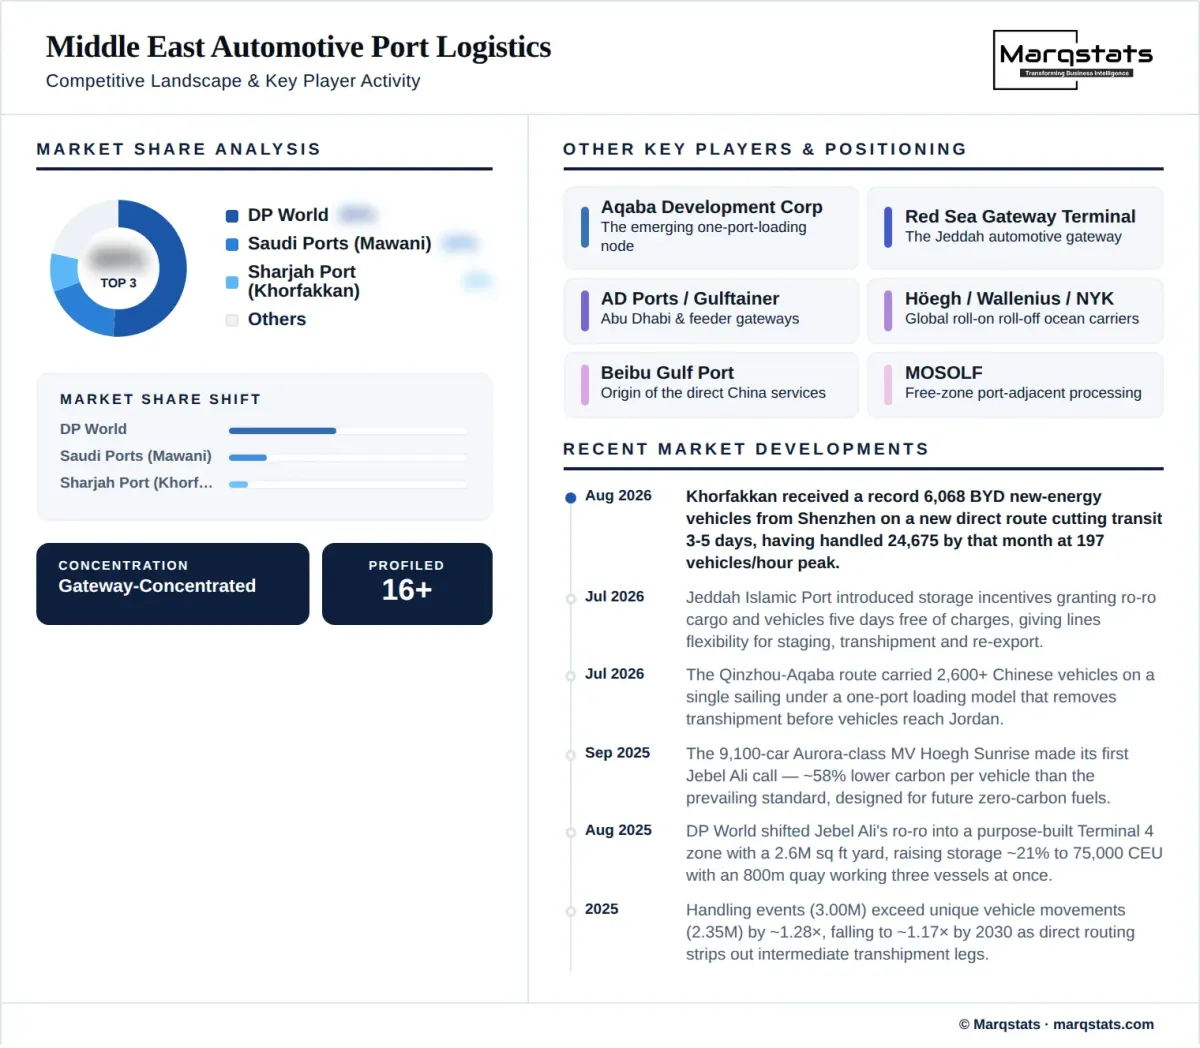
The Middle East automotive port logistics market is highly concentrated at the gateway level and fragmented across the services layered on top of it. One operator handles the largest single share of regional automotive volume through the Dubai port system and simultaneously controls the free-zone land on which the surrounding preparation and storage cluster sits. That combination of quay and hinterland is the strongest structural position in the regional chain, because it captures both the handling event and the higher-rate services that attach to dwell, and it cannot be replicated by a terminal operator without adjacent land.
Competition between gateways is now running on three distinct levers rather than on a single measure of scale, and conflating them produces poor investment decisions. Dubai competes on capacity and cluster depth, evidenced by the Terminal 4 expansion to 75,000 car equivalent units and simultaneous three-vessel quay capability. Jeddah competes on dwell cost through storage-fee exemption rather than on handling tariffs. Khorfakkan competes on transit time and geographic position outside the Strait of Hormuz, supported by published handling productivity. A cargo owner now chooses between genuinely different propositions.
The decisive influence increasingly sits outside the region altogether, which is the structural risk this market carries. Global carriers determine which gateways receive direct calls and at what frequency, and their deployment of the largest vessel classes effectively selects which ports can compete for the biggest flows. Beyond them, Chinese port groups and manufacturers now shape routing through consolidation decisions taken at origin, and the one-port loading model removes the transhipment step that Gulf hubs monetise. A regional terminal's throughput is therefore exposed to commercial decisions made in China rather than to competition from a neighbouring port.
Companies Covered
The report profiles 16+ companies with full strategy and financials analysis, including:
Recent Market Activity
Table of Contents
Coverage & Segmentation
The study covers the Middle East at gateway-cluster level, with detail for the Jebel Ali and Dubai gateways, Khorfakkan and the United Arab Emirates east coast, Jeddah and the Saudi Red Sea gateways, Dammam and the Saudi Gulf gateways, and Aqaba and the Levant gateways. It measures annual finished-vehicle handling events as the primary unit and annual port-side service revenue in United States dollars as the secondary measure. The base year is 2025, the historical period covers 2023 to 2025, and the forecast period runs from 2026 to 2030 with an indicative 2031 endpoint. Segmentation covers port function, capacity constraint, port-adjacent service and gateway role.
Four boundaries define the market. Ocean freight is excluded because it is earned by carriers largely outside regional jurisdiction, while the port-side services those vessels generate are included. Inland distribution and cross-border road transport are excluded, which is the principal scope difference from the regional finished-vehicle logistics measure. Standalone dealer pre-delivery inspection is excluded, though identical work performed within the port chain or adjacent free zone is included. Vehicle conformity assessment as a regulatory activity is excluded, though its effect on dwell is modelled.
Two related studies measure overlapping populations on different bases and none of the three figures are additive. Regional finished-vehicle logistics measures unique vehicle movements across all modes and runs at 2.35 million in 2025, against 3.00 million handling events here, a ratio of about 1.28 times falling to roughly 1.17 times by 2030. Gulf roll-on roll-off logistics measures unique vehicles on a single mode across six states. Comparing any two of these without first stating the counting basis and the scope difference will produce a reconciliation that appears to fail when in fact both figures are correct.