Market Snapshot
Key Takeaways
Market Overview & Analysis
Report Summary
The China–Middle East finished vehicle logistics market covers finished passenger and commercial vehicles exported from China and physically moved to Middle Eastern destinations, through dedicated roll-on roll-off and pure car and truck carrier services, container shipment and multimodal routings. The primary unit is vehicles shipped and corridor logistics revenue is the secondary measure. Scope begins at the Chinese inland collection point and ends at discharge in the destination market, which makes this an origin-to-quay measure rather than a destination-side services measure.
That scope boundary is what separates the corridor measure from the regional logistics measures and makes their revenue figures complementary rather than overlapping. Regional finished-vehicle logistics and port logistics both exclude ocean freight, because it is earned by carriers largely outside regional jurisdiction and including it would measure a market that is not the region's. Here the ocean leg is the product being measured, so it is included, together with origin-side collection, consolidation and export processing. The two sets of revenue figures describe adjacent segments of one chain and can be added only with that boundary stated.
The corridor's defining characteristic is how recently it became infrastructure. Before 2025 Chinese vehicles reached the Middle East largely on general services and mixed routings assembled shipment by shipment. Within eighteen months, dedicated direct services have opened from western, southern and coastal China to at least three destination gateways, single sailings have exceeded six thousand vehicles, and consolidation models have emerged that collect from multiple provinces for one-port export. A market that behaves like scheduled infrastructure requires different analysis from one that behaves like project cargo, and this one has crossed that line.
China-Origin Finished Vehicles Shipped to Middle East Markets
Annual China-origin finished vehicle shipments to Middle Eastern destinations rise from 1.06 million in 2025 to 1.89 million in 2030, a 12.26% compound annual growth rate and an absolute increase of 830,000 vehicles. The indicative 2031 endpoint is approximately 2.12 million. The series is built upward from reported destination-level Chinese customs data rather than estimated from regional demand, which is the only method that captures a corridor whose volume is dominated by onward re-export.
Corridor logistics revenue grows from USD 763.20 million to USD 1,115.10 million, a 7.88% compound annual growth rate. Revenue compounds more than four points more slowly than volume because revenue per vehicle falls from USD 720 to USD 590, a decline of about 3.90% each year. The fall is a capacity effect rather than a competitive one. Vessel capacity dedicated to vehicle carriage has expanded faster than the volume moving on it, and dedicated route economics improve with utilisation, so rates decline even as the corridor carries more.
Two destinations carry the series and the remainder is estimated. Chinese customs records 571,937 vehicles to the United Arab Emirates and 302,189 to Saudi Arabia in 2025, together 874,126 units and roughly 83% of the base. The balance covers Israel at approximately 90,000 units, direct shipments to Iraq, Jordan and the smaller Gulf states, and residual destinations. Volume redistributed onward from Emirati hubs to other regional markets is already counted at its Emirati arrival and is not added again. Türkiye falls outside the regional definition and Egypt is treated as Africa.
Market Dynamics
Key Drivers
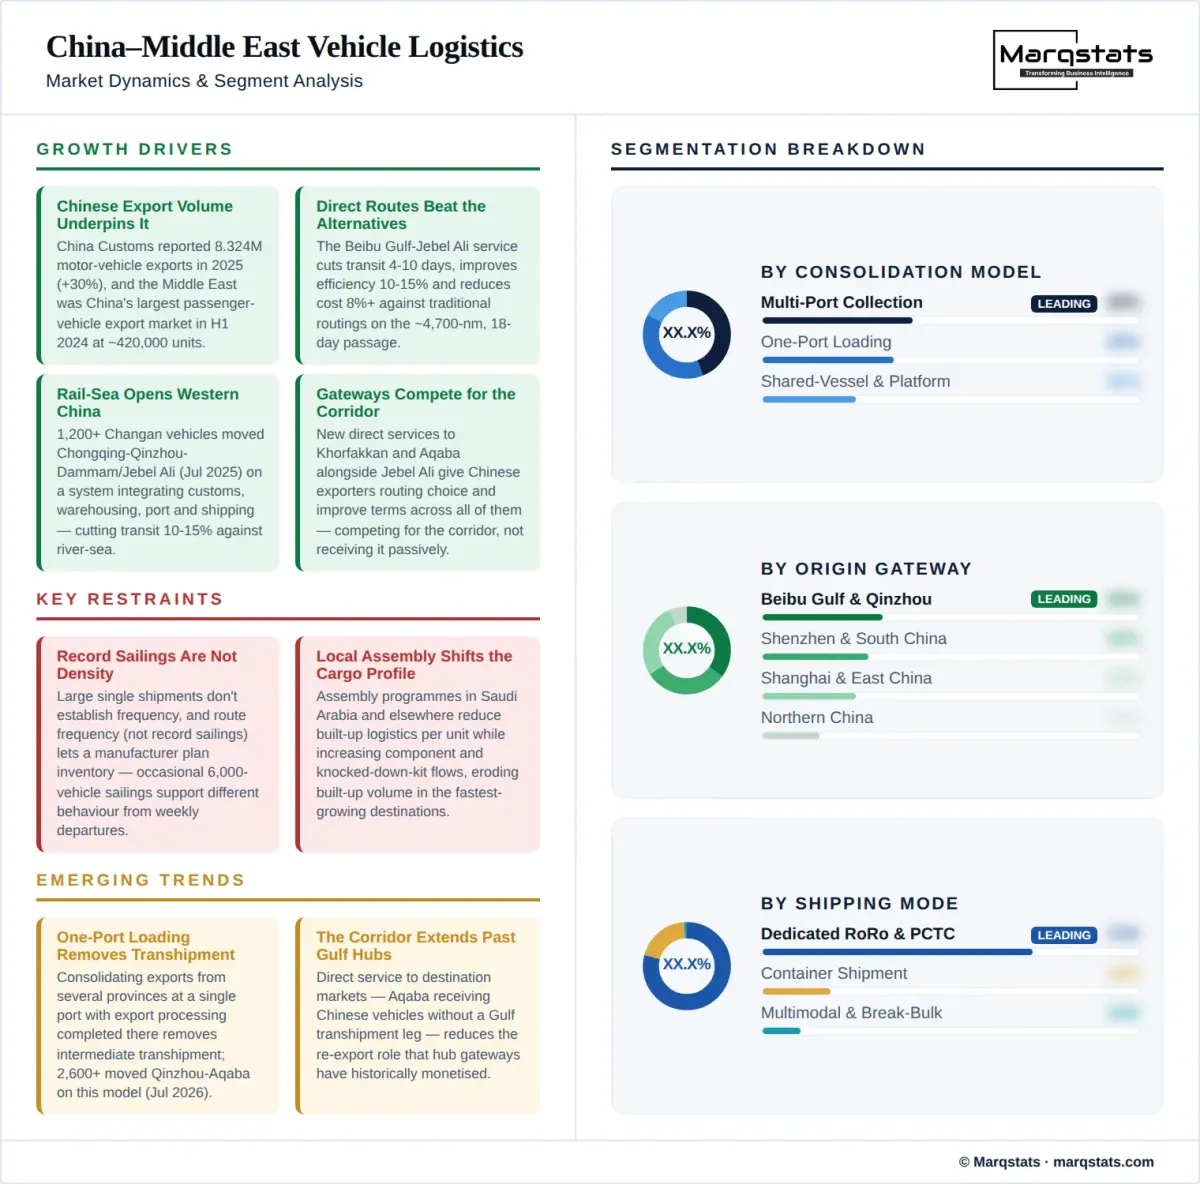
- Chinese vehicle export volume provides the underlying growth, with China Customs reporting 8.32 million motor vehicle exports in 2025, up 30% by quantity, of which 3.43 million were new energy vehicles, up 70%. The United Arab Emirates ranked third worldwide among destination markets at 571,937 units and sixth for new energy vehicles at 191,946.
- Direct route economics are demonstrably better than the alternatives, with the Beibu Gulf to Jebel Ali service reported to cut transit by four to ten days, improve logistics efficiency by 10 to 15% and reduce costs by more than 8% against traditional routings on an approximately 4,700-nautical-mile, eighteen-day passage.
- Rail-sea integration is opening western China to the corridor, with more than 1,200 Changan vehicles moving from Chongqing through Qinzhou to Dammam and Jebel Ali in July 2025 on a system integrating customs, warehousing, port handling and shipping, reported to cut overall transit by 10 to 15% against river-sea routings.
- Shipment scale is rising sharply as manufacturers commit volume to dedicated services, with a single August 2026 sailing carrying 6,068 BYD new energy vehicles from Shenzhen to Khorfakkan and setting that port's single-shipment record.
- Destination gateways are competing for the corridor rather than receiving it passively, with new direct services opening to Khorfakkan and Aqaba alongside the established Jebel Ali route, which gives Chinese exporters routing choice and improves terms across all of them.
Key Restraints
- Large single shipments do not establish service density, and route frequency rather than record sailings is what allows a manufacturer to plan inventory. A corridor carrying occasional six-thousand-vehicle sailings supports different commercial behaviour from one offering weekly departures, and the distinction is easily lost in announcement volumes.
- Direct sailings require consolidated volume to justify dedicated capacity, which favours the largest exporters and leaves smaller brands dependent on shared-vessel arrangements or logistics platform models that carry less favourable terms and less predictable scheduling.
- Local assembly programmes in Saudi Arabia and other markets reduce built-up vehicle logistics per unit while increasing component and knocked-down kit flows, which changes the cargo profile a corridor operator must serve and can erode built-up volume in the destination markets growing fastest.
- New energy vehicle shipments impose charging access, state-of-charge management, fire safety and battery incident response requirements at origin and destination yards alike, adding capability cost across the whole corridor without a corresponding rate increase.
Key Trends
- One-port loading is consolidating exports from several Chinese provinces at a single port with export processing completed there, removing intermediate transhipment entirely. More than 2,600 vehicles moved from Qinzhou to Aqaba on this model in July 2026, setting a Beibu Gulf single-voyage record.
- Origin-side competition is emerging between Chinese gateways, with Beibu Gulf serving western manufacturing through rail-sea links and Shenzhen serving southern manufacturing on direct sailings, which gives exporters a genuine choice of departure point rather than a default.
- The corridor is extending beyond the Gulf hubs into direct service to destination markets, with Aqaba receiving Chinese vehicles without a Gulf transhipment leg and thereby reducing the re-export role that hub gateways have historically monetised.
- Total door-to-port cost is displacing ocean freight rate as the basis on which routing decisions are made, because rail-sea corridors and coastal port routings differ more in inland cost and transit time than in sea freight.
Market Segmentation
Beibu Gulf Port and its Qinzhou terminal have become the corridor's most strategically significant origin, serving western Chinese manufacturing through the New International Land-Sea Trade Corridor and pioneering both the first direct Jebel Ali service and the one-port loading model. The gateway's advantage is inland reach rather than proximity, connecting production in Chongqing, Sichuan and Guangxi to a Middle East sailing without an east-coast repositioning leg.
Shenzhen and the southern Chinese ports serve the concentration of new energy vehicle manufacturing in Guangdong and the Pearl River Delta, with the Xiaomo International Logistics Port handling the corridor's largest single shipment to date at 6,068 vehicles in August 2026. The gateway offers the shortest inland leg for southern manufacturers and is where dedicated new energy vehicle handling capability is most developed.
Shanghai and the eastern seaboard ports carry the largest absolute volume of Chinese vehicle exports overall and serve the Yangtze Delta manufacturing base through established river-sea feeder networks. Their role in this corridor is proportionally smaller than in Chinese vehicle exports generally, because the Middle East routing favours southern and western departure points on both distance and inland cost.
The northern Chinese ports serve manufacturing in the Bohai Rim and northeastern provinces and carry the longest sea passage to Middle Eastern destinations. Their corridor share is the smallest of the four gateway groups and is most exposed to competition from rail-sea alternatives, though they retain advantages for manufacturers whose production concentrates in the north and whose volumes do not justify inland repositioning.
The rail-sea corridor moves vehicles from inland western manufacturing to southern ports by rail, integrating customs, warehousing, port handling and shipping into a single system. The July 2025 movement of more than 1,200 Changan vehicles from Chongqing through Qinzhou illustrated the model at commercial scale and was reported to reduce overall transit by 10 to 15% against river-sea routings, which is the comparison that matters for inland producers.
River-sea routing moves vehicles down the Yangtze to coastal transhipment for onward carriage, and it remains the established path for inland manufacturers in the river basin. It is slower than rail-sea alternatives and subject to seasonal water level and lock constraints, which is what makes the rail-sea comparison commercially live rather than theoretical for producers able to reach either.
Direct road feeder movement serves manufacturers located within economic trucking distance of an export port and is the simplest inland leg, dominant for coastal production in Guangdong, the Yangtze Delta and the Bohai Rim. It offers the greatest scheduling flexibility and the least fixed commitment, at higher per-vehicle cost over distance than rail.
Dedicated roll-on roll-off and pure car and truck carrier services carry the substantial majority of corridor volume and all of its record shipments. The mode offers the lowest handling cost per vehicle and the fastest discharge, and it is where the corridor's new direct routes have been established. Its constraint is that dedicated capacity requires consolidated volume, which concentrates access among the largest exporters.
Container shipment remains relevant for smaller consignments, for destinations without roll-on roll-off terminal capability and for high-value or specification-sensitive vehicles requiring enclosed carriage. It carries higher cost per vehicle and additional loading and unloading labour, but offers scheduling flexibility on existing liner networks that dedicated services cannot match for small volumes.
Multimodal and break-bulk arrangements cover routings combining sea legs with overland movement and shipments on general cargo tonnage where dedicated capacity is unavailable. The mode is declining as a share as dedicated services proliferate, and it survives mainly for commercial vehicles, oversized units and destinations at the edge of the corridor's scheduled network.
One-port loading collects vehicles from several Chinese provinces and completes all export processing at a single port before departure, eliminating intermediate transhipment. The model reached a Beibu Gulf single-voyage record of more than 2,600 vehicles to Aqaba in July 2026. It is the fastest-growing consolidation model and the one with the greatest strategic consequence, because it allows Chinese exporters to reach destination markets without using a Gulf hub.
Multi-port collection loads at successive Chinese ports on a single voyage, building a full cargo across two or more departure points. The model suits manufacturers with distributed production and moderate per-port volumes, at the cost of longer overall loading time and less predictable departure scheduling than single-port consolidation offers.
Shared-vessel and logistics platform arrangements allow smaller exporters to access dedicated tonnage without committing full cargoes, aggregating volume across brands. The model is commercially essential to the long tail of Chinese manufacturers entering the region and is where third-party logistics providers add most value, though participants accept less favourable terms and less scheduling control than a dedicated charterer commands.
By Geography
United Arab Emirates
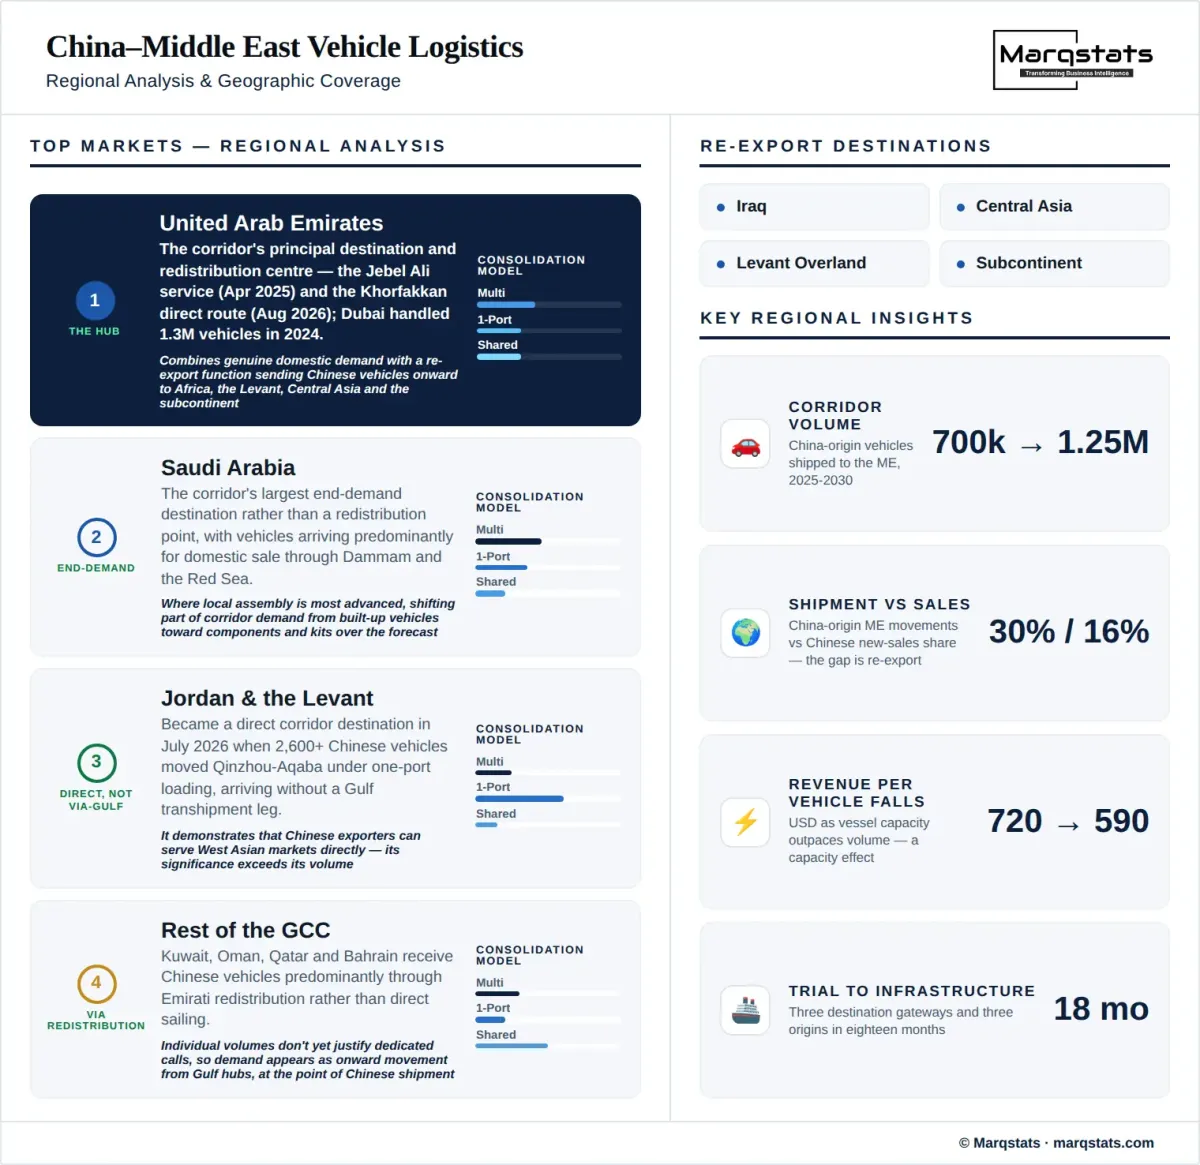
The United Arab Emirates is the corridor's principal destination and the world's third-largest market for Chinese vehicle exports, taking 571,937 units in 2025 including 191,946 new energy vehicles. It receives both the established Jebel Ali service opened in April 2025 and the Khorfakkan direct route launched in August 2026. Against a national new-vehicle market of under 345,000 units from all origins, arrivals run at 1.66 times total domestic demand, so the country's role is overwhelmingly redistribution rather than consumption.
Saudi Arabia
Saudi Arabia is the corridor's largest end-demand destination rather than a redistribution point, taking 302,189 Chinese vehicles in 2025 and ranking sixth worldwide, with arrivals predominantly for domestic sale through Dammam and the Red Sea gateways. More than 1,200 Changan vehicles reached Dammam and Jebel Ali on a single July 2025 rail-sea movement. The Kingdom is also where local assembly programmes are most advanced, which over the forecast period shifts part of its corridor demand from built-up vehicles toward components and kits.
Jordan and the Levant
Jordan became a direct corridor destination in July 2026 when more than 2,600 Chinese vehicles moved from Qinzhou to Aqaba under the one-port loading model, arriving without a Gulf transhipment leg. The cluster's significance exceeds its volume because it demonstrates that Chinese exporters can serve West Asian markets directly, and its trajectory depends on whether that model extends to further origin ports and destination markets.
Rest of the GCC
Kuwait, Oman, Qatar and Bahrain receive Chinese vehicles predominantly through Emirati redistribution rather than direct sailing, since individual market volumes do not yet justify dedicated calls. Their corridor demand is real but is expressed as onward movement from Gulf hubs, which means it appears at the point of Chinese shipment rather than at final destination and is not separately observable in arrival data.
Rest of the Middle East
The remaining Middle Eastern markets are led by Israel, where Chinese brands reached roughly a third of new vehicle sales during 2025 at approximately 90,000 units and had climbed toward 44% of the market by mid-2026. Iraq, Lebanon and neighbouring destinations receive Chinese vehicles through a combination of direct shipment, Gulf redistribution and overland movement from Levant gateways, and are poorly captured in arrival statistics.
How Competition Is Evolving
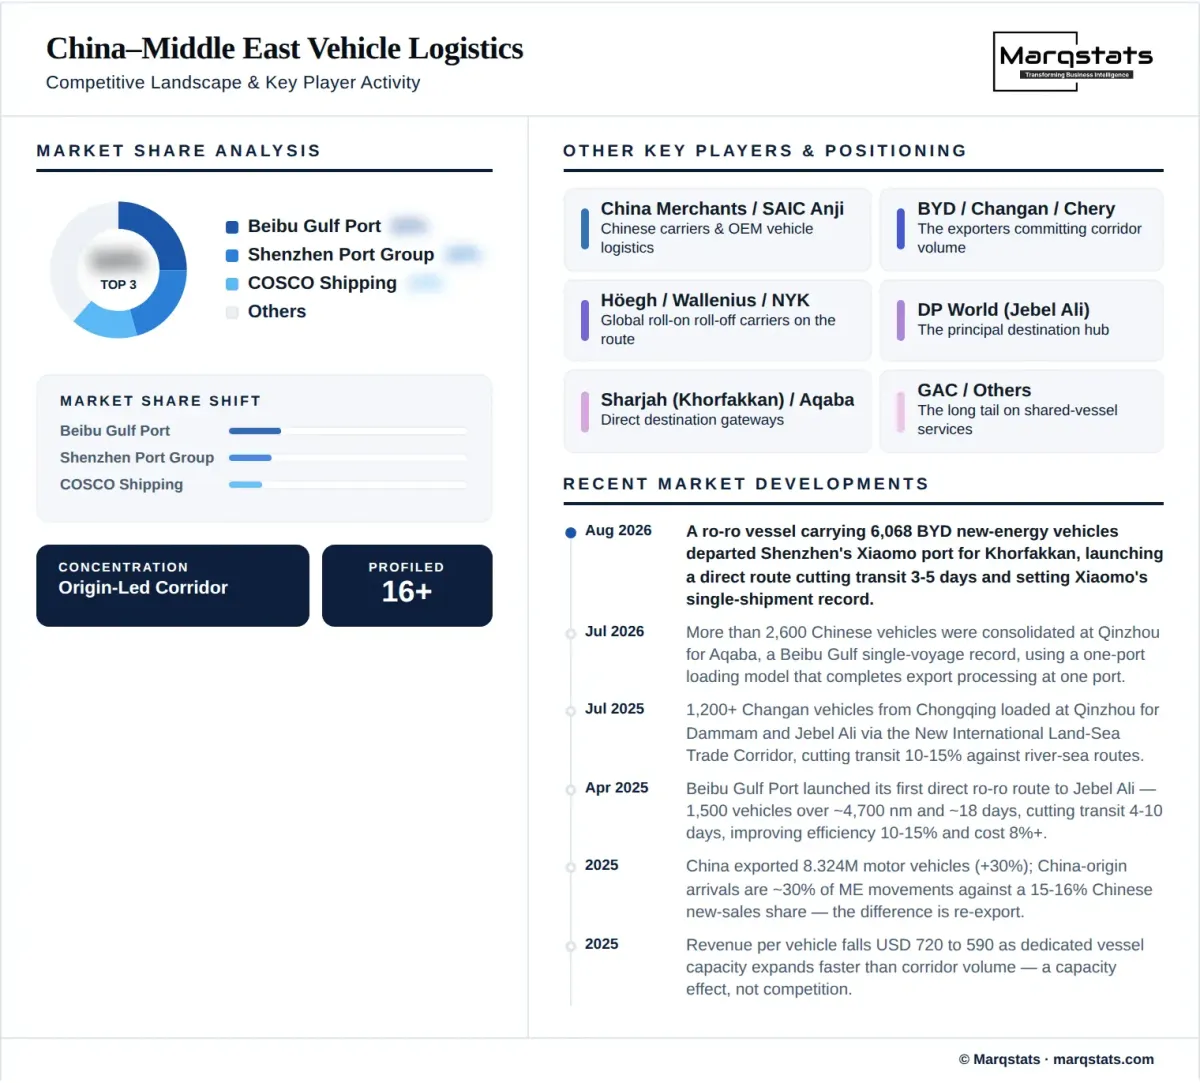
Competition in this corridor is concentrated on the origin side, which inverts the usual structure of a vehicle logistics market. Chinese port groups, manufacturer logistics arms and shipping operators together determine which routes exist, at what frequency and at what cost, and their decisions are taken in China against Chinese commercial considerations. Beibu Gulf Port has established the strongest position through inland rail-sea reach and the one-port loading model, while Shenzhen serves the southern new energy vehicle manufacturing concentration on direct sailings.
Destination gateways compete for the corridor rather than controlling it, and that competition has intensified as alternatives to Jebel Ali have opened. Khorfakkan offers shorter transit and a position outside the Strait of Hormuz, Aqaba offers direct West Asian distribution without a Gulf leg, and the established Emirati hubs offer scale, free-zone treatment and onward redistribution capability. A Chinese exporter now selects among genuinely different propositions, which improves terms across all of them and reduces any single gateway's pricing power.
The structural question the corridor raises is what happens to the Gulf redistribution function, and the exposure is larger than it appears. Of the 571,937 Chinese vehicles reaching the United Arab Emirates in 2025, the great majority move onward rather than staying, and in new energy vehicles the ratio is roughly fifteen arrivals for each domestic sale. Hub gateways earn on that transhipment leg. One-port loading to Aqaba removes it for the volume it captures, and further direct services to other destination markets would remove more.
Gulf operators holding only quay and yard capability are therefore exposed to a decision taken at origin rather than to competition from a neighbouring port. Those combining it with inland distribution, processing and free-zone services retain a role regardless of where the vehicle first touches land, because the value they add is not contingent on the vehicle passing through twice. The distinction matters commercially because the two capabilities sit at very different points on the investment curve: quay and yard are capital-heavy and substitutable, while distribution reach and processing capability are slower to build and harder to bypass.
Companies Covered
The report profiles 16+ companies with full strategy and financials analysis, including:
Recent Market Activity
Table of Contents
Coverage & Segmentation
The study covers finished vehicle movement from China to Middle Eastern destinations, with destination detail for the United Arab Emirates, Saudi Arabia, Jordan and the Levant, the rest of the Gulf Cooperation Council, and the remaining Middle Eastern markets. It measures annual China-origin finished vehicles shipped as the primary unit and annual corridor logistics revenue in United States dollars as the secondary measure. The base year is 2025, the historical period covers 2022 to 2025, and the forecast period runs from 2026 to 2030 with an indicative 2031 endpoint. Segmentation covers origin gateway, inland corridor, shipping mode and consolidation model.
Three boundaries define the market. Scope runs from the Chinese inland collection point to discharge in the destination market, so ocean freight and origin-side processing are included while destination-side yard, inland distribution and processing services are excluded. Components and knocked-down kits are excluded, since the measure is finished vehicles, even though local assembly will shift part of the flow into that excluded category. Türkiye falls outside the regional definition and Egypt is treated as Africa, which is the principal reason this series sits below published Chinese trade figures for the Middle East.
Two regional studies measure adjacent parts of the same chain and their revenue figures are complementary rather than overlapping. Middle East finished vehicle logistics and Middle East automotive port logistics both exclude ocean freight because it is earned outside regional jurisdiction; the corridor measure includes it because the ocean leg is the product. On volume, China-origin vehicles represent approximately 45% of regional finished-vehicle movements in 2025 rising to about 49% by 2030, so the corridor is a subset by origin and its vehicle count is not additive to theirs.