Market Snapshot
Key Takeaways
Market Overview & Analysis
Report Summary
The EV repair and maintenance services market comprises paid servicing, maintenance, diagnostic and repair work performed on battery-electric and plug-in hybrid vehicles worldwide, delivered through manufacturer service centres, franchised dealers, independent workshops, mobile operators and specialist chains. This study segments the market by service type, provider type, warranty status, vehicle category, battery service route and region, with a 2025 base year, historical coverage from 2021 to 2025, and forecasts to 2030.
The market is sized as paid third-party spend rather than as total service activity. Work performed under manufacturer warranty is excluded from market value because it generates no external revenue, which matters more here than in a conventional aftermarket study: a young electric parc carries an unusually high proportion of warranty-covered vehicles, so total service activity substantially exceeds addressable market value. That gap narrows across the forecast as the parc ages, which is why value grows faster than the vehicle base.
Two structural facts govern the economics. Electric vehicles require materially less routine maintenance than combustion equivalents, with no oil changes, no exhaust systems, no timing components and greatly extended brake life from regenerative braking. Yet the work they do require is more specialised and more expensive per event, concentrated in high-voltage systems, thermal management, software and advanced driver assistance recalibration. Fewer, costlier interventions replace frequent, cheap ones.
Collision repair illustrates the shift precisely. Industry claims analysis shows battery-electric vehicles averaging about 1.70 advanced driver assistance calibrations per repairable estimate against about 1.54 for combustion vehicles, with manufacturer parts accounting for about 86% of battery-electric parts spend against about 62% for combustion. The combined effect raises repair severity by roughly 25% to 30%. Battery-electric collision claims rose about 14% in the United States and about 24% in Canada across the same period.
Market Dynamics
Key Drivers
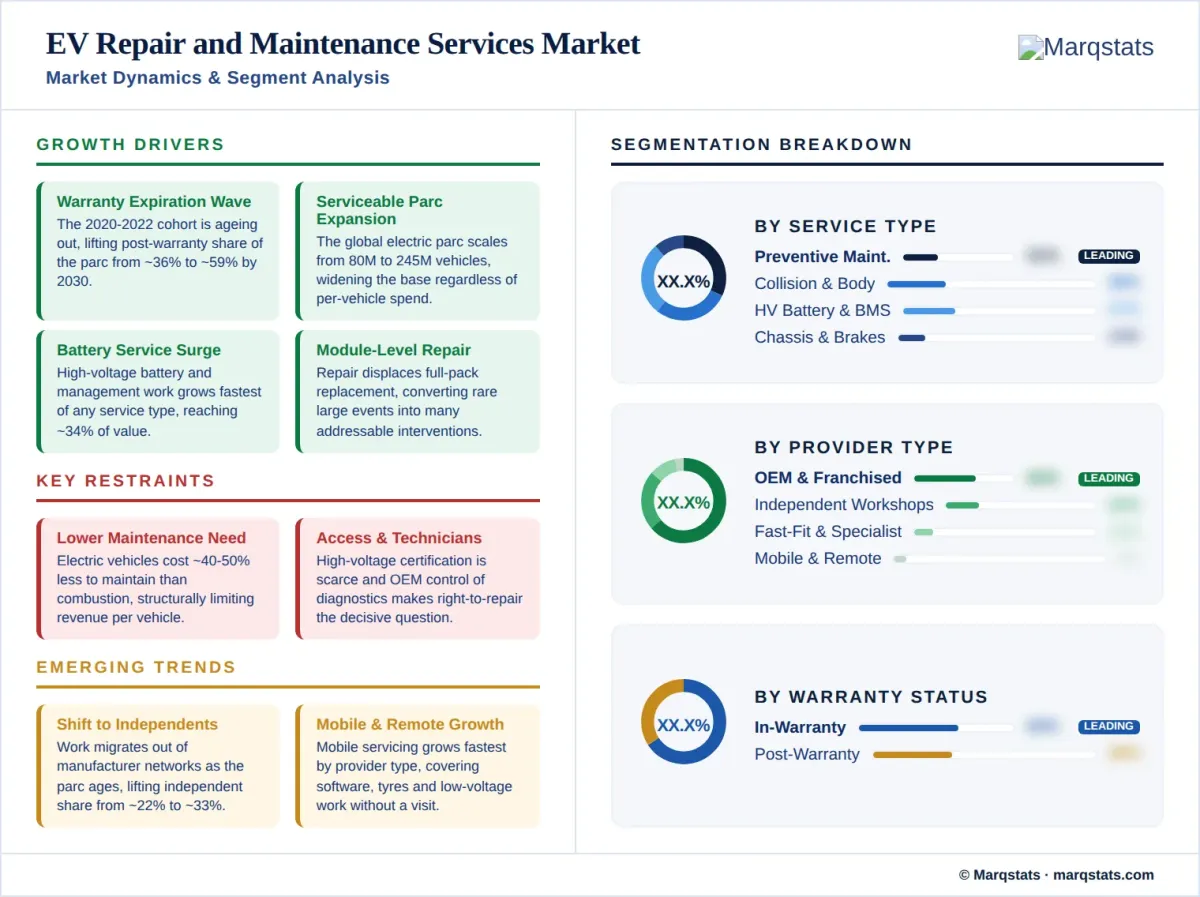
- The 2020 to 2022 electric vehicle cohort is reaching warranty expiration, lifting post-warranty share of the parc from about 36% to about 59% by 2030.
- The global electric parc grows at a 23.59% CAGR from 80.0 million to 245.0 million vehicles, expanding the serviceable base regardless of per-vehicle spend.
- High-voltage battery and battery management work grows fastest of any service type, reaching about 34% of market value by 2030.
- Module-level battery repair is displacing full pack replacement, converting a small number of very large replacement events into a larger number of addressable repairs.
- Collision repair severity is rising, with manufacturer parts at about 86% of battery-electric parts spend and higher calibration counts per estimate.
Key Restraints
- Electric vehicles cost roughly 40% to 50% less to maintain than combustion equivalents, structurally limiting revenue per vehicle across the parc.
- Technician shortages constrain independent workshop participation, since high-voltage qualification requires certification that most general mechanics do not hold.
- Manufacturer control of diagnostic and telematics interfaces limits independent access, making right-to-repair the decisive regulatory question for the segment.
- Full battery pack replacement remains costly at roughly USD 9,000 to USD 21,000, which pushes some owners toward vehicle disposal rather than repair.
Key Trends
- Work is migrating from manufacturer networks toward certified independents as the parc ages, with independent share rising from about 22% to about 33%.
- Cell-to-pack and module-level battery repair services entered the aftermarket during 2025, offered by a major cell manufacturer through a dedicated service arm.
- Mobile and remote servicing is growing fastest by provider type, covering software updates, tyre work and low-voltage battery replacement without workshop visits.
- Manufacturer service networks are expanding capacity ahead of parc growth, with new facilities and artificial intelligence assisted diagnostics deployed across 2025 and 2026.
Market Segmentation
Preventive and scheduled maintenance accounts for about 31% of 2025 market value and falls to about 25% by 2030 while growing in absolute terms. The category covers cabin filters, brake fluid, coolant service, tyre rotation and inspection work, and it is structurally smaller per vehicle than the combustion equivalent because oil changes, exhaust work and timing components do not exist. Chassis, brake and suspension work accounts for about 14% of value, suppressed by regenerative braking that extends friction brake life substantially.
High-voltage battery and battery management services account for about 27% of 2025 market value and grow fastest of any service type to about 34% by 2030. The category spans state-of-health diagnostics, cell balancing, thermal management, module replacement and pack remanufacturing. Growth reflects both the ageing parc and the shift toward module-level intervention, since a repair that costs a fraction of a full replacement converts a customer who would otherwise dispose of the vehicle into a serviceable one.
Manufacturer service centres and franchised dealers account for about 62% of 2025 market value and fall to about 48% by 2030 while growing in absolute terms. Their position rests on diagnostic access, high-voltage certification and warranty administration, and manufacturers have expanded capacity ahead of parc growth, with one opening its largest service facility during 2025 and committing further investment for 2026 alongside artificial intelligence assisted diagnostics and predictive maintenance.
Independent workshops account for about 22% of 2025 market value and grow to about 33% by 2030, the largest share shift in the market, driven entirely by vehicles ageing out of warranty and out of manufacturer networks. Mobile and remote servicing grows fastest by provider type from about 6% to about 12%, covering software updates, tyre work and low-voltage battery replacement without a workshop visit. Fast-fit and specialist chains hold about 10% of value, concentrated in tyres and brakes.
In-warranty vehicles account for about 64% of the 2025 parc and fall to about 41% by 2030. These vehicles generate substantial service activity and comparatively little addressable market value, since powertrain and battery work is absorbed by the manufacturer and only wear items, tyres and collision repair generate paid demand. The distinction is why total service activity on the electric parc substantially exceeds the addressable market reported here.
Post-warranty vehicles account for about 36% of the 2025 parc and rise to about 59% by 2030, and they generate a disproportionate share of market value because every intervention becomes a paid transaction. This transition is the single most important variable in the forecast: the first large global electric cohort sold between 2020 and 2022 is reaching warranty expiration now, and the cohorts behind it are substantially larger. Battery state-of-health assessment becomes a routine paid service at this point rather than a warranty matter.
Battery-electric passenger vehicles account for about 61% of 2025 market value and rise to about 68% by 2030 as they take a growing share of the parc. Plug-in hybrids account for about 26% of value against a smaller share of the parc, because they carry both a combustion powertrain and a high-voltage system and therefore require the maintenance obligations of both. Plug-in hybrid service revenue per vehicle is materially higher than battery-electric, a point frequently missed in aftermarket planning.
Electric light commercial vehicles account for about 10% of 2025 market value, with utilisation rates far above passenger vehicles producing proportionally more service demand per unit. Electric heavy vehicles and buses account for about 3% of value, a small share by unit count but with very high revenue per vehicle and specialised service requirements. Fleet operators in both categories prioritise uptime over cost, which supports service contract structures rather than transactional repair.
State-of-health diagnostics and assessment account for about 41% of 2025 battery service value, falling to about 38% by 2030 while growing strongly in absolute terms, and they are becoming a routine paid service as the parc ages and as used electric vehicle transactions require battery certification. Module-level repair accounts for about 18% of battery service value and grows fastest to about 32%, enabled by pack architectures that allow individual module replacement rather than whole-pack exchange.
Full pack replacement accounts for about 33% of 2025 battery service value and falls to about 19% by 2030 as module-level repair displaces it. At roughly USD 9,000 to USD 21,000 per event, replacement is the single largest cost an electric vehicle owner can face and frequently exceeds vehicle residual value on older models. Remanufacturing and second-life preparation account for about 8% of battery service value, growing as packs removed from vehicles are refurbished for stationary storage applications.
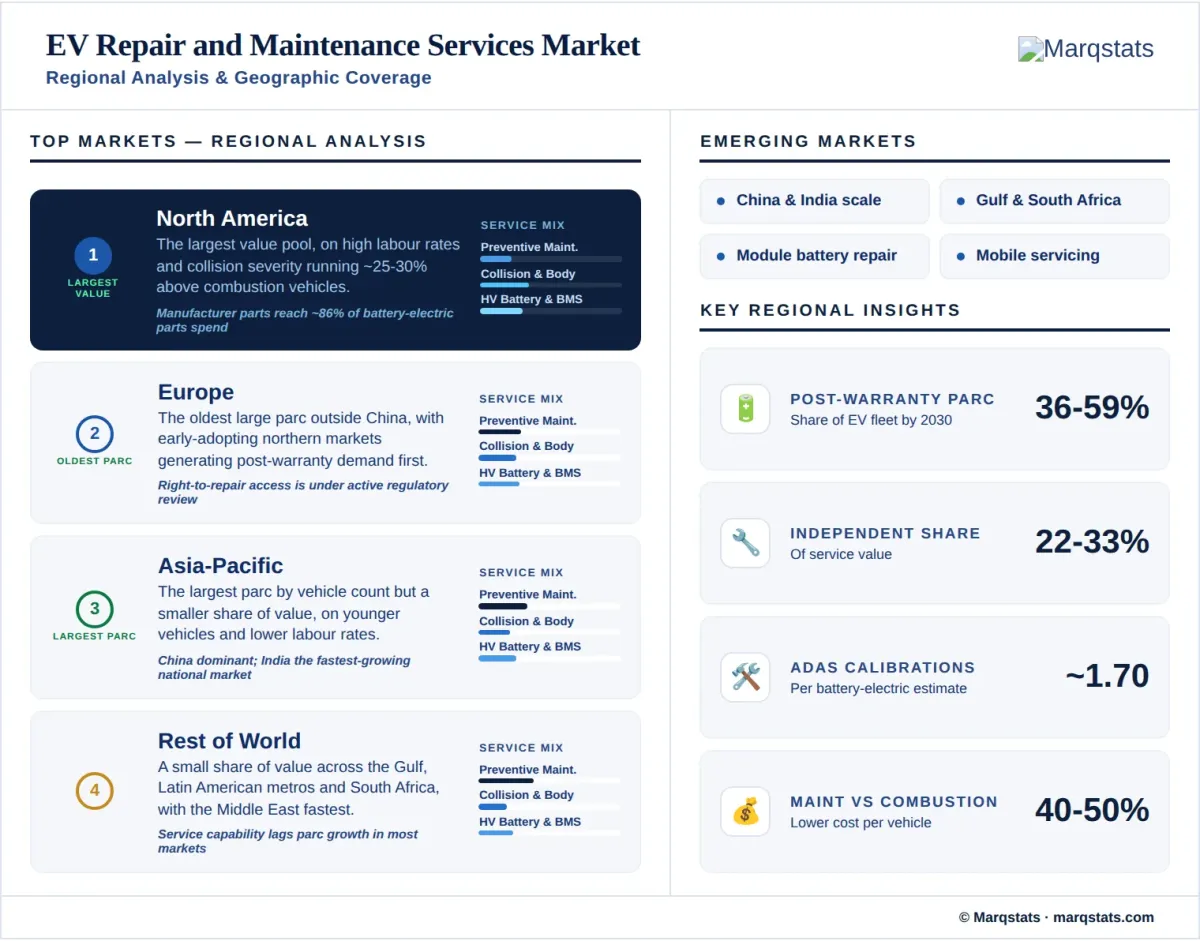
North America accounts for the largest share of market value, reflecting higher labour rates and a collision repair mix that carries substantially higher severity for electric vehicles. Europe follows, with a large and comparatively old electric parc in the earliest-adopting northern markets producing post-warranty demand ahead of other regions. Both regions face acute high-voltage technician shortages, and both have active right-to-repair regulatory processes that will determine independent workshop access.
Asia-Pacific accounts for the largest parc by vehicle count and a smaller share of value, reflecting lower labour rates and a younger vehicle population still substantially within warranty. China dominates regional volume with dense urban service networks, and a major cell manufacturer launched a cell-to-pack battery repair service through its aftermarket arm during 2025. India is growing rapidly, with one two-wheeler manufacturer announcing plans to add ten thousand service partners and scale toward eighteen hundred centres.
By Geography
North America
North America generates the largest share of market value despite a smaller parc than Asia-Pacific, driven by high labour rates and by collision repair severity that runs roughly 25% to 30% above combustion equivalents. Manufacturer parts account for about 86% of battery-electric parts spend against about 62% for combustion, and battery-electric collision claims rose about 14% in the United States and about 24% in Canada. Manufacturer networks are expanding capacity, with the largest service facility to date opened during 2025 and further investment committed for 2026.
Europe
Europe holds the oldest large electric parc outside China, with the earliest-adopting northern markets now well into post-warranty territory and generating independent workshop demand ahead of other regions. Real-world fleet data indicates combustion vehicles cost about 81% more in service, maintenance and repair by year three, a gap that has driven corporate fleet electrification independently of emissions targets. Right-to-repair and secure diagnostic access are under active regulatory consideration and will determine how much of the post-warranty opportunity independents capture.
Asia-Pacific
Asia-Pacific holds the largest electric parc by vehicle count and generates a smaller share of market value, reflecting lower labour rates and a younger vehicle population. China dominates regional service volume through dense urban networks operated by manufacturers and platform-affiliated chains, and a major cell manufacturer entered the aftermarket during 2025 with a cell-to-pack battery repair service. India is the fastest-growing national market, though technician availability constrains expansion and one electric two-wheeler manufacturer has committed to adding ten thousand service partners.
Rest of World
Rest of World markets account for a small share of value, concentrated in Gulf states, Latin American metropolitan centres and South Africa where electric parcs remain modest. The Middle East and Africa region records the fastest proportional growth from a very small base, supported by rapidly rising battery-electric penetration in Gulf vehicle markets. Service capability lags parc growth in most of these markets, and manufacturers frequently service vehicles through regional hubs rather than local networks.
How Competition Is Evolving
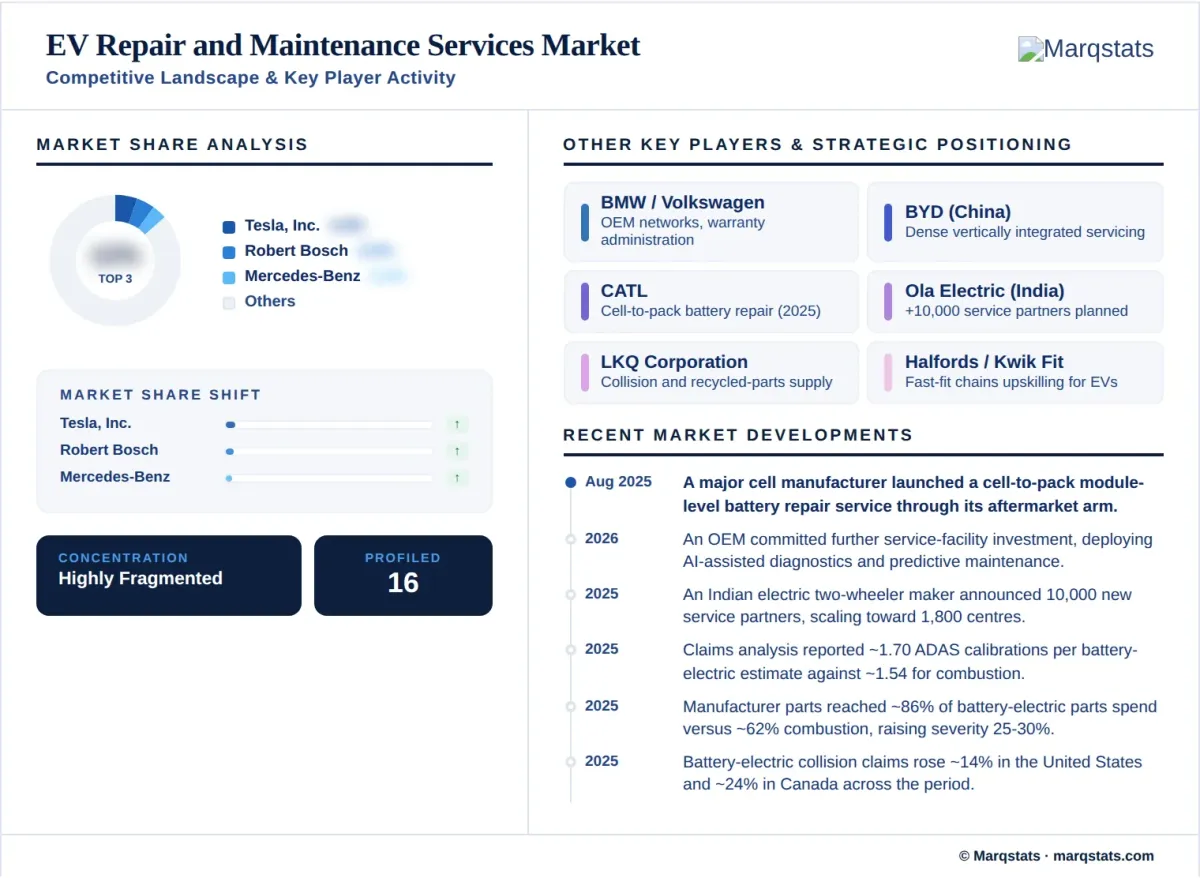
The EV repair and maintenance services market is highly fragmented, and the largest participants hold only modest global shares. Manufacturer service networks collectively account for the majority of current value through diagnostic access, high-voltage certification and warranty administration, with the five largest providers together holding roughly a sixth of the market and the single largest holding a low single-digit share. Fragmentation is structural, since servicing is inherently local and no operator can consolidate a global parc.
The competitive question is which channel captures post-warranty work. Manufacturer networks hold the advantage while vehicles remain in warranty, because the work comes to them by default. As vehicles age, owners become price-sensitive and geographically opportunistic, which historically shifted combustion servicing decisively toward independents. Whether the same shift occurs for electric vehicles depends less on price than on access, since high-voltage work requires diagnostic interfaces and certification that manufacturers control.
Right-to-repair is therefore the decisive regulatory variable rather than a peripheral one. Independent workshops can service brakes, tyres, suspension and cabin systems without manufacturer cooperation, and those categories represent a declining share of electric service value. High-voltage battery and battery management work, which grows to about 34% of value by 2030, requires secure diagnostic and telematics access. Legislative processes in North America and Europe will determine how much of that growth independents can address.
Battery service capability is emerging as the highest-value competitive position. Module-level repair requires pack-specific tooling, cell-level diagnostics and safe handling infrastructure that few independents possess, and a major cell manufacturer entered the aftermarket directly during 2025 with a cell-to-pack repair service. Operators able to repair rather than replace packs address a customer whose alternative is disposing of the vehicle entirely, which makes the service both high-margin and defensible.
Companies Covered
The report profiles 16+ companies with full strategy and financials analysis, including:
Recent Market Activity
Table of Contents
Coverage & Segmentation
This report provides a comprehensive assessment of the EV repair and maintenance services market across a 2025 base year, historical data from 2021 to 2025, and forecasts spanning 2026 to 2030. Market value covers paid third-party servicing, maintenance, diagnostic and repair work on battery-electric and plug-in hybrid vehicles, and excludes work performed under manufacturer warranty because it generates no external revenue. The serviceable parc is reported alongside as the volume metric. Segmentation covers six dimensions.
The scope covers demand drivers, restraints and structural trends, with particular focus on the post-warranty inflection and its effect on spend per vehicle, the structurally lower maintenance requirement of electric vehicles, battery service routes and the shift from replacement to repair, right-to-repair access, and rising collision repair severity. Adjacent circular-materials coverage of the same vehicle fleets is available in the End-of-Life Tire Market report. An extended forecast to 2035 is available under customization, alongside country-level parc and channel analysis on request.