Market Snapshot
Key Takeaways
Market Overview & Analysis
Report Summary
The Sweden used car market comprises passenger-car secondary transactions recorded across Sweden in a calendar year, transacted through manufacturer-franchised networks, independent dealers and professional retailers, digital platforms and auction houses, and direct private-party channels. This study segments demand by vehicle type, propulsion type, seller type, sales channel, vehicle age, vehicle mileage, price band, certification status, vehicle positioning, and brand, with a 2025 base year, historical coverage from 2021 to 2025, and forecasts to 2030. Sizing is presented in unit-volume terms and complemented by value analysis in United States dollars.
Data quality requires explicit disclosure for this market. Unlike Germany, Italy, Spain, or the Netherlands, Sweden has no single authoritative annual used-transaction series published by a national association or registry. The historical figures in this report are Marqstats research estimates constructed from parc turnover, new-car supply, scrappage, export volumes, and industry indicators, rather than taken from a verified published series. Readers should treat the Swedish volume series as carrying wider tolerance than the other Western European markets in this collection.
Two definitions circulate and they differ by roughly a factor of two. A retail-oriented series drawn from the vehicle register, covering sales through the trade, the private market, and companies, placed 2025 volume at about 1.25 million units, up around 0.6% on 2024. A broader turnover measure that counts every ownership change places annual volume nearer 2.4 million. This report is sized on the narrower basis at 1.21 million, about 4% below the retail-oriented published figure. The direction and structure of the market are consistent across both, however anyone benchmarking absolute volume must first establish which definition a competing source has used.
A second caveat applies to the electrified segments. Published retail data recorded roughly 91 thousand used battery-electric sales and 98 thousand plug-in hybrid sales in 2025, equal to about 7% and 8% of that series respectively. The shares modelled here run higher, at about 10% and 14%. Part of the gap reflects the different volume base and part reflects treatment of hybrid categories. The directional finding is robust and confirmed by both sources, namely that Sweden has the most electrified used fleet in Europe and that battery-electric volume grew roughly 42% during 2025.
Market Dynamics
Key Drivers
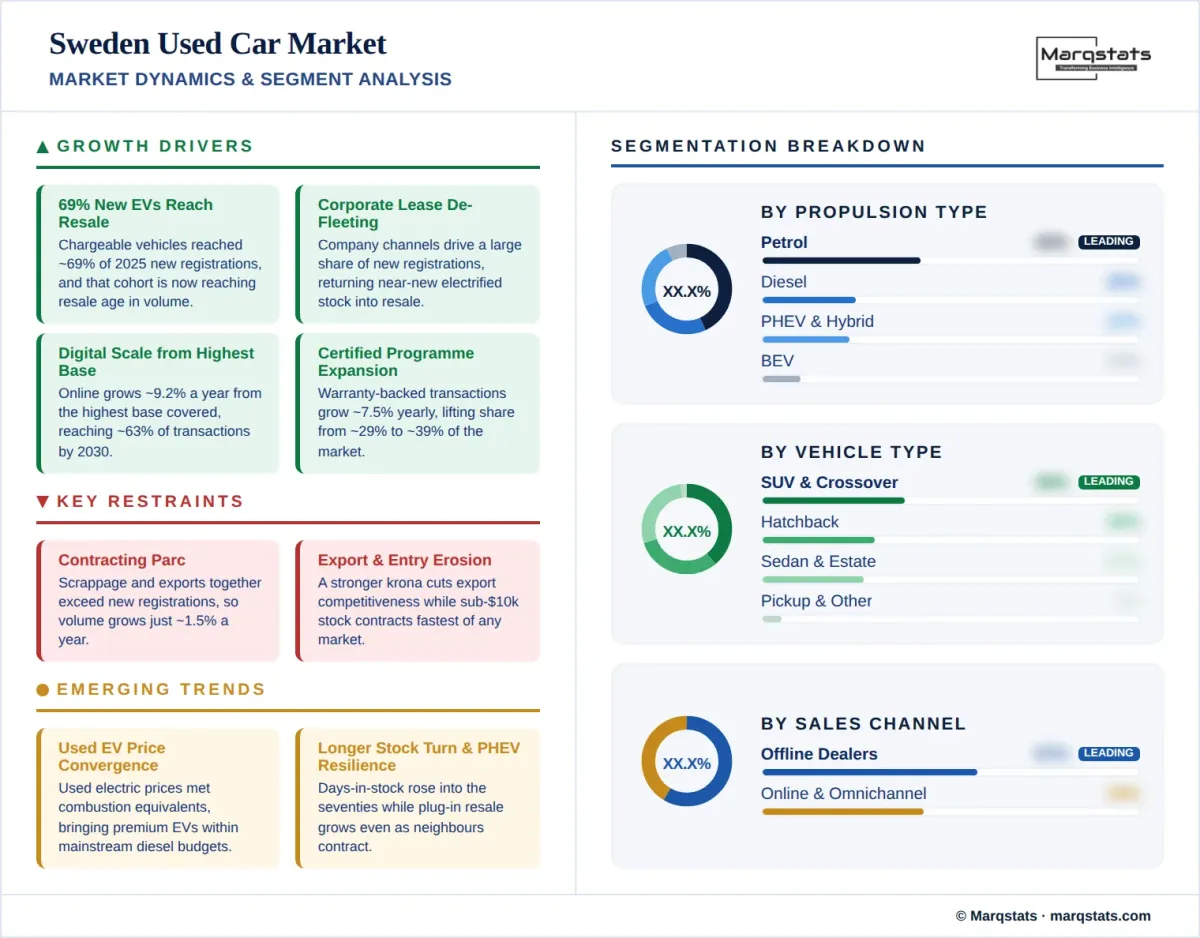
- Chargeable vehicles reached roughly 69% of new registrations in 2025, and that cohort is now reaching resale age in volume.
- Corporate and leasing fleets return large volumes of near-new electrified stock, as company channels account for a substantial share of Swedish new registrations.
- Digital and omnichannel retail scales at a 9.21% CAGR from the highest base covered, reaching about 63% of transactions by 2030.
- Certified programme expansion grows at a 7.50% CAGR, lifting warranty-backed share from about 29% of volume to about 39% by 2030.
- Professional channels capture private-seller share, as franchised networks grow at 4.09% and independent retailers at 3.73% annually.
Key Restraints
- Aggregate volume growth is limited to a 1.50% CAGR, as the domestic parc is contracting slightly with scrappage and exports together exceeding new registrations.
- Export dependence exposes the market to currency movement, as a stronger krona reduces export competitiveness and can create domestic overhang.
- Entry-price inventory is contracting fastest of any market covered, as transactions below USD 10,000 decline at a negative 10.31% CAGR.
- Household purchasing power remains constrained by elevated housing costs and electricity prices, limiting demand for higher-value stock.
Key Trends
- Used battery-electric prices have converged with combustion equivalents, bringing premium electric models within reach of mainstream diesel budgets for the first time.
- Dealer stock turn is lengthening, with average days in stock for vehicles up to ten years old rising into the seventies against a far lower median.
- Plug-in hybrid resale volumes continue to grow while the segment contracts in several neighbouring markets.
- Long-established domestic models retain disproportionate resale demand despite having left production more than a decade ago.
Market Segmentation
SUV and crossover models account for about 38% of 2025 volume, the largest body type and the only market in this series where they lead. The segment grows at a 4.73% CAGR to about 43% by 2030. Swedish demand for higher ground clearance, all-wheel drive, and winter capability supports the format across a country with long distances and severe seasonal conditions, and domestic manufacturers have concentrated their ranges in this segment for over a decade. Pickup trucks hold about 5% of transactions, the highest pickup share of any European market covered, growing at 3.43% annually.
Hatchbacks account for about 30% of 2025 volume and contract at 0.75% annually to about 26% by 2030. Sedans hold about 14% and decline faster at 1.80%, the sharpest body-style contraction in the market. Estate and wagon variants, captured within the sedan and other categories, retain disproportionate cultural and practical relevance in Sweden, and the most-traded used model in the country is a large estate discontinued more than a decade ago, which illustrates how slowly the format's resale demand decays.
Electrified vehicles account for about 31% of 2025 transactions, the highest share of any market covered, and reach about 53% by 2030. Battery-electric transfers grow from roughly 121 thousand units in 2025 to roughly 258 thousand by 2030, a 15.33% CAGR lifting share from about 10% to about 20%. Plug-in hybrids hold about 14% of transactions, the highest share in Europe, and grow at 6.59% annually to about 18%. Hybrids grow fastest among electrified segments at 16.64%. The plug-in hybrid concentration is a direct legacy of the bonus-malus structure that favoured them heavily during the late 2010s, and those vehicles are now circulating in the secondary market in volume.
Petrol accounts for about 42% of 2025 volume and declines at a 5.31% CAGR to about 30% by 2030, the steepest petrol contraction of any market in this series because electrified alternatives are displacing it directly rather than incrementally. Diesel holds about 25% of transactions and contracts faster still at a negative 8.79% CAGR to about 15%. Combined combustion share falls from about 67% to about 45% across the forecast period, the fastest transition away from combustion recorded in any market covered.
Independent dealers and professional retailers hold about 43% of 2025 volume, the largest seller channel, growing at a 3.73% CAGR to about 48% by 2030. Franchised networks hold about 22% and grow at 4.09% annually to about 25%. Dealer sales of vehicles up to ten years old have grown consistently through the review period, though stock turn has lengthened, with average days in stock rising into the seventies against a median in the low thirties, which indicates a widening spread between fast-moving and slow-moving inventory. Certified transactions grow at 7.50% annually from about 29% to about 39% of the market.
Private sellers handle about 35% of 2025 transactions and contract at a negative 3.76% CAGR to about 27% by 2030. The Swedish private channel is unusually digitally mediated, as classified platforms handle a large share of private-party listings and have extended into valuation, payment, and inspection services. Auction houses occupy a distinctive intermediate position, serving corporate, public-sector, and private sellers simultaneously, which blurs the boundary between private and professional channels more than in most European markets.
Online and omnichannel transactions hold about 43% of 2025 volume, the highest digital share of any market covered, and grow at a 9.21% CAGR to about 63% by 2030. Sweden combines early e-commerce adoption, high digital trust, and a dispersed population across long distances, which together make remote purchase and delivery both acceptable and economically sensible. Online auction platforms with physical inspection and valuation capability occupy a stronger position here than in most European markets.
Offline transactions hold about 57% of 2025 volume and decline at a negative 7.22% CAGR to about 37% by 2030, the steepest channel contraction in this series. Physical sites retain their role in trade-in appraisal, winter preparation, and warranty servicing, and the seasonal rhythm of the Swedish market concentrates activity in spring and autumn. Consolidation continues among the larger dealer groups, and operators combining physical presence with strong digital reach have been the principal beneficiaries.
Vehicles up to three years old account for about 15% of 2025 volume and grow at a 5.20% CAGR to about 18% by 2030, while the four-to-six-year cohort holds about 21% and grows at 4.21% to about 24%. Corporate and leasing returns are the dominant supply source for both cohorts, and because company channels account for a large share of Swedish new registrations, the near-new segment is unusually sensitive to corporate fleet renewal cycles and to the electrification mix of those fleets.
Vehicles aged seven to ten years hold about 23% of volume and grow at 2.36% annually. Vehicles older than ten years account for about 41% of 2025 transactions and contract at a negative 2.30% CAGR to about 34% by 2030. Export demand is a significant drain on this cohort, as roughly 160 thousand used vehicles leave Sweden annually, and scrappage removes a further substantial volume, so the oldest tier depletes faster here than in markets without an active export channel.
Transactions above USD 30,000 grow at a 6.50% CAGR from about 25% of 2025 volume to about 32% by 2030, reaching USD 10.54 billion and roughly half of total market value. The USD 20,001 to USD 30,000 band grows at 3.89% annually from about 24% to about 27%. Together the upper bands account for about 49% of transactions in 2025 rising to about 59% by 2030, the highest premium concentration of any market in this series, reflecting both a young electrified fleet and high household incomes.
Transactions below USD 10,000 account for about 18% of 2025 volume and fall to about 10% by 2030 at a negative 10.31% CAGR, the steepest entry-tier contraction of any market covered. The USD 10,001 to USD 20,000 band holds about 33% of transactions and remains broadly flat in unit terms. The rapid erosion of affordable stock is driven jointly by export demand for older vehicles and by scrappage, and it is the market's principal accessibility constraint for lower-income households.
By Geography
Stockholm & Eastern Sweden
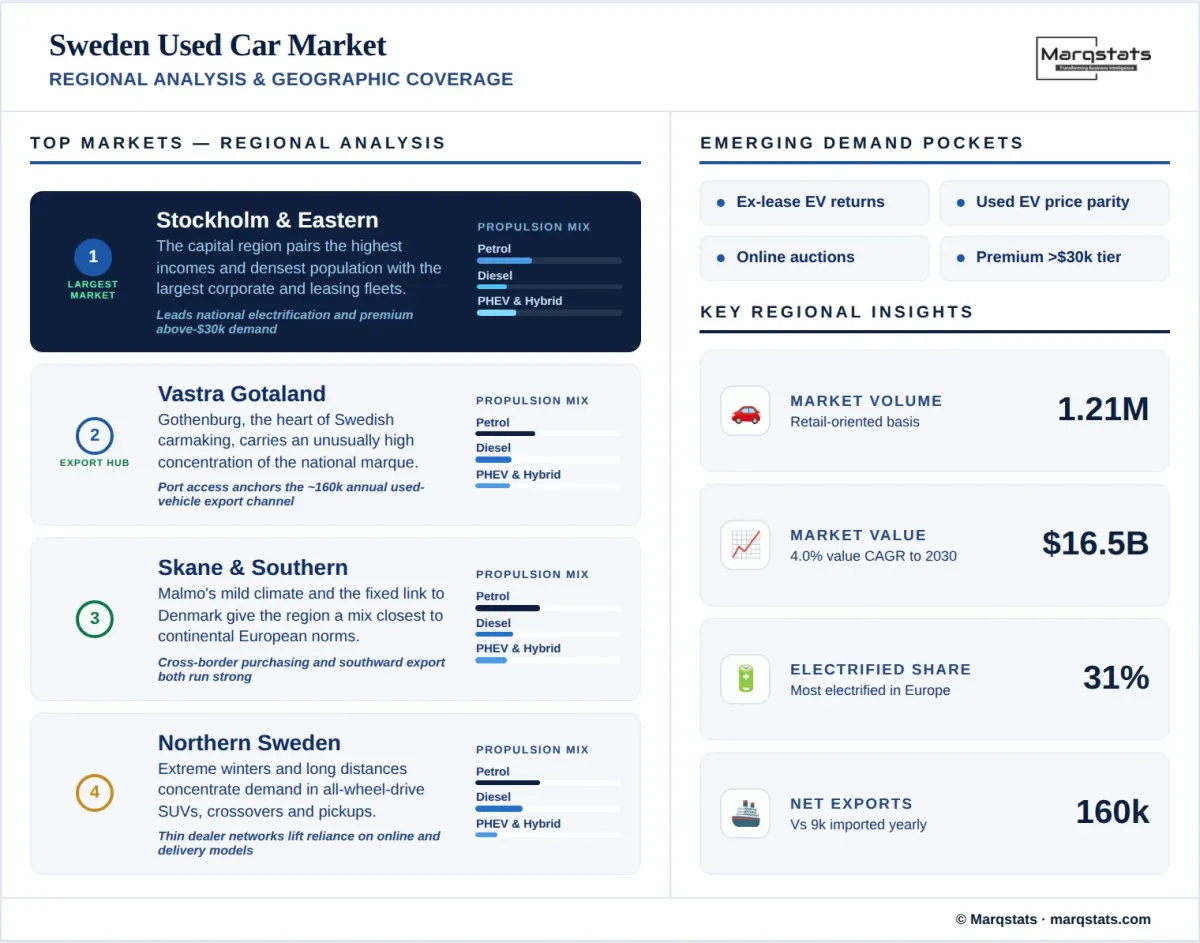
Stockholm and the surrounding eastern counties form the largest regional market, combining the highest household incomes in the country with the densest population and the largest concentration of corporate and leasing fleets. The region leads national electrification by a considerable margin, both in new registrations and in the resale stock that follows, and it carries the highest share of transactions above USD 30,000. Congestion charging and parking pressure in the capital support demand for smaller and electrified vehicles relative to the national mix.
Västra Götaland & Western Sweden
Västra Götaland, centred on Gothenburg, is the second-largest regional market and the heart of the Swedish automotive industry. Domestic manufacturer presence gives the region an unusually high concentration of the national marque in both new and used stock, alongside a dense supplier and dealer network. Port access supports the export channel that removes roughly 160 thousand used vehicles from the country annually, and proximity to Denmark and Norway sustains cross-border trade in both directions.
Skåne & Southern Sweden
Skåne, centred on Malmö, benefits from the mildest climate in the country and the shortest winters, which lengthens the usable season for lower-clearance vehicles and moderates the regional bias toward all-wheel drive. The fixed link to Denmark places Copenhagen and the continental road network within direct reach, supporting both cross-border purchasing and the export of used vehicles southward. The region carries a mix closer to continental European norms than any other part of Sweden.
Northern Sweden
Northern Sweden sustains a distinctive market shaped by extreme winter conditions, long distances, and sparse population across a very large area. Demand concentrates decisively in SUVs, crossovers, and pickups with all-wheel drive, and vehicles are retained longer than the national average, which raises the share of transactions involving older stock. Dealer networks are thin relative to the geography, so the region relies more heavily on digital channels and delivery-based purchase than anywhere else in the country.
How Competition Is Evolving
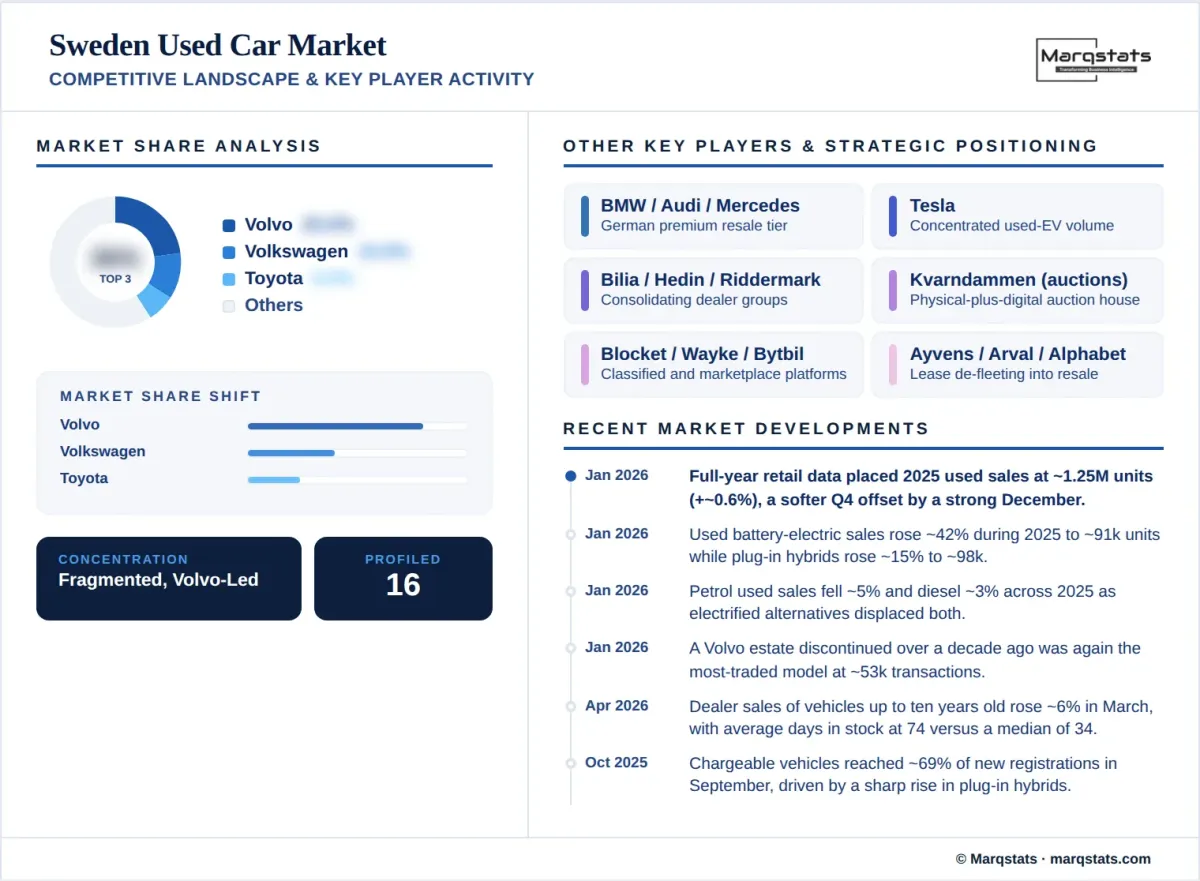
The Sweden used car market is fragmented, with private-party transactions accounting for about 35% of volume and the remaining professional volume distributed across franchised networks, consolidating dealer groups, online auction operators, and independent traders. No operator controls more than a low single-digit share of transactions. The market is nonetheless among the more formalised covered, with certified transactions at about 29% and online channels at about 43%, the latter the highest share of any market in this series.
At brand level the domestic marque leads decisively. Volvo holds the largest share of used transactions, supported by a parc accumulated over decades, a strong domestic manufacturing presence, and unusually durable resale demand for models long out of production. The most-traded used vehicle in Sweden during 2025 was a large Volvo estate discontinued more than ten years earlier, which exchanged hands roughly 53 thousand times. Volkswagen follows as the strongest foreign brand, supplying the second and third most-traded models, with the German premium marques, Toyota, and Tesla occupying the tier below.
Online auction platforms occupy a competitive position with no close parallel elsewhere in Europe. Operators combining physical inspection, professional valuation, and digital auction serve corporate, public-sector, and private sellers within a single channel, which blurs the conventional boundary between wholesale and retail. Their valuation data has also become a reference point for pricing across the wider market, giving them influence beyond their transaction share.
Competition centres on electrified remarketing capability and on stock turn. With the most electrified used fleet in Europe, professional operators compete on battery condition assessment, warranty structuring, and residual-risk management rather than on conventional reconditioning alone. Stock turn has lengthened, with average days in stock rising into the seventies against a median in the low thirties, and that widening spread rewards operators who can price and move slow-moving electrified inventory. Export capability forms a second competitive layer, as the operators able to place older stock into foreign markets protect margin on trade-ins that would otherwise depreciate on the forecourt.
Companies Covered
The report profiles 16+ companies with full strategy and financials analysis, including:
Recent Market Activity
Table of Contents
Coverage & Segmentation
This report provides a comprehensive assessment of the Sweden used car market across a 2025 base year, historical data from 2021 to 2025, and forecasts spanning 2026 to 2030. Market sizing is presented in unit-volume terms and complemented by value analysis in United States dollars, with segmentation by vehicle type, propulsion type, seller type, sales channel, vehicle age, vehicle mileage, price band, certification status, vehicle positioning, and brand. The transaction layer counted is the passenger-car secondary transaction on a retail-oriented basis. Historical volumes are Marqstats research estimates rather than a verified published series, and this is disclosed in full in the Report Summary.
The scope covers demand drivers, restraints, and structural trends, with particular focus on the most electrified used fleet in Europe, the plug-in hybrid legacy of the bonus-malus structure, the net export position and its currency sensitivity, the dominance of SUVs and crossovers, lengthening dealer stock turn, and the reconciliation of competing transaction definitions. Comparative benchmarking is drawn from adjacent Marqstats coverage, including the Netherlands used car market, the closest analogue on electrification and channel formalisation among the markets covered.
Readers examining Swedish vehicle demand more broadly may also refer to the Sweden two-wheeler market, which covers the same territory across a different vehicle class. An extended forecast to 2035 is available under customization for subscribers requiring a longer planning horizon, alongside deeper cuts by region, brand, or channel on request.