Market Snapshot
Key Takeaways
Market Overview & Analysis
Report Summary
The Italy used car market comprises passenger-car ownership transfers recorded in the public vehicle registry, net of dealer holding formalities, sold through manufacturer-franchised networks, independent dealers and professional retailers, digital operators, and direct private-party channels. This study segments demand by vehicle type, propulsion type, seller type, sales channel, vehicle age, vehicle mileage, price band, certification status, vehicle positioning, and brand, with a 2025 base year, historical coverage from 2021 to 2025, and forecasts to 2030. Sizing is presented in unit-volume terms and complemented by value analysis in United States dollars.
Italy carries the widest definitional gap of any European used-car market, and readers must resolve it before comparing any published figure. When a dealer takes a vehicle into stock, a temporary transfer is registered in the dealer's name pending resale to the final customer. Counting these holding formalities alongside the eventual retail sale records the same physical car twice. Gross series constructed this way can exceed 5.6 million transfers annually, against 3.22 million on a net basis. Marqstats sizes exclusively on net transfers, which is why this report is materially smaller than sources that do not disclose their treatment. Diesel is heavily over-represented in the holding formalities themselves, at roughly 43% of that sub-population, so the gross series also distorts propulsion mix.
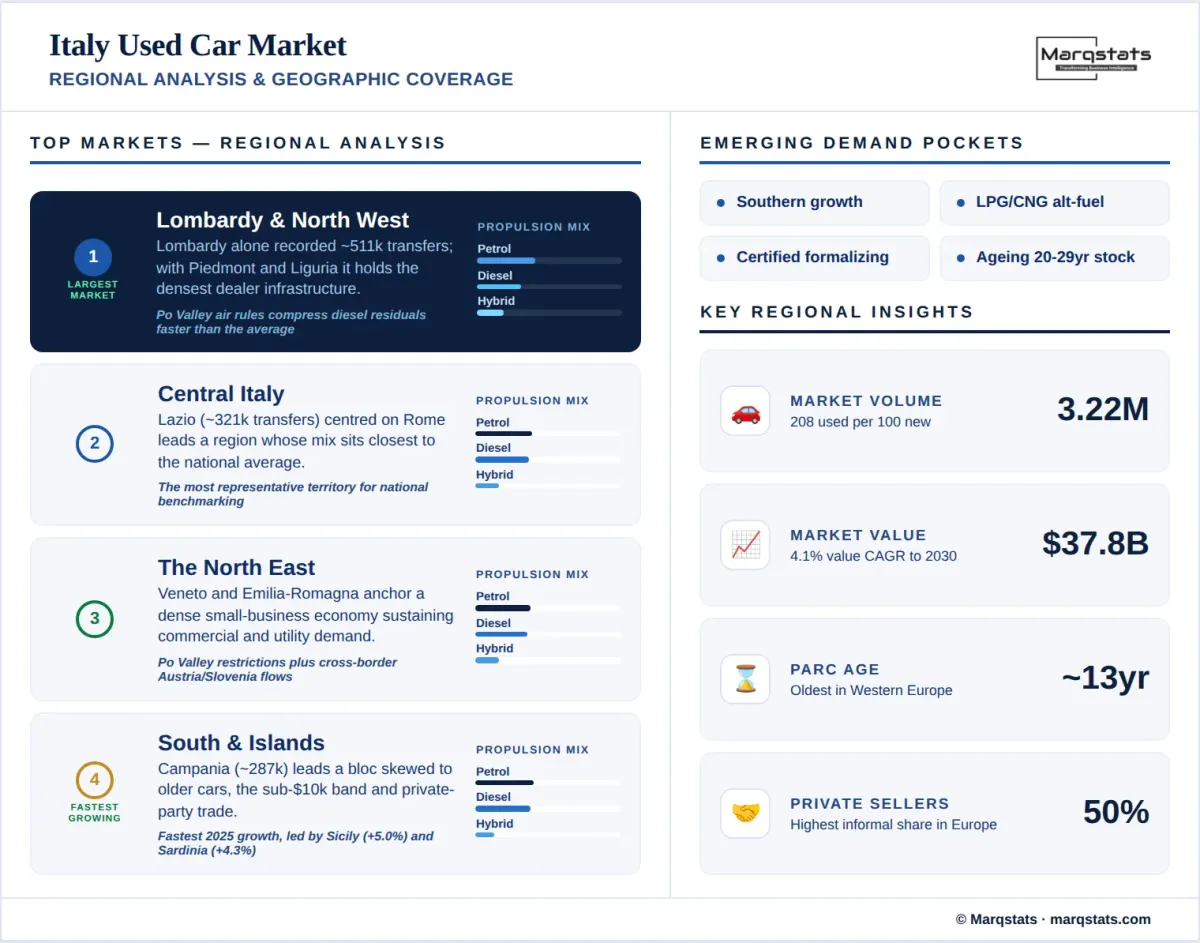
Supply is governed by an ageing parc rather than by new-car inflow. New registrations run near 1.5 million units against 3.22 million transfers, a ratio of 208 used cars per 100 new. Deregistrations fell 6.5% in 2025, and Euro 4 vehicles accounted for roughly 37% of removals through the first half of 2026, which indicates the scrappage frontier has moved to vehicles registered in the late 2000s. Until that frontier advances, the pool of tradeable stock keeps deepening at the old end while the supply of vehicles under six years old stays thin.
Propulsion mix reflects the same slow renewal. Roughly three of every four used cars traded are petrol or diesel, and Italy retains the largest liquefied petroleum gas and natural gas car population in Europe, which sustains an alternative-fuel segment absent from neighbouring markets. Petrol transfers grew about 2.1% in 2025 while diesel fell about 5.4%. Battery-electric vehicles account for about 1.5% of transfers against roughly 8.5% of new registrations, the widest new-to-used electrification gap in Western Europe, which reflects how recently electric adoption began in Italy.
Market Dynamics
Key Drivers
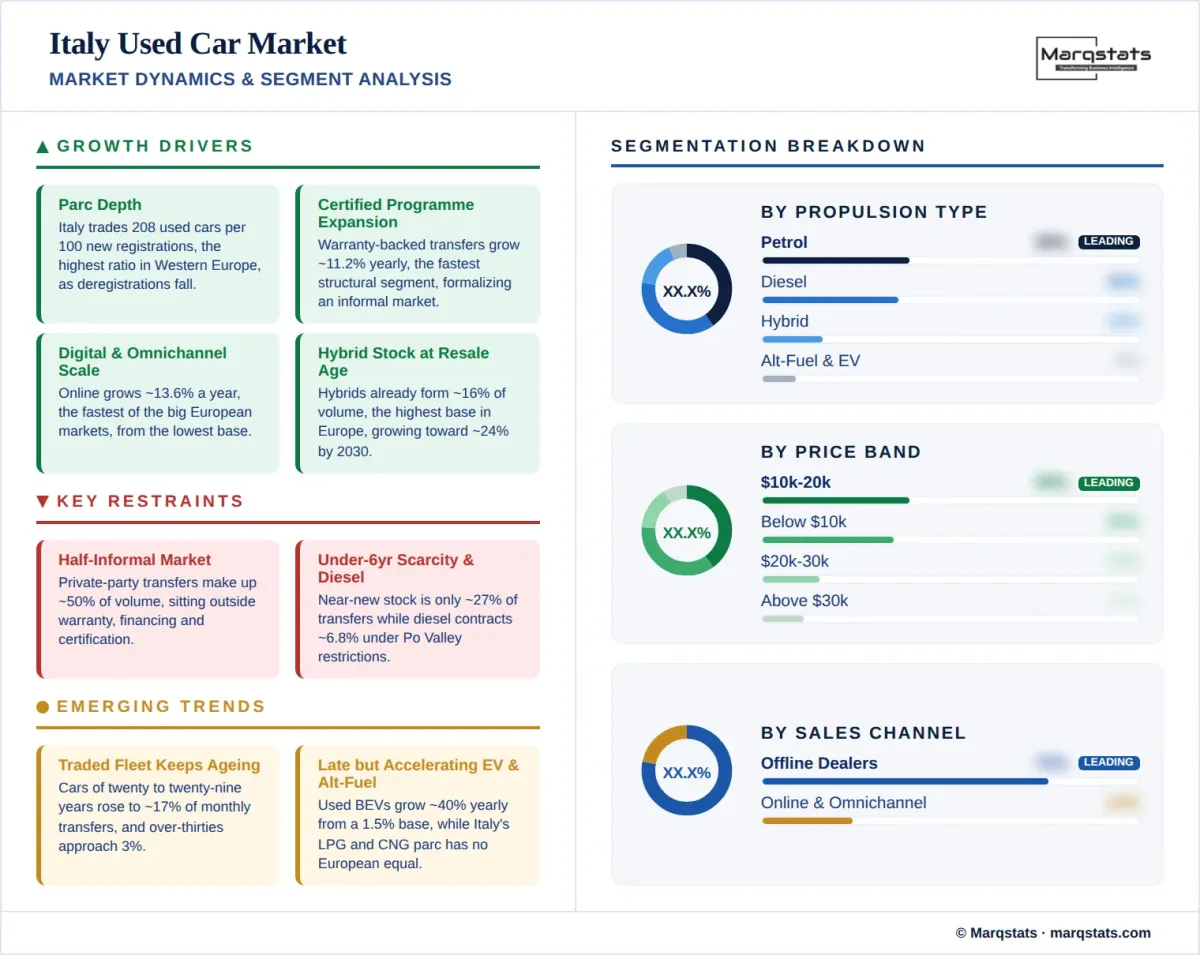
- Parc depth sustains a structural transfer base, as Italy trades 208 used cars per 100 new registrations and deregistrations continue to fall.
- Certified programme expansion grows fastest of any structural segment at an 11.19% CAGR, formalising a market where informal transactions still dominate.
- Digital and omnichannel retail scales at a 13.56% CAGR, the fastest channel growth among the large European markets, from the lowest base.
- Hybrid stock reaches resale age in volume, as hybrid transfers grow at 9.60% annually from an already substantial 16% base.
- Franchised networks grow fastest among seller types at a 5.12% CAGR, capturing share from private sellers through warranty-backed programmes.
Key Restraints
- Half the market remains informal, as private-party transfers account for about 50% of volume and sit outside warranty, financing, and certification structures.
- Vehicles under six years old are scarce, representing about 27% of transfers against roughly 42% in the United Kingdom, which constrains certified programme inventory.
- Diesel contracts at a negative 6.76% CAGR under regional circulation restrictions across the Po Valley and metropolitan low-emission zones.
- Entry-price inventory is eroding, as transfers below USD 10,000 decline at a negative 3.83% CAGR from about 35% of volume to about 27% by 2030.
Key Trends
- The traded fleet keeps ageing, as vehicles of twenty to twenty-nine years rose to close to 17% of monthly transfers from under 15% a year earlier.
- Electrification arrives late yet accelerates, with used battery-electric transfers growing about 40% year on year from a 1.5% base.
- Alternative fuels retain structural relevance, as Italy's liquefied petroleum gas and natural gas parc has no equivalent in Germany, France, or the United Kingdom.
- Southern regions and the islands outpace the national average, with the fastest 2025 growth recorded in Sicily, Sardinia, and Trentino-Alto Adige.
Market Segmentation
Hatchbacks account for about 45% of 2025 volume and hold flat in unit terms while easing to about 42% by 2030. The concentration reflects the dominance of city cars and superminis in the Italian parc, and the single most-traded model in the country is a city car that alone represents roughly 8% of transfers. Sedans hold about 15% of volume, a higher share than in France or the United Kingdom, and contract at 0.87% annually as the format loses relevance outside the premium segment.
SUV and crossover models hold about 24% of 2025 volume and grow at a 5.57% CAGR, reaching about 29% by 2030, the strongest growth of any body style. Penetration trails German and British levels because the Italian parc renews slowly and crossover formats entered the domestic range later. MPV and minivan models retain about 8% of transfers. Pickup trucks remain marginal at about 2% of volume, though they grow at 5.12% annually.
Petrol is the largest fuel type at about 39% of 2025 volume, declining gently at 1.36% annually to about 34% by 2030. Diesel holds about 36% and contracts at a negative 6.76% CAGR to about 24%, driven by circulation restrictions across the Po Valley regions and metropolitan low-emission zones rather than by any shift in buyer preference. Alternative fuels, principally liquefied petroleum gas and compressed natural gas, account for roughly 5% of transfers and grow modestly, a segment with no meaningful equivalent in Germany, France, or the United Kingdom.
Hybrids are already the third-largest fuel type at about 16% of 2025 volume, a higher base than any comparable European market, and grow at 9.60% annually to about 24% by 2030. Battery-electric transfers grow from roughly 48 thousand units in 2025 to roughly 241 thousand units by 2030, a 29.92% CAGR and the fastest of any propulsion segment, lifting share from about 1.5% to about 7%. The gap between a 1.5% used share and roughly 8.5% of new registrations is the widest new-to-used electrification gap in Western Europe, and it will close only as the recent registration cohorts reach resale age.
Private sellers handle about 50% of 2025 transfers, the highest informal share in Western Europe and well above the French, German, and British equivalents. The concentration follows directly from the age profile, as vehicles older than ten years rarely justify professional reconditioning and warranty cover. The channel contracts at a negative 2.11% CAGR to about 42% by 2030, however it remains the largest single seller type throughout the forecast period, and its persistence is the principal reason certified penetration in Italy trails its neighbours.
Independent dealers and professional retailers hold about 35% of 2025 volume and grow at a 4.13% CAGR to about 40% by 2030. Franchised networks hold about 15% of volume, the lowest franchised share among the large European markets, and grow fastest among seller types at 5.12% annually to about 18% by 2030. Certified and warranty-backed transfers grow at 11.19% annually, the fastest structural segment in the market, rising from about 16% of the total to about 26% as manufacturer programmes and consolidated dealer groups formalise professional supply.
Offline transactions hold about 76% of 2025 volume, the highest offline share among the large European markets, and decline at a negative 4.75% CAGR to about 56% by 2030. Unlike Germany, France, and the United Kingdom, online retail does not overtake offline within the forecast period. The persistence of physical transactions follows from the age and value profile of the traded fleet, as low-value older vehicles are more often inspected in person, paid for directly, and transferred without financing.
Online and omnichannel transactions hold about 24% of 2025 volume and grow at a 13.56% CAGR, the fastest channel growth among the large European markets, reaching about 44% of transfers by 2030. The low starting base is the opportunity, as Italian classifieds platforms carry very large private-listing volumes that have historically generated leads rather than completed transactions. Operators combining reconditioning capacity with integrated financing and delivery have captured most of the conversion to date.
Vehicles older than ten years account for about 50% of 2025 volume, the highest concentration in Western Europe, contracting at a negative 1.63% CAGR to about 43% by 2030. Within that cohort, cars aged twenty to twenty-nine years alone represent close to 17% of monthly transfers and their share has risen year on year, while vehicles over thirty years old now approach 3%. Vehicles aged seven to ten years hold about 23% of volume. Together these cohorts represent roughly three-quarters of all transfers, which is the structural reason average transaction price sits below every comparable market.
Vehicles up to three years old account for about 11% of 2025 volume, the smallest near-new share among the large European markets, and grow at a 6.31% CAGR to about 14% by 2030, the fastest growth of any age cohort. The four-to-six-year band holds about 16% and grows at 4.91%. Both cohorts are constrained by weak new-car registration volumes across the 2020 to 2023 period, and their recovery is the precondition for certified programme expansion and for franchised network growth.
Transfers below USD 10,000 account for about 35% of 2025 volume, the largest entry-tier share among the major European markets, and fall to about 27% by 2030 at a negative 3.83% CAGR. The USD 10,001 to USD 20,000 band is the volume core at about 39% of transfers and holds flat in unit terms while easing to about 37% of share. Together these bands represent roughly three-quarters of all transactions in 2025, a concentration that reflects both the age of the traded fleet and household purchasing power across the southern regions.
The USD 20,001 to USD 30,000 band grows at 5.12% annually from about 15% of volume to about 18%. Transfers above USD 30,000 grow fastest at 11.33% annually, the strongest price-band growth in any of the major European markets, rising from about 11% of volume to about 18% and reaching USD 18.09 billion by 2030. Premium and luxury vehicles account for about 15% of transfers, and the segment's expansion is the principal driver of the gap between volume and value growth.
By Geography
Lombardy & the North West
Lombardy is the largest regional market by a wide margin, recording roughly 511 thousand transfers in 2025, about a sixth of the national total. Together with Piedmont, Liguria, and the Aosta Valley, the north west combines the highest household incomes in the country with the densest dealer and remarketing infrastructure. The region also carries the most restrictive circulation rules, as Po Valley air quality measures bar older diesel vehicles from wide areas during winter months, which compresses diesel residuals faster than the national average.
The North East
Veneto, Emilia-Romagna, Friuli Venezia Giulia, and Trentino-Alto Adige form a substantial market anchored by a dense small-business economy that sustains commercial and light utility demand. Trentino-Alto Adige recorded among the fastest transfer growth in the country in 2025 at about 3.8%. The region shares the Po Valley circulation restrictions that affect Lombardy and Piedmont, and cross-border proximity to Austria and Slovenia supports import and export flows that influence local pricing.
Central Italy
Lazio is the second-largest regional market with roughly 321 thousand transfers in 2025, concentrated in the Rome metropolitan area, where a restrictive urban low-emission zone shapes local demand. Tuscany, Marche, Umbria, and Abruzzo complete the central regions, combining metropolitan demand around Florence with dispersed provincial markets. The regional mix sits close to the national average across body type and propulsion, which makes central Italy the most representative territory for national benchmarking.
The South & Islands
Campania is the third-largest regional market with roughly 287 thousand transfers in 2025, and together with Puglia, Sicily, Calabria, Sardinia, Basilicata, and Molise the southern regions and islands account for the largest share of national volume. The mix skews decisively toward older vehicles, the sub-USD 10,000 price band, and private-party transactions, reflecting lower household incomes and thinner professional retail networks. Growth is nonetheless strongest here, with Sicily up about 5.0% and Sardinia about 4.3% in 2025, against a small decline in Molise.
How Competition Is Evolving
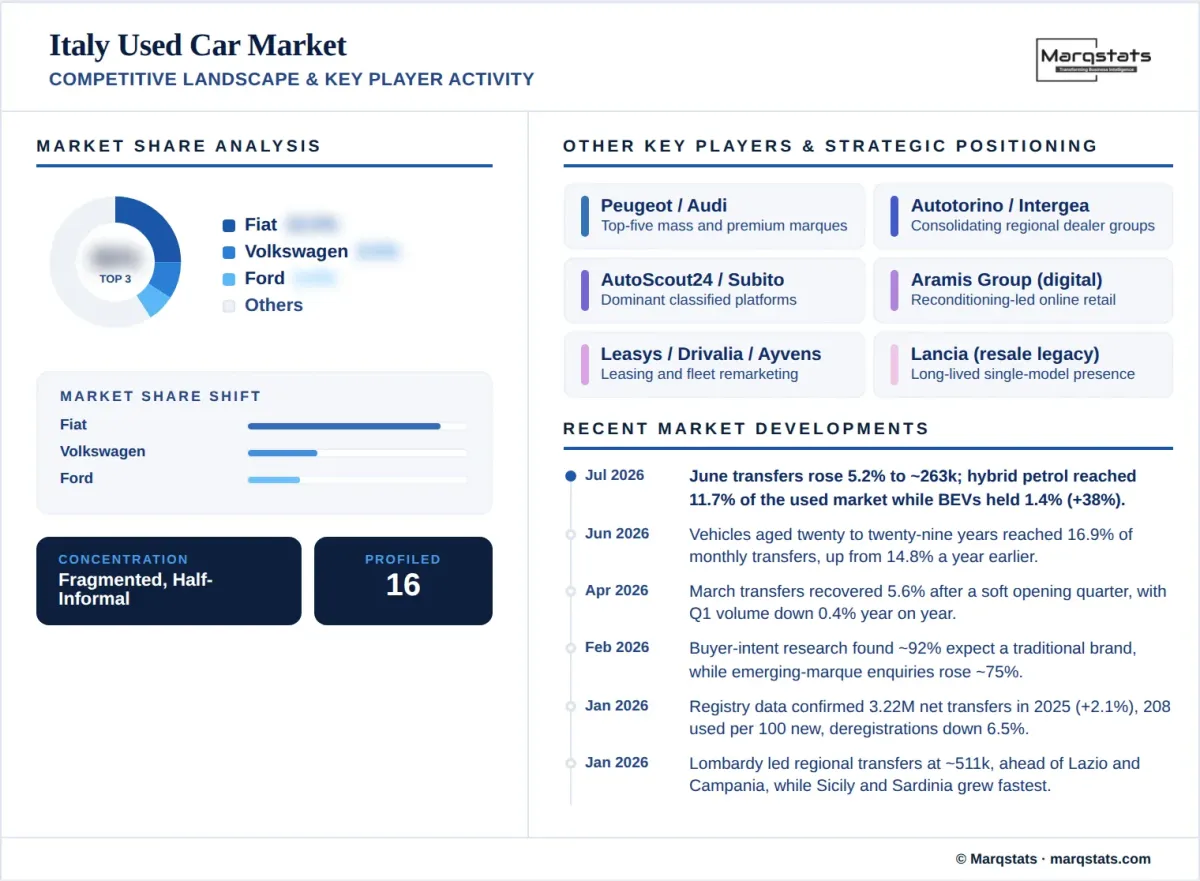
The Italy used car market is fragmented, and half of it operates outside professional retail entirely. Private-party transfers accounted for about 50% of 2025 volume, and the remaining professional volume is distributed across franchised networks, consolidating regional dealer groups, and several thousand independent traders. No operator controls more than a low single-digit share. Concentration is increasing at the margin as certified programmes grow at 11.19% annually and consolidated groups acquire independent sites, however Italy remains structurally the most informal of the large European markets.
At brand level Italy is the most concentrated market in Western Europe. Fiat leads with roughly 22% of transfers, more than Volkswagen, Ford, and Peugeot combined, and the marque supplies three of the five most-traded models in the country. Volkswagen follows at roughly 8%, then Ford at roughly 6%, Peugeot at roughly 5%, and Audi at roughly 5%. The ranking reflects the composition of the ageing parc rather than current registration performance, and Lancia retains a meaningful resale presence on the strength of a single long-lived model despite a minimal current range.
Model-level concentration reinforces the pattern. The single most-traded model accounts for roughly 8% of all transfers and close to three times the volume of the second-placed car, a degree of concentration no other large European market approaches. Emerging marques recorded roughly 75% growth in used enquiries during 2025, though from a base small enough to remain immaterial to overall share, and buyer intent research indicates that the large majority of Italian used-car buyers still expect to purchase a traditional brand.
Competition centres on formalisation rather than on marketplace liquidity. Classifieds platforms already carry enormous private-listing volume, so professional operators compete on their ability to convert informal supply into warranted, financed, and reconditioned retail stock. Manufacturer-backed certified programmes and captive leasing remarketing channels provide the main route, and their growth rates are the fastest of any structural segment in the market. Reconditioning throughput, warranty economics, and financing attachment determine profit per unit far more than vehicle margin alone.
Companies Covered
The report profiles 16+ companies with full strategy and financials analysis, including:
Recent Market Activity
Table of Contents
Coverage & Segmentation
This report provides a comprehensive assessment of the Italy used car market across a 2025 base year, historical data from 2021 to 2025, and forecasts spanning 2026 to 2030. Market sizing is presented in unit-volume terms and complemented by value analysis in United States dollars, with segmentation by vehicle type, propulsion type, seller type, sales channel, vehicle age, vehicle mileage, price band, certification status, vehicle positioning, and brand. The transaction layer counted is the net passenger-car ownership transfer recorded in the public vehicle registry, explicitly excluding dealer holding formalities that would otherwise record the same vehicle twice.
The scope covers demand drivers, restraints, and structural trends, with particular focus on the net-versus-gross definitional gap, the ageing of the traded fleet, the persistence of informal private-party transactions, regional circulation restrictions on diesel vehicles, the alternative-fuel segment, and the late yet accelerating arrival of electrified stock. Comparative benchmarking is drawn from adjacent Marqstats coverage, including the Germany used car market, which permits comparison of certified penetration, channel structure, and average transaction price against Europe's largest used-vehicle market by value.
Further comparison is available against the France used car market, the closest structural analogue to Italy in age profile and private-seller share. An extended forecast to 2035 is available under customization for subscribers requiring a longer planning horizon, alongside deeper cuts by region, brand, or channel on request.