Market Snapshot
Key Takeaways
Market Overview & Analysis
Report Summary
The South Africa used car market comprises used passenger vehicle transactions recorded across all nine provinces in a calendar year, transacted through manufacturer-franchised networks, independent dealers, digital platforms, auction operators and direct private-party sales. This study segments demand by vehicle type, propulsion type, seller type, sales channel, vehicle age, vehicle mileage, price band, certification status, vehicle positioning, and brand, with a 2025 base year, historical coverage from 2021 to 2025, and forecasts to 2030.
Two measures of this market circulate and readers should distinguish them. Platform-tracked dealer sales, reported annually by the country's principal automotive marketplace, reached 383.41 thousand units in 2025 generating about R160.1 billion, up 7% on 2024. That series covers advertised dealer stock and reports an average vehicle age of five years, an average model year of 2020, average mileage of 73,646 kilometres and an average price of R417,584. This report counts total used passenger vehicle transactions at 1.26 million, which includes private-party sales and older stock that never reaches dealer advertising.
The two series are complementary rather than contradictory, and the gap between them is informative. The tracked channel represents roughly 30% of transaction volume yet a substantially larger share of value, because advertised dealer stock skews young and higher-priced. That is why the platform reports an average price more than double the total-market average transaction price of USD 10,952. Anyone modelling the professional retail opportunity should work from the narrower series; anyone sizing the total market should not.
Interest rates drove the year. Four cuts in January, May, July and November removed 100 basis points from borrowing costs, and vehicle finance responded directly. Buyer behaviour nonetheless stayed disciplined, with the average tracked price rising only about 3% year on year, and demand shifting toward smaller and more economical vehicles. Compact hatchbacks gained momentum in the tracked channel, and the fastest-selling used vehicle of the year moved in an average of 26 days.
Market Dynamics
Key Drivers
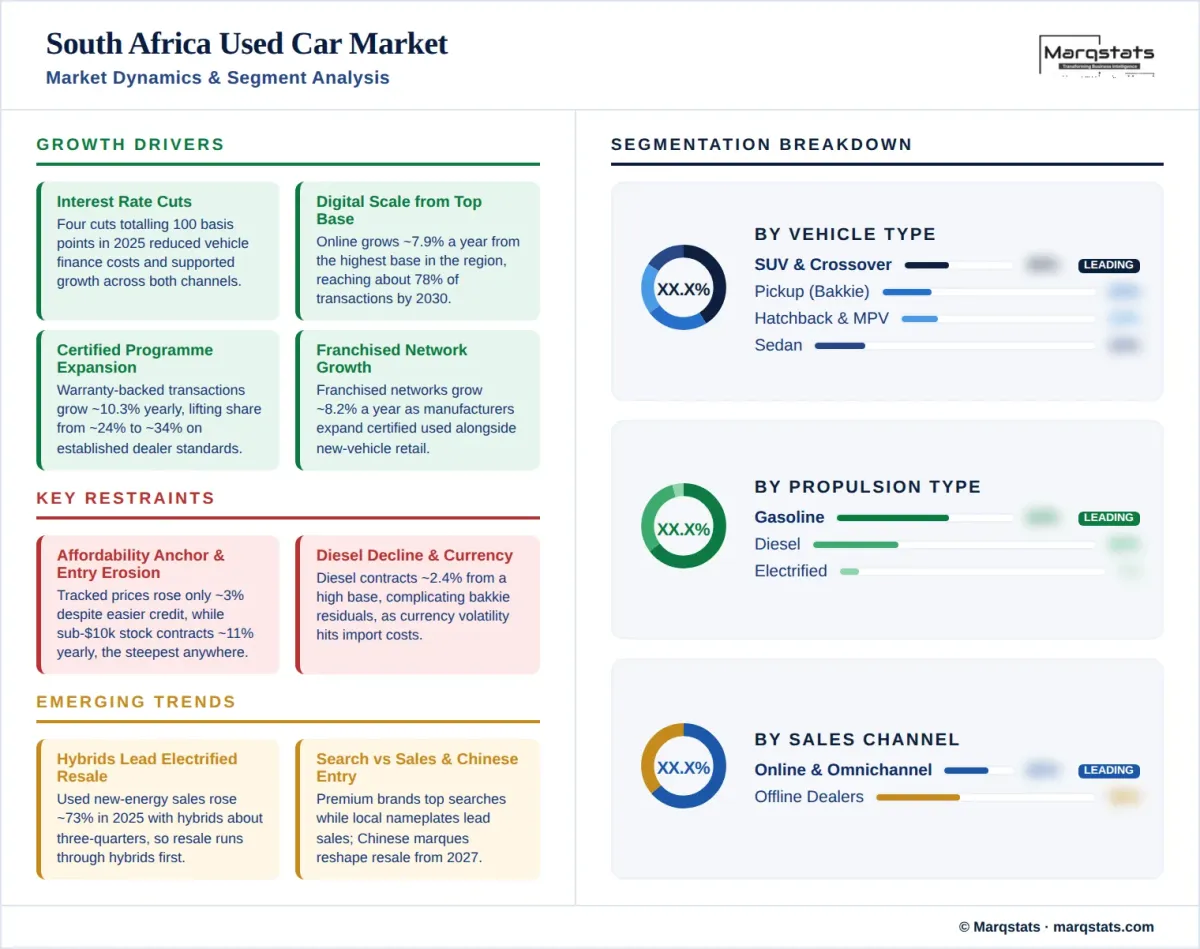
- Interest rate cuts totalling 100 basis points during 2025 reduced vehicle finance costs and supported transaction growth across both channels.
- Digital and omnichannel retail scales at a 7.85% CAGR from the highest base in the region, reaching about 78% of transactions by 2030.
- Certified programmes grow at a 10.27% CAGR, lifting warranty-backed share from about 24% of volume to about 34% by 2030.
- Franchised networks grow at an 8.17% CAGR as manufacturers expand certified used operations alongside new-vehicle retail.
- Chinese marques have expanded rapidly in new sales and will supply growing resale volumes from 2027 onward.
Key Restraints
- Affordability continues to anchor purchasing decisions, with tracked average prices rising only about 3% despite improving credit conditions.
- Entry-price inventory contracts at a negative 10.97% CAGR, the steepest decline of any segment in this market.
- Diesel contracts at a negative 2.35% CAGR from a comparatively high base, complicating residual planning for bakkie and utility stock.
- Currency volatility affects import costs and dollar-denominated valuations even where unit demand is stable.
Key Trends
- Compact hatchbacks are gaining momentum in the tracked dealer channel as buyers prioritise running costs over badge.
- Used new-energy vehicle sales rose about 73% in 2025, with hybrids accounting for roughly three-quarters of that volume.
- Search interest and transaction volume have diverged, with premium brands topping searches while established local nameplates lead sales.
- Chinese marques are reshaping the new-vehicle ranking, which will feed through into resale composition from 2027.
Market Segmentation
Pickup trucks account for about 23% of 2025 volume, the highest pickup concentration of any market in this study, and grow at a 4.00% CAGR to about 24% by 2030. Locally assembled models dominate both new sales and resale, and the most-enquired used vehicle in the tracked channel during 2025 was a bakkie. Sport-utility and crossover models add about 40% of transactions and grow at 6.44% annually to about 47%. Together light trucks represent about 64% of the market, a concentration comparable only to North America.
Sedans account for about 18% of 2025 volume and contract at a negative 2.05% CAGR to about 14% by 2030. Hatchbacks hold about 9% of transactions and contract fastest of any body style at a negative 5.03% CAGR, though the tracked dealer channel shows compact hatchbacks gaining share as buyers prioritise running costs, which indicates the decline is concentrated in the older private-party segment rather than in dealer retail. MPV and minivan models hold about 5% of volume.
Gasoline accounts for about 63% of 2025 volume and contracts at 1.23% annually to about 51% by 2030. Diesel holds about 30% of transactions, the highest diesel concentration in the Middle East and Africa by a wide margin, and contracts at a negative 2.35% CAGR to about 23%. The diesel share follows directly from the bakkie and sport-utility weighting of the parc, since both segments are predominantly diesel-powered in the South African market, and it makes residual planning for utility stock a distinct commercial question here.
Battery-electric transfers grow from roughly 15 thousand units in 2025 to roughly 118 thousand by 2030, a 37.11% CAGR that lifts share from about 1.2% to about 8%. Hybrids grow at 25.41% annually to about 14% of volume and plug-in hybrids at 33.13% to about 2%. Used new-energy vehicle sales rose about 73% during 2025, with hybrids accounting for roughly three-quarters of that volume, confirming that South African electrified resale is running through hybrids first rather than through full electrification.
Independent dealers and professional retailers hold about 42% of 2025 volume, the largest seller channel, growing at a 6.71% CAGR to about 50% by 2030. Franchised networks hold about 18% and grow at 8.17% annually to about 23%. Certified and warranty-backed transactions grow at 10.27% annually from about 24% of the market to about 34%, a comparatively high base for the region reflecting established dealer standards, vehicle history reporting and online valuation tooling.
Private sellers handle about 40% of 2025 transactions and contract at a negative 4.95% CAGR to about 27% by 2030, one of the steeper private-channel declines in this study. The availability of vehicle history reports and online valuation tools has reduced the information advantage that private transactions once carried, and buyers increasingly accept a professional-channel premium in exchange for documented condition and finance access.
Online and omnichannel transactions hold about 62% of 2025 volume, the highest digital penetration in the Middle East and Africa and comparable to the most digital markets covered anywhere, and grow at a 7.85% CAGR to about 78% by 2030. The country's principal automotive marketplace recorded more than 46 million users and 156 million sessions during 2025, with average session duration close to four minutes, indicating research-driven rather than impulse purchasing. Vehicle history reporting and online valuation tooling are standard rather than differentiating.
Offline transactions hold about 38% of 2025 volume and decline at a negative 8.05% CAGR to about 22% by 2030, the steepest channel contraction in this study. Physical sites retain their role in trade-in appraisal, finance origination and the handling of bakkie and utility stock where in-person inspection carries more weight. Franchised groups and larger independents with strong digital presence have gained ground, while smaller lots without online reach have contracted fastest.
Vehicles older than ten years account for about 33% of 2025 transactions and contract at a negative 3.43% CAGR to about 24% by 2030. Vehicles aged seven to ten years hold about 25% and grow at 3.93% annually. Together these cohorts represent about 58% of total volume, concentrated heavily in the private-party channel: the tracked dealer series reports an average vehicle age of five years, which confirms that older stock trades largely outside professional retail.
Vehicles up to three years old account for about 18% of 2025 volume and grow at a 7.25% CAGR to about 22% by 2030. The four-to-six-year cohort holds about 24% and grows at 6.30% to about 28%, becoming the largest single age band. Corporate fleet and rental disposals supply much of this stock, and the tracked dealer channel reports an average model year of 2020 with average mileage of 73,646 kilometres, consistent with a professional segment concentrated in this age range.
Transactions below USD 10,000 account for about 20% of 2025 volume and contract at a negative 10.97% CAGR to about 10% by 2030, the steepest entry-tier decline of any market in this study. The USD 10,001 to USD 20,000 band is the volume core at about 40% of transactions and grows at 1.51% annually. The rapid erosion of the affordable tier is the market's principal accessibility constraint, and it runs against the wider affordability-driven purchasing behaviour reported in the tracked channel.
The USD 20,001 to USD 30,000 band grows at 6.88% annually from about 25% of volume to about 30%. Transactions above USD 30,000 grow at 11.88% annually, rising from about 15% of volume to about 23% and reaching USD 7.77 billion by 2030. Premium and luxury vehicles hold about 19% of transactions, the highest premium share in the Middle East and Africa, and the most-searched brand in the tracked channel during 2025 was a German premium marque despite established local nameplates dominating actual sales.
By Geography
Gauteng
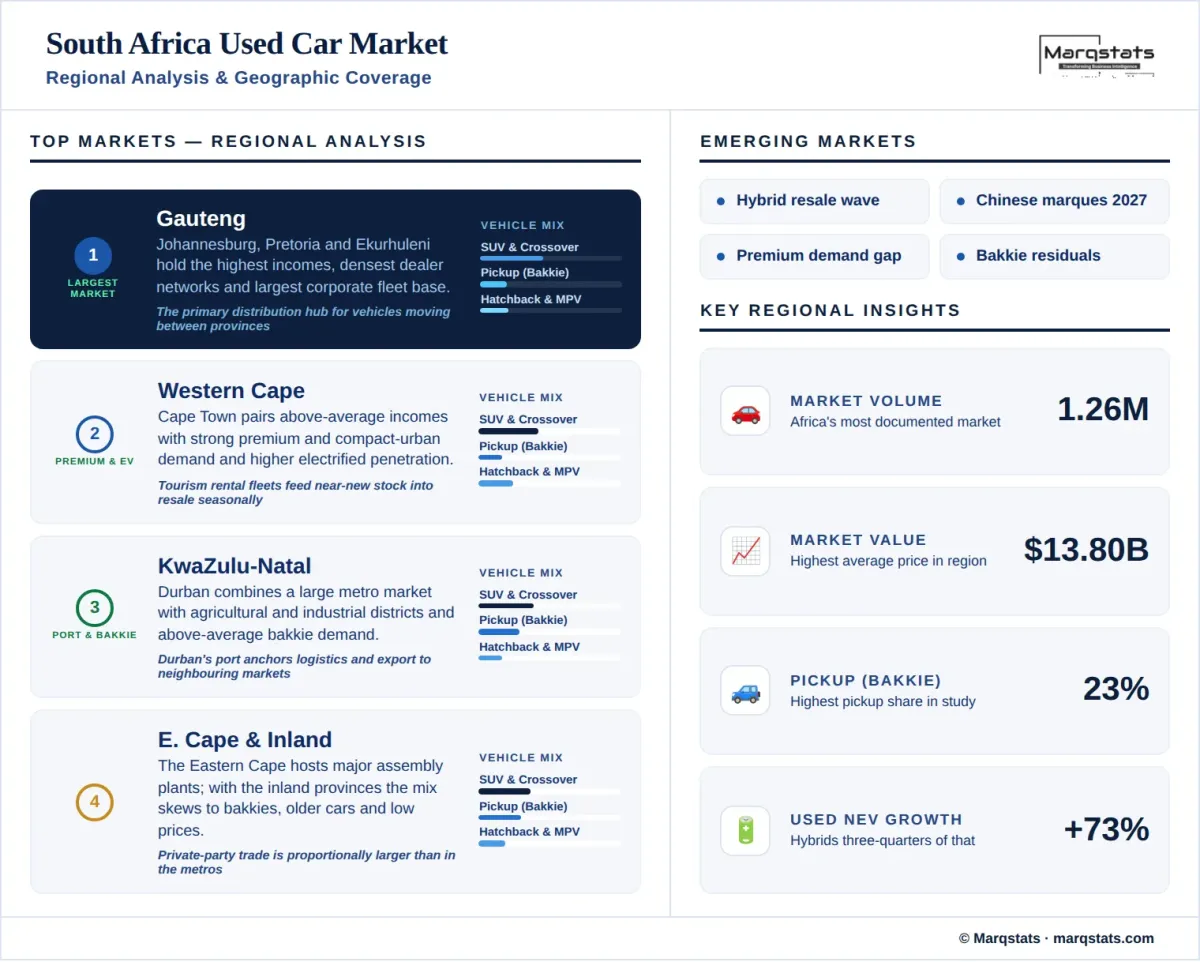
Gauteng, encompassing Johannesburg, Pretoria and the Ekurhuleni metro, forms the largest regional market by both volume and value. The province concentrates the highest household incomes, the densest franchised and independent dealer networks, and the largest corporate fleet base in the country. Premium and certified penetration both run well above the national average, and the province functions as the primary distribution hub for vehicles moving between regions.
Western Cape
The Western Cape, centred on Cape Town, forms the second-largest market by value with household incomes above the national average and strong demand for both premium vehicles and compact urban models. The province records above-average electrified penetration, supported by higher disposable incomes and greater charging availability. Tourism-driven rental fleets supply a seasonal flow of near-new stock into the secondary market.
KwaZulu-Natal
KwaZulu-Natal, anchored by Durban and Pietermaritzburg, combines a substantial metropolitan market with extensive agricultural and industrial districts. Durban's port makes the province a significant node for vehicle logistics and for export flows toward neighbouring Southern African markets. Bakkie and utility vehicle demand runs above the national average, supported by agriculture and the transport sector.
Eastern Cape & Inland Provinces
The Eastern Cape hosts major vehicle assembly operations and combines industrial employment with substantial rural demand. Together with the Free State, Limpopo, Mpumalanga, North West and Northern Cape, the inland and eastern provinces account for a substantial share of national volume while contributing proportionally less value. The regional mix skews toward bakkies, older vehicles and the lower price bands, and private-party transactions are proportionally more significant than in the metropolitan provinces.
How Competition Is Evolving
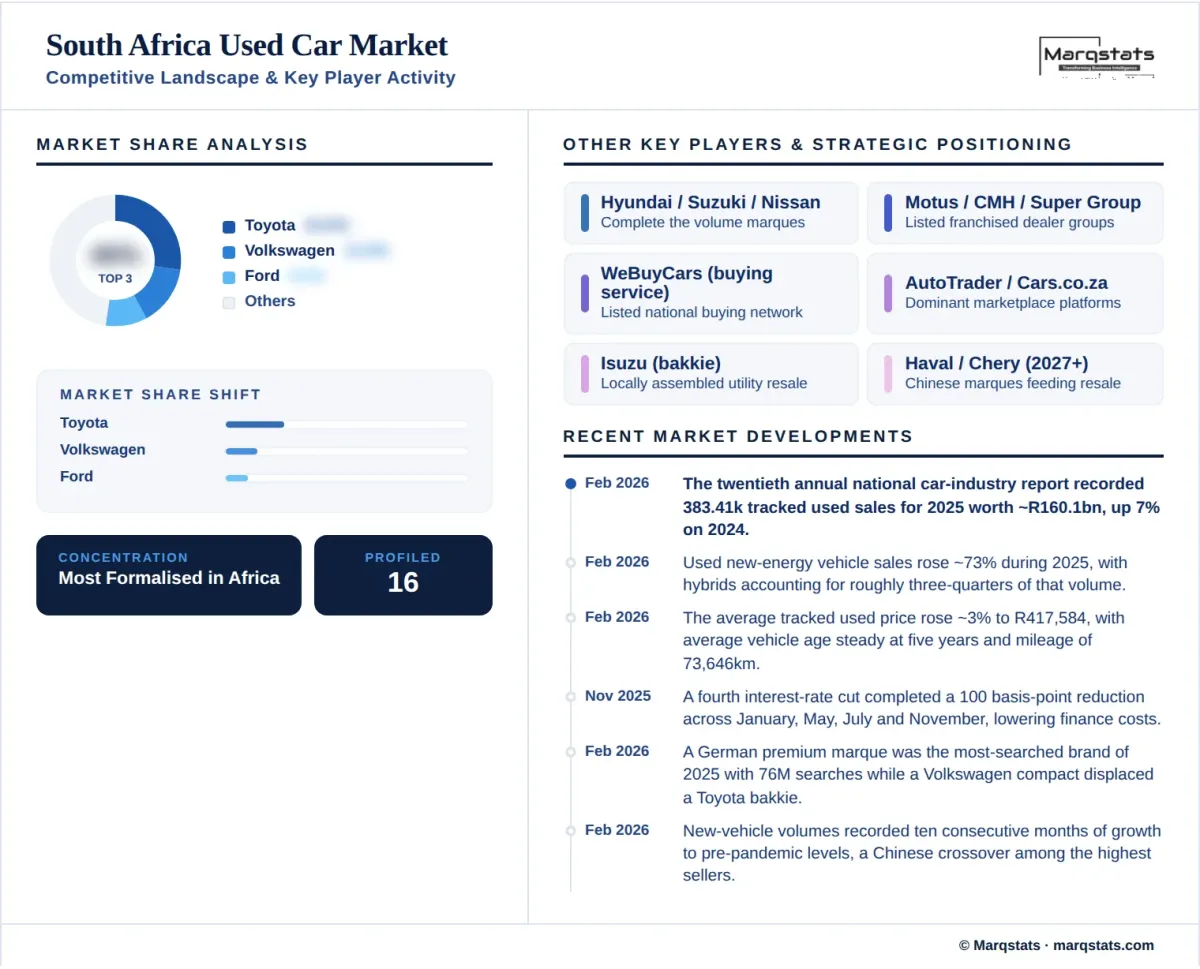
The South Africa used car market is fragmented, with independent dealers and professional retailers holding about 42% of volume, private sellers about 40% and franchised networks about 18%. No operator holds more than a low single-digit share of transactions. The market is nonetheless the most formalised in Africa, with certified transactions at about 24% and online channels at about 62%, and consolidation is advancing among listed dealer groups and vehicle buying services with national footprints.
Brand structure is dominated by established local nameplates. Toyota holds about 24% of used transactions, supported by decades of leadership in both bakkie and passenger segments and by local assembly. Volkswagen follows at about 13%, Ford at about 9%, Hyundai at about 7%, and Suzuki and Nissan at about 6% each. The three highest-volume used models in the tracked channel during 2025 were a bakkie, a compact hatchback and a second bakkie, which captures the market's structure precisely.
Search behaviour and transaction volume have diverged in an instructive way. A German premium marque was the most-searched brand in the tracked channel during 2025 with 76 million searches, and a Volkswagen compact displaced a Toyota bakkie as the most-searched model, yet the same established nameplates continued to lead actual sales. That gap between aspiration and transaction is a durable feature of this market and a useful signal for inventory planning.
Chinese marques represent the most significant forward shift. Their expansion in new-vehicle sales has been rapid enough to reshape the national sales ranking, with one Chinese crossover ranking among the highest-volume new models entering 2026. Because resale composition lags new registrations by three to five years, that entry will begin materially altering used-market brand share from around 2027, and operators sourcing and pricing those vehicles will face limited residual history to work from.
Companies Covered
The report profiles 16+ companies with full strategy and financials analysis, including:
Recent Market Activity
Table of Contents
Coverage & Segmentation
This report provides a comprehensive assessment of the South Africa used car market across a 2025 base year, historical data from 2021 to 2025, and forecasts spanning 2026 to 2030. Market sizing is presented in unit-volume terms and complemented by value analysis in United States dollars converted from a South African rand base. Segmentation covers ten dimensions. The transaction layer counted is the total used passenger vehicle transaction including private-party sales, which is materially wider than the platform-tracked dealer series of 383.41 thousand units.
The scope covers demand drivers, restraints and structural trends, with particular focus on the bakkie segment and its effect on propulsion and residual structure, interest rate transmission into vehicle finance, the divergence between search behaviour and transaction volume, electrified resale running through hybrids, and the forward effect of Chinese marque entry. Comparative benchmarking against the region's largest market by volume is available in the Saudi Arabia used car market report. An extended forecast to 2035 is available under customization, alongside provincial breakouts on request.