Market Snapshot
Key Takeaways
Market Overview & Analysis
Report Summary
The Netherlands used car market comprises business-to-consumer and consumer-to-consumer used passenger-car ownership changes recorded across the Netherlands in a calendar year, transacted through manufacturer-franchised networks, independent motor trade businesses, digital platforms, and direct private-party channels. This study segments demand by vehicle type, propulsion type, seller type, sales channel, vehicle age, vehicle mileage, price band, certification status, vehicle positioning, and brand, with a 2025 base year, historical coverage from 2021 to 2025, and forecasts to 2030. Sizing is presented in unit-volume terms and complemented by value analysis in United States dollars.
The transaction definition used here is broader than some international ownership-transfer extracts. It captures both business-to-consumer sales through the motor trade and consumer-to-consumer sales between private parties, which together match the dealer-and-private-seller scope applied across this series. Readers comparing against narrower registry-transfer definitions should expect a higher figure. The 2022 value is estimated between verified years, while 2021 and 2023 to 2025 are taken directly from sector reporting.
The structural driver is new-car affordability. New passenger-car registrations reached only 388 thousand units in 2025, and rising new-vehicle prices combined with higher financing costs have pushed private buyers toward young used stock, either imported or purchased through the motor trade. The consequence is a used market more than five times the size of the new market, and a professional channel that has taken record volume as dealers rebalance their businesses toward used inventory. Imports of young used vehicles set a record in the same year, supplementing a domestic supply base that a small new-car market cannot fill on its own.
Electrification in the secondary market is further advanced here than anywhere else covered, and it arrives with its own frictions. Corporate leasing and benefit-in-kind taxation drove early electric adoption in company fleets, and those vehicles are now reaching resale age in volume. Used electric transactions grew 43.7% year on year to January 2026. Three constraints temper the trend: weight-based road taxation bears heavily on electric vehicles, residual values remain uncertain, and insurance premiums run above combustion equivalents. A purchase subsidy for used electric vehicles ended at the start of 2025, removing direct support at the point the supply wave began.
Market Dynamics
Key Drivers
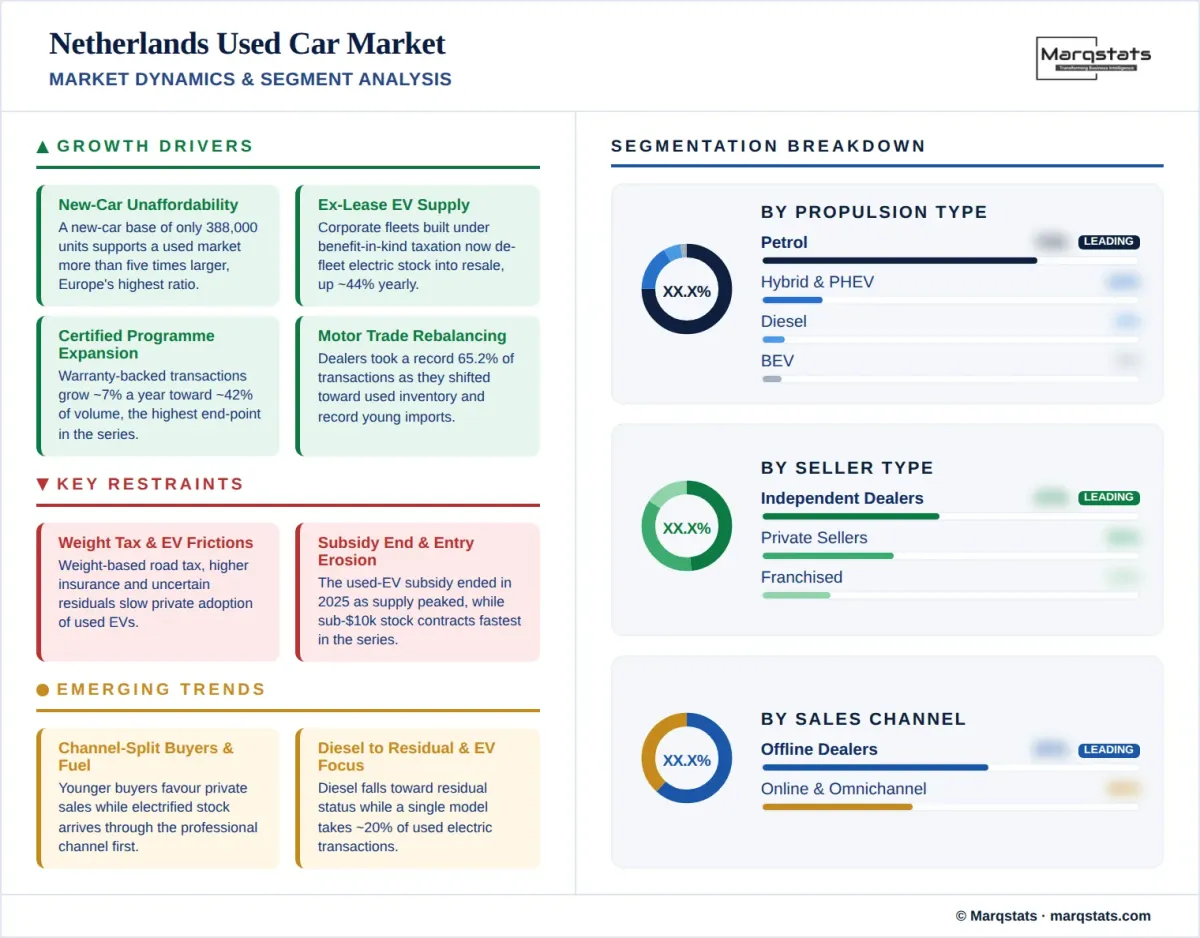
- New-car unaffordability redirects demand, as a new-car base of only 388 thousand units supports a used market more than five times larger.
- Ex-lease electric supply reaches resale age, as corporate fleets built under benefit-in-kind taxation now de-fleet into the secondary market.
- Certified programme expansion grows at a 6.95% CAGR, lifting warranty-backed share from about 32% of volume to about 42% by 2030, the highest end-point covered.
- Motor trade businesses take record volume at 65.2% of transactions, as dealers rebalance toward used inventory against weaker new-car sales.
- Young used imports set a record in 2025, supplementing a domestic supply base that a small new-car market cannot fill alone.
Key Restraints
- Weight-based road taxation bears heavily on electric vehicles, raising the running cost of used electric stock relative to combustion equivalents.
- The used electric purchase subsidy ended at the start of 2025, removing direct support at the point the ex-lease supply wave began.
- Entry-price inventory is contracting fastest in this series, as transactions below USD 10,000 decline at a negative 8.83% CAGR.
- Residual value uncertainty and elevated insurance premiums on used electric vehicles continue to slow private-buyer adoption.
Key Trends
- Buyer age splits sharply by channel, as 38.9% of private-to-private purchases are made by 18-to-35-year-olds against 27.8% through the motor trade.
- Electrified stock concentrates in the professional channel, where hybrids and full electric vehicles account for 26% of sales against 11% between private parties.
- Used electric demand concentrates in a narrow model set, with a single model taking roughly a fifth of used electric transactions.
- Diesel is approaching residual status at 5.5% of transactions and contracting at a negative 10.71% CAGR, the steepest decline of any segment in this series.
Market Segmentation
Hatchbacks account for about 40% of 2025 volume, easing to about 37% by 2030 while holding broadly flat in unit terms. The concentration reflects a Dutch parc weighted toward compact and city segments, suited to short journeys, dense urban settlement, and a taxation system that penalises weight and emissions. The most-traded used models in the country are consistently superminis and lower-medium hatchbacks. Sedans hold about 13% of volume and contract at 1.84% annually to about 12% by 2030, the sharpest body-style decline in the market.
SUV and crossover models hold about 28% of 2025 volume and grow at a 5.78% CAGR, the strongest of any body style, reaching about 33% by 2030. MPV and minivan models retain about 10% of transactions, a comparatively high share sustained by family and shared-use demand. Pickup trucks remain marginal at about 3% of volume while growing at 5.15% annually, constrained by a taxation regime that treats passenger-configured pickups unfavourably.
Petrol accounts for about 73% of 2025 volume and declines at a 4.20% CAGR to about 55% by 2030, a faster erosion than in any other market covered because electrified alternatives are displacing it rather than diesel. Diesel holds just 5.5% of transactions, the lowest share in this series and roughly a tenth of the Spanish equivalent, contracting at a negative 10.71% CAGR to about 3% by 2030. Dutch vehicle taxation has weighted against diesel for decades through registration and road tax structures, and the segment is approaching residual status in the secondary market.
Battery-electric transactions grow from roughly 102 thousand units in 2025 to roughly 319 thousand units by 2030, a 22.25% CAGR, lifting share from about 4.8% to about 14%, the highest electric penetration in this series at both ends of the forecast. Monthly data shows the trend accelerating ahead of the annual model, reaching 6.5% of transactions by January 2026 on 43.7% year-on-year growth. Hybrids hold about 13% of volume and grow at 12.02% annually to about 22% by 2030, while plug-in hybrids grow at 11.72% to about 5%. Combined electrified share reaches about 41% by 2030, more than any other market covered.
Independent dealers and professional retailers hold about 47% of 2025 volume, the largest single seller channel, growing at a 3.49% CAGR to about 52% by 2030. Franchised networks hold about 18% and grow at 4.58% annually to about 21%. Together the motor trade handled 65.2% of transactions in 2025, a record for the Dutch sector and the highest professional share of any market in this series. Certified and warranty-backed transactions grow at 6.95% annually from about 32% of the total to about 42% by 2030, again the highest end-point covered.
Private sellers handle about 35% of 2025 transactions and contract at a negative 3.84% CAGR to about 27% by 2030. The channel skews young, as 38.9% of private-to-private purchases are made by buyers aged 18 to 35 against 27.8% through the motor trade, while buyers aged 56 and over favour dealers. Fuel mix differs sharply by channel too, with hybrids and full electric vehicles representing 26% of professional sales against 11% of private-party transactions, which means electrification is arriving through the formal channel first.
Online and omnichannel transactions hold about 40% of 2025 volume, the highest digital share of any market in this series, and grow at a 9.63% CAGR to about 60% by 2030. The Netherlands combines mature e-commerce behaviour, a dense and compact geography that makes delivery economics favourable, and marketplace platforms that have extended from listing into complete transaction handling. Online-only retailers operating a buy-online-with-delivery model have established a durable presence alongside the traditional trade.
Offline transactions hold about 60% of 2025 volume and decline at a negative 6.73% CAGR to about 40% by 2030. Physical sites retain their role in trade-in appraisal, inspection, warranty servicing, and financing attachment, and the compact national geography means most buyers remain within short reach of a professional site. Consolidation continues among the larger dealer groups, and independent operators without digital reach are the most exposed as the channel contracts.
Vehicles up to three years old account for about 19% of 2025 volume and grow at a 4.42% CAGR to about 22% by 2030, while the four-to-six-year cohort holds about 24% and grows at 3.84% to about 27%. Together these cohorts represent about 43% of transactions in 2025, the highest near-new concentration of any market in this series. Supply comes from two sources: corporate lease returns, which are unusually significant given the scale of Dutch business leasing, and record imports of young used vehicles that supplement a domestic base constrained by a small new-car market.
Vehicles aged seven to ten years hold about 22% of volume and grow at 2.35% annually. Vehicles older than ten years account for about 35% of 2025 transactions, the lowest older-vehicle concentration in this series, and contract at a negative 3.07% CAGR to about 28% by 2030. The comparatively young traded fleet is the principal reason average transaction price sits well above the Southern European markets despite a similar market scale, and it reflects both taxation that discourages retention of older vehicles and an active export channel for aged stock.
Transactions above USD 30,000 grow at a 6.83% CAGR from about 23% of 2025 volume to about 30% by 2030, reaching USD 18.39 billion and roughly half of total market value. The USD 20,001 to USD 30,000 band grows at 3.94% annually from about 23% to about 26%. Together the upper bands represent about 46% of transactions in 2025 rising to about 56% by 2030, a far higher premium concentration than in the Southern European markets and a direct consequence of the young traded fleet.
Transactions below USD 10,000 account for about 20% of 2025 volume and fall to about 12% by 2030 at a negative 8.83% CAGR, the steepest entry-tier contraction of any market in this series. The USD 10,001 to USD 20,000 band holds about 34% of transactions and remains broadly flat in unit terms while easing to about 32% of share. The rapid erosion of the affordable tier is the market's principal accessibility constraint, and it is accelerated by export demand for older vehicles and by taxation that raises the running cost of retaining them.
By Geography
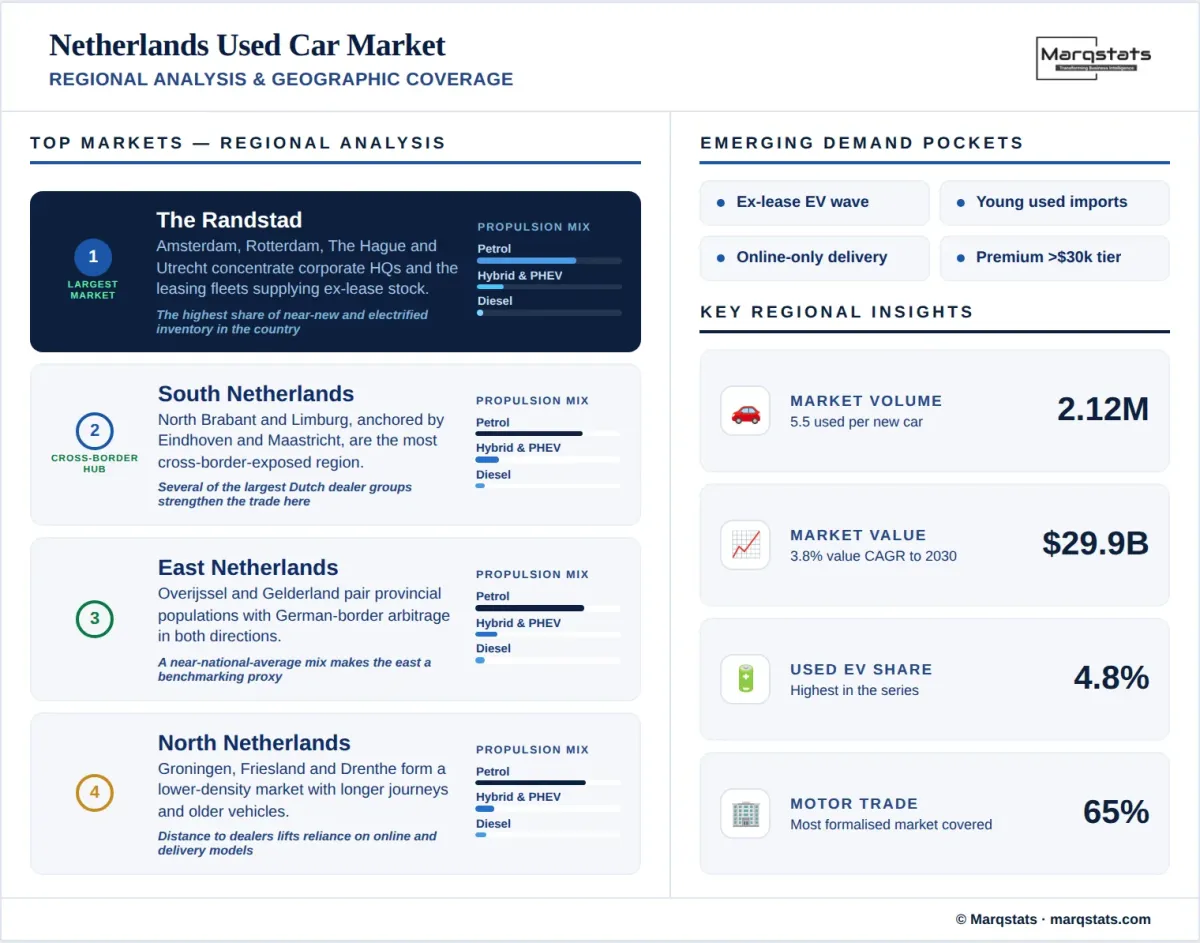
The Randstad
North Holland, South Holland, Utrecht, and Flevoland form the largest regional market by both volume and value, containing Amsterdam, Rotterdam, The Hague, and Utrecht. The region concentrates corporate headquarters and the leasing fleets that supply most ex-lease inventory, giving it the highest share of near-new and electrified stock in the country. Urban environmental zones and dense public transport reduce private car ownership per household relative to the rest of the Netherlands, which shifts demand toward younger financed vehicles bought through the professional channel.
North Netherlands
Groningen, Friesland, and Drenthe form a smaller market shaped by lower population density and longer average journeys. Private car ownership per household runs above the national average, and the regional mix carries a higher share of older vehicles and of private-party transactions than the Randstad. Distances to professional retail sites are greater than elsewhere in the country, which supports above-average reliance on online channels and on delivery-based purchase models.
East Netherlands
Overijssel and Gelderland combine substantial provincial populations with proximity to the German border. Cross-border trade influences both supply and pricing in the eastern municipalities, as price and taxation differentials between the two markets create arbitrage in both directions depending on vehicle age and propulsion. The regional mix sits close to the national average across body type and channel, making the east a reasonable proxy for national benchmarking.
South Netherlands
North Brabant, Limburg, and Zeeland account for a substantial share of national volume, anchored by Eindhoven, Tilburg, and Maastricht. Proximity to Belgium and Germany makes this the most cross-border-exposed region in the country, and Limburg in particular sees significant movement of used vehicles across both frontiers. The region also hosts several of the largest Dutch dealer groups, giving the professional channel a stronger position here than the national average.
How Competition Is Evolving
The Netherlands used car market is the most formalised of any market in this series. Motor trade businesses handled 65.2% of 2025 transactions, a record for the sector, while private-party sales accounted for the remaining 34.8%. Certified and warranty-backed transactions represent about 32% of the market, and online channels about 40%, both the highest shares covered. No single operator controls more than a low single-digit share of transactions, however consolidation among the larger dealer groups has advanced further here than in most European markets, and scale in reconditioning and financing increasingly separates the leaders from the independent tail.
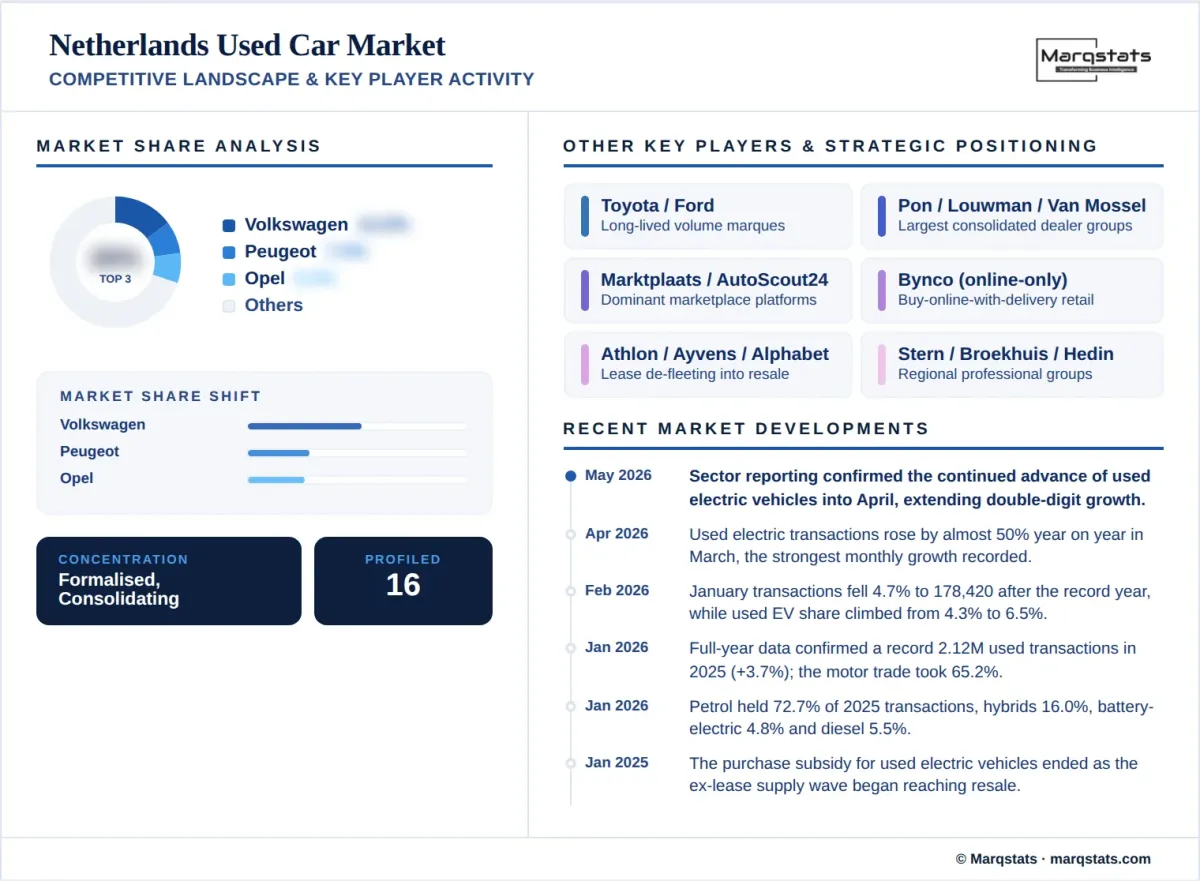
At brand level the market reflects a parc built over decades on compact German and French volume models. Volkswagen leads with roughly 13% of transactions, and the gap to the next marque is substantial. Peugeot follows at roughly 7%, then Opel at roughly 6.5%, Toyota at roughly 6% and Ford at roughly 6%. Volkswagen supplies the two most-traded models in the country, both superminis or lower-medium hatchbacks, and the marque accounts for well over a million vehicles in the national parc. Brand share in resale therefore reflects accumulated registrations rather than current market performance.
The used electric segment has a competitive structure of its own and it is unusually concentrated. A single model accounts for roughly a fifth of used electric transactions, with the next several models trailing at a fraction of that volume. This concentration reflects the composition of the corporate lease fleets built during the early adoption phase, and it means used electric pricing in the Netherlands is unusually sensitive to the residual performance of one nameplate. As the ex-lease wave broadens across more model families, that concentration will ease and pricing should stabilise.
Competition centres on inventory sourcing and on electrified remarketing capability. With a small new-car market and a large used market, professional operators compete for a supply base that domestic trade-ins alone cannot fill, which has made import sourcing a core competence rather than an occasional tactic. Leasing companies form a second competitive layer, as their de-fleeting decisions determine the volume, timing, and mix of near-new and electrified stock entering the channel. Battery condition assessment, warranty structuring, and financing attachment determine profit per unit in the electrified segment far more than vehicle margin alone.
Companies Covered
The report profiles 16+ companies with full strategy and financials analysis, including:
Recent Market Activity
Table of Contents
Coverage & Segmentation
This report provides a comprehensive assessment of the Netherlands used car market across a 2025 base year, historical data from 2021 to 2025, and forecasts spanning 2026 to 2030. Market sizing is presented in unit-volume terms and complemented by value analysis in United States dollars, with segmentation by vehicle type, propulsion type, seller type, sales channel, vehicle age, vehicle mileage, price band, certification status, vehicle positioning, and brand. The transaction layer counted is the business-to-consumer plus consumer-to-consumer used passenger-car ownership change, which is broader than narrower registry-transfer definitions and consistent with the dealer-and-private-seller scope applied across this series.
The scope covers demand drivers, restraints, and structural trends, with particular focus on the highest used-to-new ratio in Europe, the lowest diesel share of any market covered, the ex-lease electrified supply wave and the taxation and residual frictions constraining it, record young used imports, and the exceptional degree of channel formalisation. Comparative benchmarking is drawn from adjacent Marqstats coverage, including the Germany used car market, the neighbouring market with which the Netherlands shares its largest cross-border trade flows.
Further comparison is available against the Spain used car market, which sits at the opposite end of the European fleet-age and diesel-share spectrum. An extended forecast to 2035 is available under customization for subscribers requiring a longer planning horizon, alongside deeper cuts by province, brand, or channel on request.