Market Snapshot
Key Takeaways
Market Overview & Analysis
Report Summary
The United Kingdom used car market comprises all used passenger-car transactions recorded across Great Britain and Northern Ireland in a calendar year, sold through manufacturer-franchised networks, independent dealers and professional retailers, digital-first operators, and direct private-party channels. This study segments demand by vehicle type, propulsion type, seller type, sales channel, vehicle age, vehicle mileage, price band, certification status, vehicle positioning, and brand, with a 2025 base year, historical coverage from 2021 to 2025, and forecasts to 2030. Sizing is presented in unit-volume terms and complemented by value analysis in United States dollars.
The United Kingdom differs from continental European markets in one structural respect that governs supply. The zero-emission vehicle mandate imposes annual quotas on manufacturers for the share of new registrations that must be zero-emission, and manufacturers meet those quotas partly through tactical self-registration. Roughly 100 thousand new cars were registered in the final four days of September 2025 alone, and vehicles registered in this way enter the used market as nearly-new stock within months rather than after a normal three-year first-ownership cycle. The mandate therefore functions as a supply pump into the secondary market, compressing the usual lag between new registration and resale.
That mechanism is visible in the electrified data. Used battery-electric transactions rose 45.7% to a record 274.82 thousand units across 2025 and grew a further 32.0% year on year in the first quarter of 2026 to 86.94 thousand units, lifting share to 4.3%. Hybrid transactions rose 27.6% over the same quarter. Plug-in hybrids diverge from this pattern, falling 8.9% in the first quarter of 2026, which reflects the shrinking corporate-fleet cohort that drove plug-in hybrid registration between 2020 and 2022.
Conventional propulsion nonetheless still governs the market. Petrol and diesel together accounted for roughly 88% of first-quarter 2026 transactions, and petrol remains the single largest fuel type at close to 57% of 2025 volume. Diesel is the fastest-contracting segment in the market at a negative 8.81% CAGR, a decline driven by reduced supply from the new-car market a decade earlier rather than by weakening resale demand, and compounded by clean air zone enforcement across major English cities.
Market Dynamics
Key Drivers
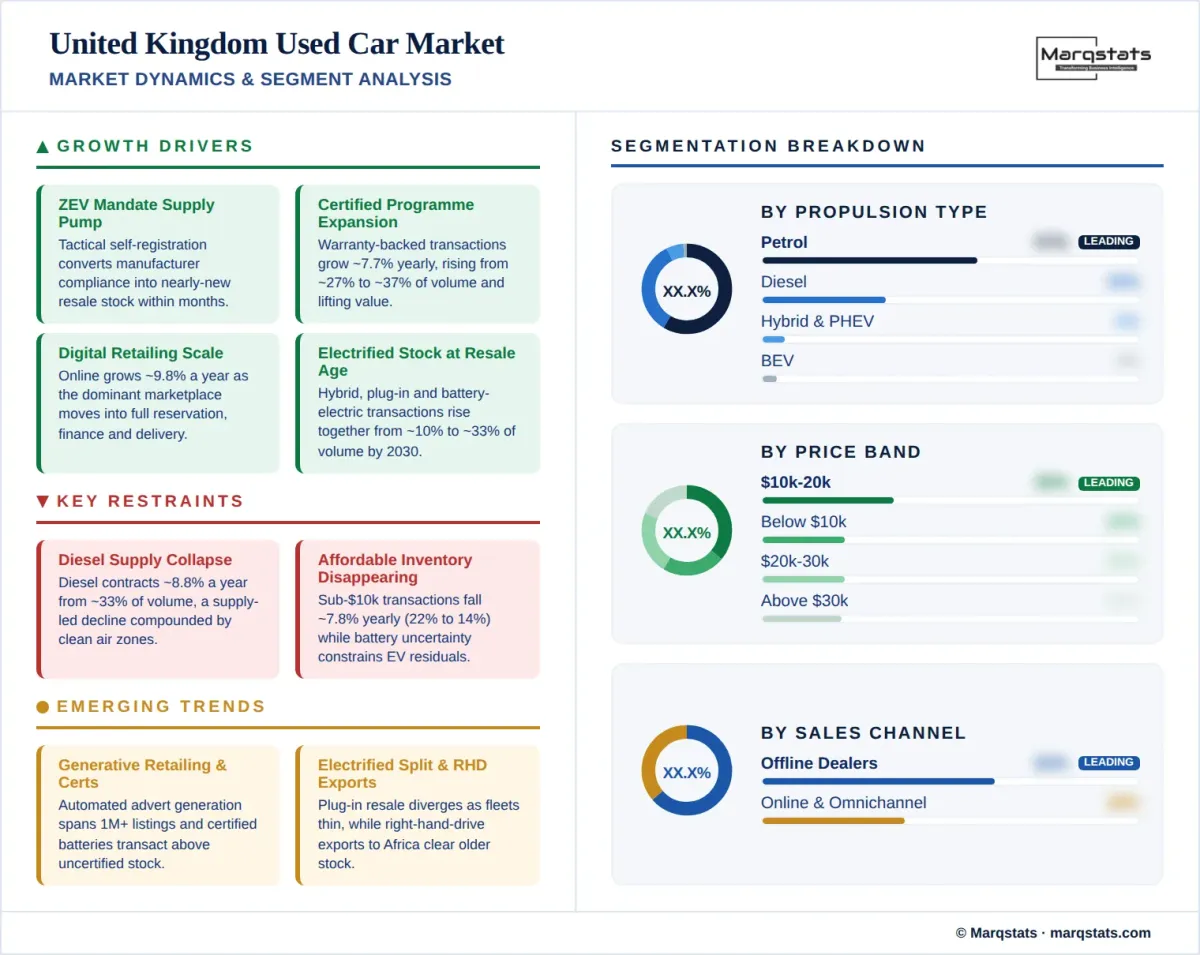
- The zero-emission vehicle mandate pumps nearly-new supply into the used market, as tactical self-registration converts manufacturer compliance activity into resale stock within months.
- Certified programme expansion lifts value per transaction, as warranty-backed transfers grow at a 7.69% CAGR and raise share from about 27% of volume to about 37% by 2030.
- Digital retailing scales at a 9.84% CAGR, as the dominant marketplace operators move from classified advertising into complete transaction journeys with reservation, financing, and delivery.
- Electrified stock reaches resale age in volume, as hybrid, plug-in hybrid, and battery-electric transactions together rise from about 10% of volume to about 33% by 2030.
- Professional channels capture private-seller share, as franchised networks grow at 3.81% annually and independent retailers at 3.51% while private transactions contract.
Key Restraints
- Diesel supply is contracting sharply at a negative 8.81% CAGR, removing a fuel type that still represented about a third of 2025 transactions.
- Affordable inventory is disappearing, as transactions below USD 10,000 decline at a negative 7.78% CAGR and fall from about 22% of volume to about 14% by 2030.
- Aggregate volume growth is limited to a 1.32% CAGR, so channel and segment gains represent share transfer rather than market expansion.
- Battery valuation uncertainty constrains electric residuals, as replacement costs sit far above the value of an older electric car and independent state-of-health documentation remains uneven across the trade.
Key Trends
- Generative retailing tools are reshaping listing quality, as marketplace operators deploy automated advert generation across more than a million listings.
- Independent battery certification delivers measurable price uplift, with certified electric vehicles transacting several hundred pounds above uncertified equivalents.
- Plug-in hybrid resale diverges from the wider electrified trend, falling 8.9% year on year in the first quarter of 2026 as the corporate-fleet cohort that supplied it thins.
- Right-hand-drive export demand from East and West African markets provides a disposal route for older stock that continental European sellers lack.
Market Segmentation
Hatchbacks account for about 48% of 2025 volume, the highest concentration of any major European market, and hold roughly flat in unit terms while easing to about 45% of share by 2030. Superminis alone represent close to a third of all transactions. The weighting reflects decades of British new-car buying concentrated in small and lower-medium models, and it is the principal reason average transaction price sits below comparable continental markets. Sedans account for about 12% of volume and contract at 1.97% annually to about 11% by 2030, as the body style continues to lose relevance outside the premium executive segment.
SUV and crossover models hold about 25% of 2025 volume and grow at a 5.84% CAGR, the strongest of any body style, reaching about 30% by 2030. The segment reflects the composition of new registrations across the past decade, now flowing through into resale. Pickup trucks remain small at under 3% of volume, however they grow at 5.02% annually, supported by trade demand and by the tax treatment of double-cab models. MPV and minivan transactions hold about 6% and contract slowly.
Petrol holds about 57% of 2025 volume and declines at 2.91% annually to about 46% by 2030, remaining the largest fuel type throughout the forecast period. Diesel contracts far faster, falling from about 33% of volume to about 20% at a negative 8.81% CAGR, the sharpest decline of any segment in the market. The contraction is supply-led rather than demand-led, as diesel's collapse in new-car registrations from the late 2010s now works through the resale cycle, and it is compounded by clean air zone enforcement across major English cities.
Battery-electric transactions grow from roughly 273 thousand units in 2025 to roughly 988 thousand units by 2030, a 24.88% CAGR, lifting share from about 4% to about 12%. Hybrids grow at 23.03% annually to about 16% of volume by 2030, overtaking battery-electric vehicles in share and becoming the largest electrified segment. Plug-in hybrids grow at 29.40% from a small base, though recent quarterly data shows the segment contracting as the corporate-fleet cohort that supplied it thins. Together, electrified powertrains rise from about 10% of transactions to about 33% by 2030.
Independent dealers and professional retailers form the largest seller channel at about 44% of 2025 volume, growing at a 3.51% CAGR to about 49% by 2030. The channel spans traditional forecourt operators, volume supermarket retailers, and digital-first businesses that acquire inventory directly from consumers. Franchised networks hold about 23% of volume and grow fastest among seller types at 3.81% annually, reaching about 26% by 2030 on manufacturer certified programmes. Certified and warranty-backed transactions across both channels grow at 7.69% annually, rising from about 27% of the total market to about 37%.
Private-seller transactions fall from about 33% of volume in 2025 to about 25% by 2030 at a negative 4.29% CAGR, the sharpest contraction of any seller type and steeper than the equivalent decline in continental markets. Instant-valuation and direct-purchase services have industrialised the conversion of private inventory into professional stock, and consumer preference for warranty coverage, documented provenance, and regulated finance continues to favour dealer channels.
Online and omnichannel transactions hold about 38% of 2025 volume and grow at a 9.84% CAGR, reaching parity with offline retail in 2028 and taking about 58% of transactions by 2030. The United Kingdom leads Europe in digital retailing maturity, as the dominant marketplace has moved beyond classified advertising into complete transaction journeys covering part-exchange valuation, finance approval, reservation, and home delivery. Generative tools now assist advert creation across more than a million listings, raising listing quality across the retailer base.
Offline transactions decline from about 62% of volume to about 42% by 2030 at a negative 6.53% CAGR, a loss of twenty percentage points of share. Physical sites retain relevance for older and lower-value stock, for part-exchange handling, and for the service and finance attachment that follows the sale. Consolidation continues among franchised groups and volume retailers, and independent operators without a capable digital presence remain the most exposed.
Vehicles up to three years old account for about 18% of 2025 volume and grow at a 4.45% CAGR to about 21% by 2030, while the four-to-six-year cohort holds about 24% and grows at 3.71% to about 27%. The near-new cohort is unusually well supplied in the United Kingdom relative to continental markets, as tactical registration activity under the zero-emission vehicle mandate feeds nearly-new stock into the channel far faster than a conventional ownership cycle would allow.
Vehicles aged seven to ten years hold about 25% of volume and grow at 2.12% annually. Vehicles older than ten years account for about 33% of 2025 volume, the largest single age cohort, however this cohort contracts at 3.50% annually to about 26% by 2030. Right-hand-drive export demand from East and West African markets provides a disposal route for this stock that continental sellers lack, and it removes older units from domestic circulation at a faster rate than scrappage alone would achieve.
Transactions below USD 10,000 fall from about 22% of 2025 volume to about 14% by 2030 at a negative 7.78% CAGR, the sharpest contraction of any price band and the market's central affordability constraint. The USD 10,001 to USD 20,000 band remains the volume core at about 35% of transactions and holds roughly flat in unit terms while easing to about 33% of share. Together these bands still represent close to half of transactions at the end of the forecast period, though their combined share falls by ten percentage points.
The USD 20,001 to USD 30,000 band grows at 3.91% annually from about 22% of volume to about 25%, absorbing buyers displaced upward from the contracting entry tier. Transactions above USD 30,000 grow fastest at 7.14% annually, rising from about 21% of volume to about 28% and reaching USD 63.97 billion by 2030. This band accounts for roughly half of total market value at the end of the forecast period and drives the divergence between volume and value growth.
By Geography
London & South East England
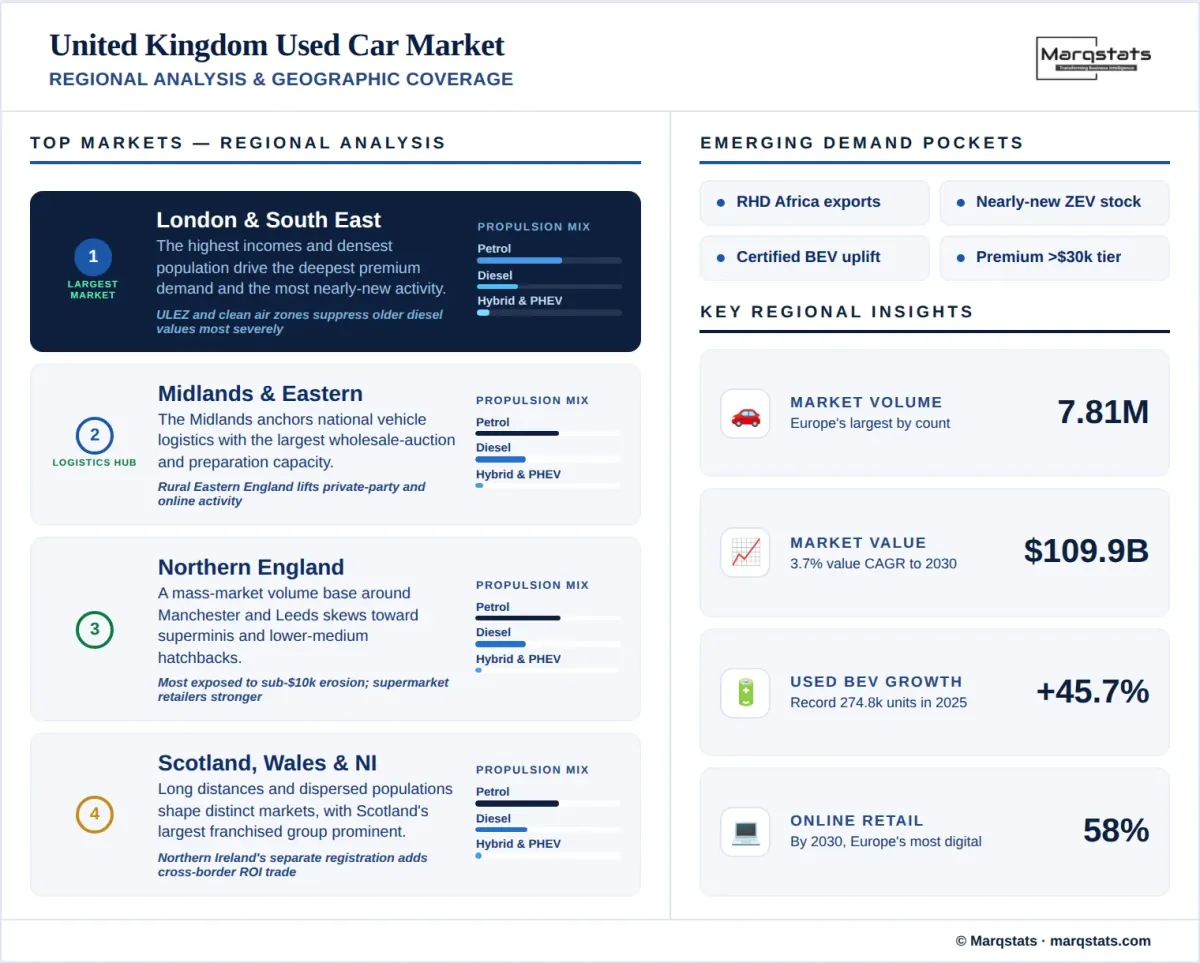
London and the South East form the largest regional market, combining the highest household incomes in the country with the densest population and the deepest premium and luxury demand. The Ultra Low Emission Zone and the wider clean air zone framework suppress resale values for older diesel stock across the capital more severely than anywhere else in the country, accelerating the region's propulsion mix shift. London also records the lowest private car ownership per household, which shifts a greater proportion of demand toward nearly-new and financed transactions through professional channels.
The Midlands & Eastern England
The Midlands anchors the national vehicle logistics network, hosting the largest concentration of wholesale auction capacity and vehicle preparation facilities in the country. The region combines substantial manufacturing employment with a mass-market weighted demand profile, and Birmingham operates a clean air zone that shapes local diesel residuals. Eastern England adds a dispersed rural demand base with above-average reliance on private-party transactions and longer travel distances to franchised sites, which supports digital channel penetration.
Northern England
Northern England spans the North West, Yorkshire and the Humber, and the North East, and forms a substantial mass-market volume base centred on the Manchester and Leeds conurbations. The regional mix skews toward superminis and lower-medium hatchbacks and toward the contracting sub-USD 10,000 price band, which makes the region the most exposed to the erosion of affordable inventory. Volume supermarket retailers hold a stronger position here than in the South, and clean air zone enforcement in Bradford, Sheffield, and Newcastle influences local diesel values.
Scotland, Wales & Northern Ireland
Scotland sustains a distinct market shaped by long travel distances, a dispersed population outside the Central Belt, and the presence of the country's largest privately held franchised retail group. Wales carries a mass-market weighted mix with strong private-party activity across rural counties. Northern Ireland operates on a separate registration system and maintains cross-border trade with the Republic of Ireland, which introduces currency and duty considerations absent from the rest of the market and gives the region pricing dynamics of its own.
How Competition Is Evolving
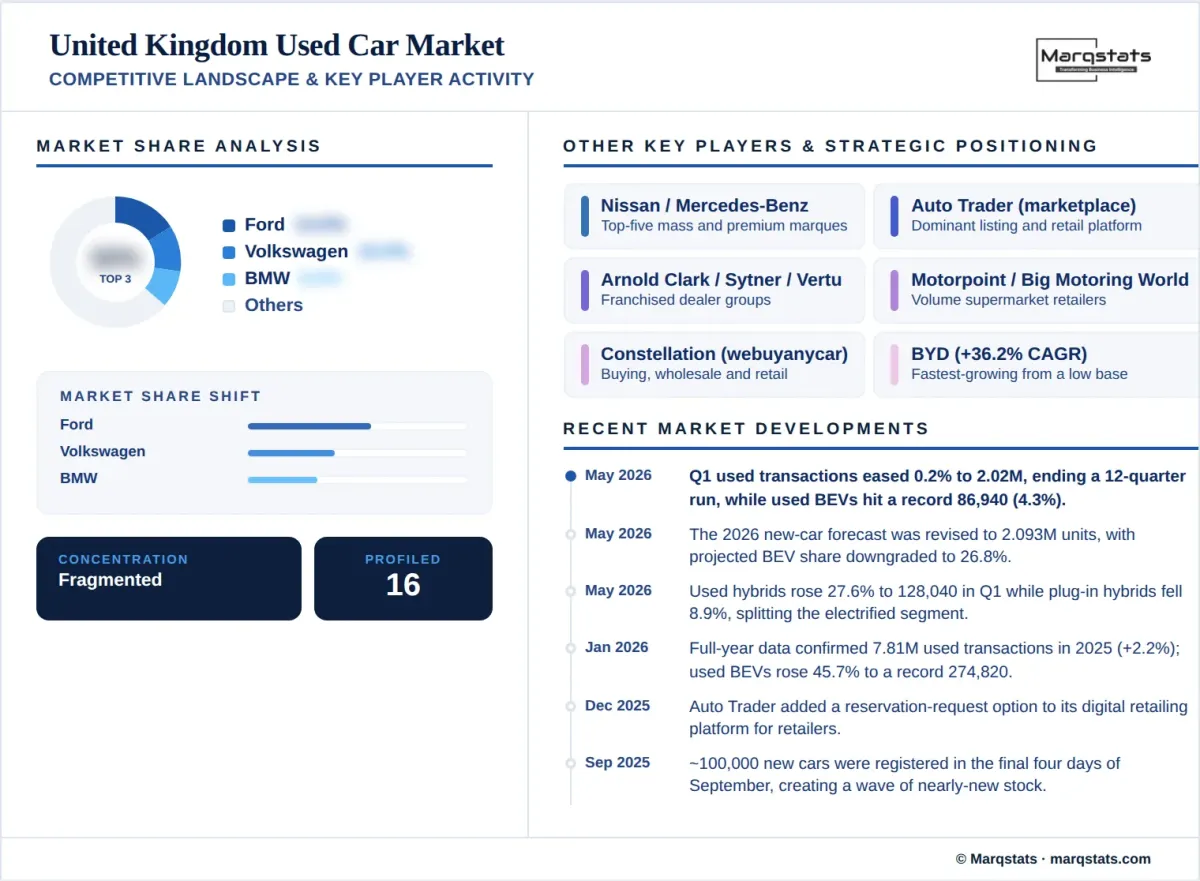
The United Kingdom used car market is fragmented, and no retailer controls more than a low single-digit share of annual transactions. About a third of 2025 volume moved directly between private parties, and the remaining professional volume is distributed across franchised dealer groups, volume supermarket retailers, digital-first operators, and several thousand independent forecourts. Consolidation continues at the margin, as franchised groups acquire scale and digital operators absorb private-seller supply, though the market remains structurally more fragmented than the retail sectors of comparable size.
At brand level the market mirrors British new-car buying of the preceding decade. Ford leads with roughly 14% of transactions, ahead of Volkswagen and BMW, and the top three marques together account for roughly a third of volume. Nissan and Mercedes-Benz complete the top five. Brand share in the secondary market therefore lags new-registration share by five to eight years, which explains why Chinese marques remain marginal in resale despite rapid gains in new registrations. BYD grows fastest at a 36.16% CAGR from a very low base, reaching a low single-digit share by 2030.
The defining competitive feature is the strength of the dominant marketplace. Unlike continental markets, where listing traffic is split across competing platforms, the United Kingdom concentrates buyer attention on a single classified operator that has extended into digital retailing. Its reservation and finance products now reach several thousand live retailers, and generative listing tools have been applied to more than a million adverts. This gives the platform unusual leverage over retailer economics and makes marketplace fees a material cost line rather than a discretionary marketing spend.
Below the marketplace layer, competition centres on inventory acquisition and transaction monetisation. Vertically integrated groups that combine consumer buying services, wholesale auction capacity, and retail networks control the flow of stock from private owner to retail buyer, and capture margin at each stage. Franchised networks defend the near-new segment with manufacturer-backed certified programmes and captive finance, while volume retailers compete on price transparency and preparation throughput. Financing attachment, warranty products, and preparation efficiency determine profit per unit far more than vehicle margin alone.
Companies Covered
The report profiles 16+ companies with full strategy and financials analysis, including:
Recent Market Activity
Table of Contents
Coverage & Segmentation
This report provides a comprehensive assessment of the United Kingdom used car market across a 2025 base year, historical data from 2021 to 2025, and forecasts spanning 2026 to 2030. Market sizing is presented in unit-volume terms and complemented by value analysis in United States dollars, with segmentation by vehicle type, propulsion type, seller type, sales channel, vehicle age, vehicle mileage, price band, certification status, vehicle positioning, and brand. The transaction layer counted is the used passenger-car transaction as reported in national quarterly transaction statistics, covering Great Britain and Northern Ireland and excluding commercial-vehicle and motorcycle transactions.
The scope covers demand drivers, restraints, and structural trends, with particular focus on the zero-emission vehicle mandate and its effect on nearly-new supply through tactical registration, the contraction of diesel supply, clean air zone enforcement across English cities, the divergence between battery-electric and plug-in hybrid resale, the erosion of sub-USD 10,000 inventory, and right-hand-drive export flows to African markets. An extended forecast to 2035 is available under customization for subscribers requiring a longer planning horizon, alongside deeper cuts by region, brand, or channel on request.
Comparative benchmarking is drawn from adjacent Marqstats coverage, including the Germany used car market, which permits comparison of certified penetration, online channel share, and average transaction price against Europe's second-largest used-vehicle market operating under a different regulatory framework.