Market Snapshot
Key Takeaways
Market Overview & Analysis
Report Summary
The Latin America used car market comprises used passenger vehicle transactions recorded across Mexico, Brazil, Argentina, Colombia, Chile, Peru and the remaining regional markets in a calendar year, transacted through manufacturer-authorised networks, independent dealers and resale lots, digital platforms, and direct private-party channels. This study models six national markets individually and aggregates the remainder, with a 2025 base year, historical coverage from 2021 to 2025, and forecasts to 2030. Segmentation covers ten dimensions.
Brazilian figures require particular care, because three different totals circulate and each answers a different question. Industry reporting places used passenger cars and light commercial vehicles at roughly 12.8 million transactions for 2025. A broader used and nearly-new series covering additional vehicle categories reaches approximately 18 million. Total ownership transfers across all vehicle types reached a record near 18.5 million. This report counts passenger vehicles, and readers comparing against the wider Brazilian figures should expect a materially lower number.
The flex-fuel structure is the region's defining technical feature. Brazilian vehicles capable of running on ethanol, gasoline or any blend have dominated new sales since the mid-2000s, and that installed base now flows through resale at scale. The practical consequence is that Latin American propulsion analysis cannot be mapped onto the gasoline-diesel-electrified framework used elsewhere. It also means the region's decarbonisation path differs structurally, since a substantial share of the parc already runs on renewable fuel without any electrification.
Mexico underwent a policy shift with regional implications. The federal regularisation programme covering imported foreign-plated vehicles ended definitively in January 2026, having regularised nearly three million vehicles over its life. Future used imports must follow trade-agreement rules, which removes a channel that had supplied a substantial volume of informal-market stock. Dealer representatives welcomed the change as restoring certainty to the formal market, and it should accelerate the shift of volume toward organised retail.
Market Dynamics
Key Drivers
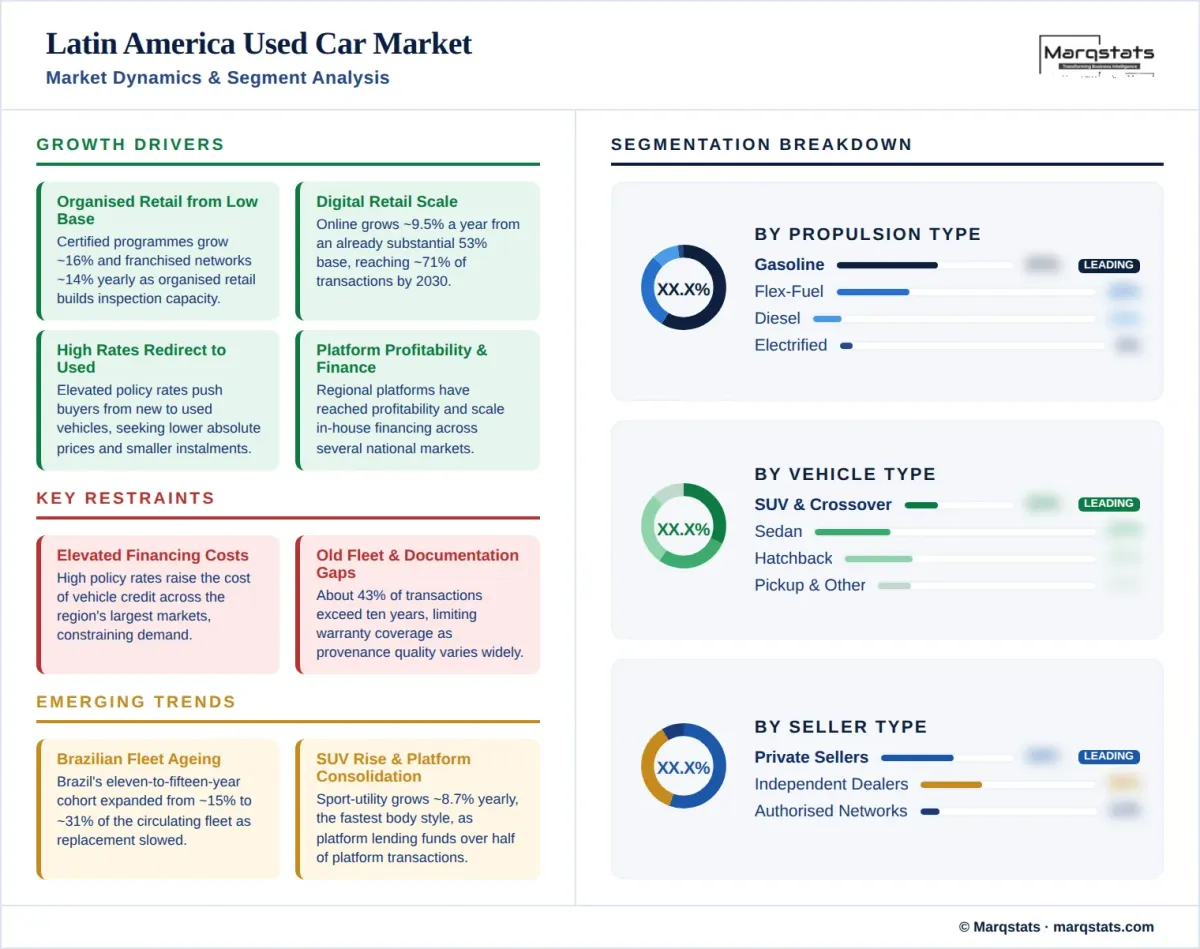
- Certified programmes grow at a 15.96% CAGR and franchised networks at 13.78%, as organised retail builds inspection and warranty capacity from a low base.
- Digital and omnichannel retail scales at a 9.48% CAGR from an already substantial 53% base, reaching about 71% of transactions by 2030.
- High interest rates redirect demand from new to used vehicles, as buyers seek lower absolute purchase prices and smaller instalments.
- Regional platform operators have reached profitability and are scaling in-house financing across multiple national markets.
- Mexico's end to import regularisation channels volume toward formal retail from January 2026.
Key Restraints
- Financing costs remain elevated across the region, with high policy rates raising the cost of vehicle credit in the largest markets.
- About 43% of transactions involve vehicles older than ten years, limiting warranty coverage and certified programme eligibility.
- Vehicle provenance and documentation quality vary widely, raising inspection costs for organised retailers.
- Currency volatility across several national markets complicates cross-border sourcing and dollar-denominated planning.
Key Trends
- Fleet ageing is accelerating in Brazil, where the eleven-to-fifteen-year cohort expanded from about 15% to about 31% of the circulating fleet.
- Sport-utility share is rising at an 8.73% CAGR, the fastest body-style growth in the region, as the format works through into resale.
- Regional digital platforms are consolidating, with in-house lending arms financing more than half of platform transactions.
- Electrified resale is emerging from a very low base, with battery-electric transfers growing at a 32.35% CAGR.
Market Segmentation
Sport-utility and crossover models account for about 31% of 2025 volume and grow at an 8.73% CAGR, the fastest body-style growth in the region, reaching about 40% by 2030. Sedans hold about 27% of transactions and contract at 1.18% annually, while hatchbacks hold about 27% and contract faster at 2.14%. The three body styles are close to level in 2025 and diverge sharply thereafter, reflecting the crossover shift working through Latin American new-vehicle purchasing over the past decade.
Pickup trucks account for about 9% of 2025 volume, a share exceeded only in North America, and grow at a 6.45% CAGR to about 11% by 2030. Demand spans agriculture, construction and small-business use across Brazil, Argentina and Mexico, and compact pickups produced within the region hold durable resale positions. MPV and minivan models hold about 4% of transactions and grow slowly at 1.04% annually.
Alternative fuels account for about 28% of 2025 volume, almost entirely flex-fuel vehicles, and remain at about 25% by 2030 while growing marginally at 0.82% annually. This is the highest alternative-fuel concentration of any region in this study by a wide margin. Gasoline holds about 57% of transactions and contracts slightly at 0.20% annually, while diesel holds about 10% and contracts at 1.62%, concentrated in pickups and larger utility vehicles rather than in passenger cars.
Battery-electric transfers grow from roughly 372 thousand units in 2025 to roughly 2.03 million by 2030, a 32.35% CAGR that lifts share from about 1.4% to about 6.3%. Hybrids grow at 25.24% annually to about 10% of volume and plug-in hybrids at 30.20% to about 3%. Growth is concentrated in Mexico, Brazil and Chile, where new-vehicle electrification has advanced fastest, and Chinese marques have been the principal suppliers of that stock across several regional markets.
Private sellers handle about 54% of 2025 transactions, the second-highest informal share of any region in this study after the Middle East and Africa, and contract at a negative 3.40% CAGR to about 39% by 2030. Much of this volume moves through classified platforms and informal resale lots rather than professional premises. The channel's decline is the clearest single indicator of regional formalisation, and it is happening while the market itself grows at 3.27% annually.
Independent dealers and professional retailers hold about 35% of 2025 volume and grow at a 7.35% CAGR to about 43% by 2030. Manufacturer-authorised networks hold only about 11% of transactions, among the lowest franchised shares in this study, however they grow fastest of any seller type at a 13.78% CAGR to about 18%. Certified and warranty-backed transactions grow at 15.96% annually from about 12% of the market to about 23%, driven by regional platform operators building proprietary inspection standards.
Online and omnichannel transactions hold about 53% of 2025 volume and grow at a 9.48% CAGR to about 71% by 2030. Latin American used-car markets developed alongside mobile commerce, and classified platforms achieved very large scale early across Brazil, Mexico and the Andean markets. Regional operators combining listing, inspection, reconditioning, delivery and in-house financing have scaled across multiple national markets, and their lending arms finance more than half of their own platform transactions.
Offline transactions hold about 48% of 2025 volume and decline at a negative 6.87% CAGR to about 29% by 2030. The offline channel spans manufacturer showrooms, independent premises and informal resale lots that remain significant across provincial markets. Inspection, documentation and title transfer requirements sustain a physical intermediary role, particularly in markets where vehicle provenance verification is difficult and buyers rely on in-person assessment.
Vehicles older than ten years account for about 43% of 2025 transactions and contract at a negative 2.53% CAGR to about 32% by 2030. Vehicles aged seven to ten years hold about 26% and grow at 4.21% annually. Brazilian fleet data illustrates the underlying ageing: average fleet age has passed eleven years, and the eleven-to-fifteen-year cohort expanded from about 15% to about 31% of the circulating fleet, with a long-discontinued compact hatchback the highest-volume model in that band.
Vehicles up to three years old account for about 12% of 2025 volume, among the smallest near-new shares in this study, and grow fastest of any age cohort at a 9.94% CAGR to about 16% by 2030. The four-to-six-year cohort holds about 20% and grows at 7.76%. Both depend on new-vehicle sales recovering across the region and on rental and corporate fleet disposals, which are the principal organised source of near-new stock in Brazil and Mexico.
Transactions below USD 10,000 account for about 42% of 2025 volume and contract at a negative 2.40% CAGR to about 32% by 2030. The USD 10,001 to USD 20,000 band is the volume core at about 39% of transactions and grows at 2.35% annually. Together these bands carry about 80% of regional volume, which is why average transaction price sits at USD 9,390, below the European average and well below North America.
The USD 20,001 to USD 30,000 band grows at 10.60% annually from about 13% of volume to about 19%. Transactions above USD 30,000 grow at 16.83% annually, rising from about 6% of volume to about 12% and reaching USD 101.65 billion by 2030. Premium and luxury vehicles grow at 8.88% annually from about 10% of transactions to about 13%, concentrated in the metropolitan markets of Brazil, Mexico and Chile.
By Geography
Brazil
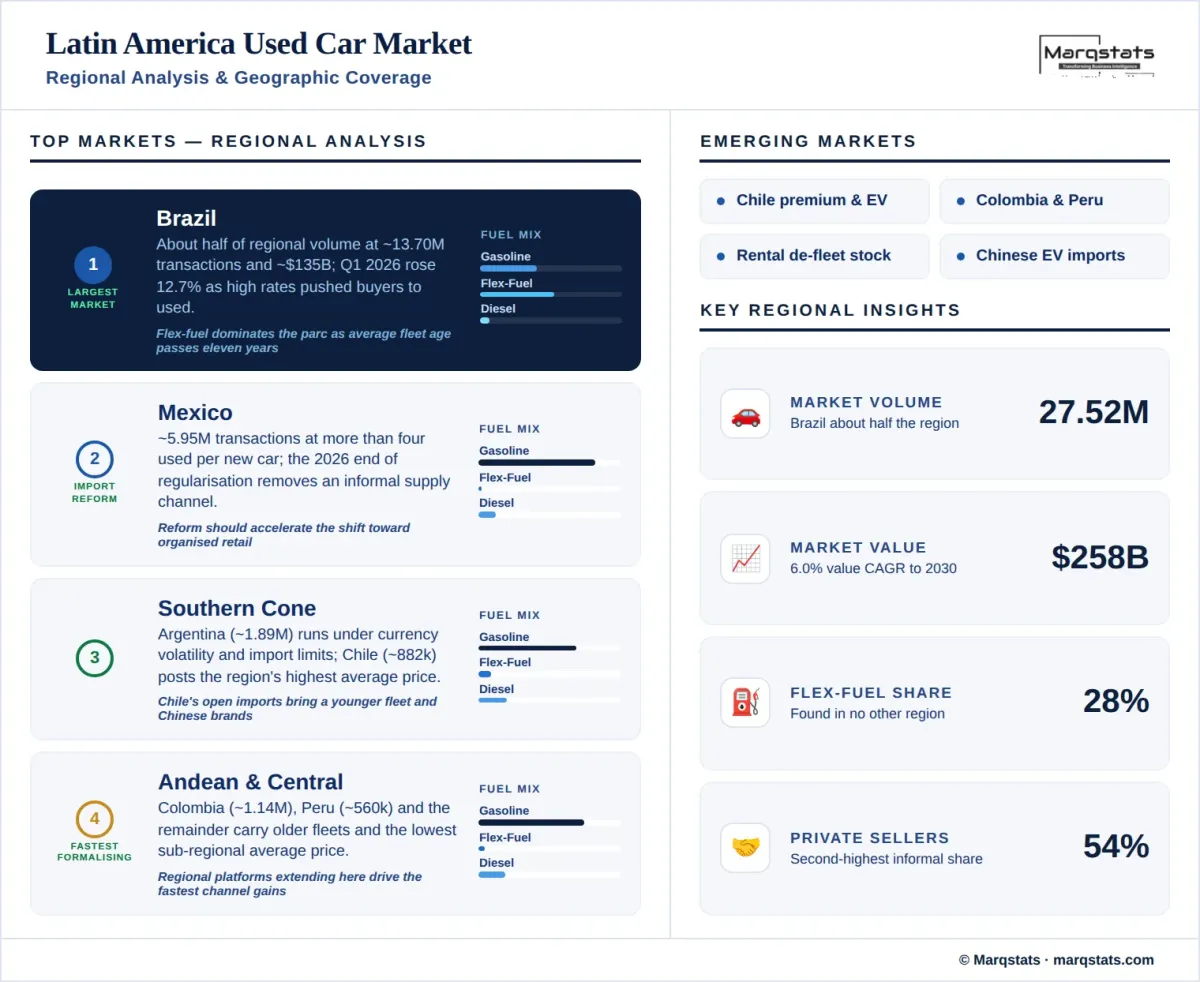
Brazil accounts for about half of regional volume at roughly 13.70 million transactions and about USD 135.03 billion in value. The market set successive records across the review period, and first-quarter 2026 transactions reached about 4.38 million units, up 12.7% year on year. High policy interest rates have pushed buyers toward used vehicles by lowering absolute purchase prices and instalment sizes. Flex-fuel vehicles dominate the parc, and average fleet age has passed eleven years as replacement slowed.
Mexico
Mexico is the second-largest market at roughly 5.95 million transactions and about USD 59.58 billion. Industry estimates place used sales at more than four vehicles for every new car sold, among the highest ratios in this study. New light-vehicle sales reached about 1.52 million units in 2025. The definitive end of the import regularisation programme in January 2026, after nearly three million vehicles had been regularised, removes a substantial informal supply channel and should accelerate the shift toward organised retail.
Southern Cone
Argentina records roughly 1.89 million transactions and Chile about 882 thousand, with Chile posting the highest average transaction price in the region at about USD 11,499. Argentina's market operates under persistent currency volatility and import restrictions that have historically constrained new-vehicle supply and elevated used values. Chile's open import regime and higher incomes produce a younger fleet and stronger premium penetration than the regional average, alongside notable Chinese brand presence in both new and used stock.
Andean & Central America
Colombia records about 1.14 million transactions and Peru about 560 thousand, with the remaining regional markets adding roughly 3.40 million. Average transaction price across the remainder is about USD 6,806, the lowest sub-regional figure, reflecting older fleets and lower incomes across Central America and the smaller Andean markets. Regional platform operators have extended into Colombia and Peru, and these markets show the fastest proportional growth in organised channel penetration.
How Competition Is Evolving
The Latin America used car market is fragmented and predominantly informal. Private-party transactions account for about 54% of 2025 volume, independent dealers and resale lots for a further 35%, and manufacturer-authorised networks for only about 11%. No operator holds more than a low single-digit regional share. Formalisation is advancing at pace, with certified transactions growing at 15.96% annually and authorised networks at 13.78%, both from among the lowest bases in this study.
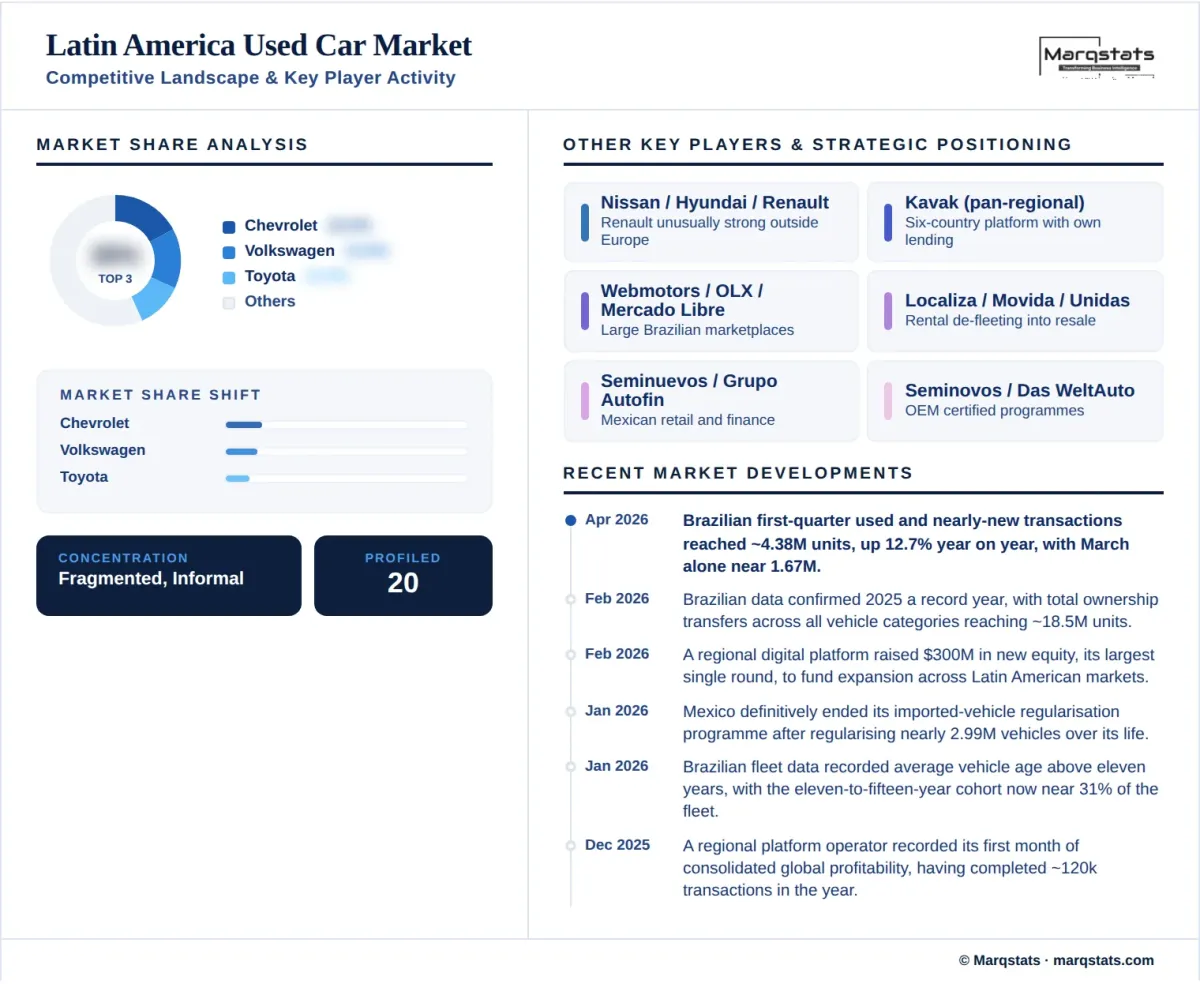
Brand structure reflects decades of regional manufacturing by American and European volume marques. Chevrolet leads at about 15% of transactions, followed by Volkswagen at about 13%, Toyota at about 10%, Nissan at about 9% and Hyundai at about 7%. Renault holds a meaningful position at about 7%, unusual outside Europe, sustained by long-standing manufacturing operations in Brazil, Argentina and Colombia. The ranking reflects the composition of the ageing parc rather than current registration performance.
The most distinctive competitive feature is the emergence of pan-regional digital platforms. One operator now works across Mexico, Brazil, Argentina, Chile, Colombia and Peru, reached its first month of consolidated global profitability in December 2025, and completed approximately 120 thousand transactions across the region during that year while raising USD 300 million in new equity. Its in-house lending arm finances more than half of platform transactions, which is the mechanism that makes organised retail viable where bank credit is expensive or unavailable.
Competition therefore centres on financing capability rather than on inventory or retail margin. With policy rates elevated across the largest markets and formal credit penetration limited, operators able to underwrite and fund their own transactions capture volume that would otherwise remain in the informal channel. Reconditioning throughput and provenance verification form the second competitive layer, since documentation quality varies widely and buyers pay a premium for inspected, warranted vehicles.
Companies Covered
The report profiles 16+ companies with full strategy and financials analysis, including:
Recent Market Activity
Table of Contents
Coverage & Segmentation
This report provides a comprehensive assessment of the Latin America used car market across a 2025 base year, historical data from 2021 to 2025, and forecasts spanning 2026 to 2030. Six national markets are modelled individually, namely Brazil, Mexico, Argentina, Colombia, Chile and Peru, together accounting for about 88% of regional volume, with remaining markets aggregated. Mexico is treated within Latin America rather than North America. Market sizing is presented in unit-volume terms and complemented by value analysis in United States dollars, with segmentation across ten dimensions.
The scope covers regional demand drivers, restraints and structural trends, with particular focus on the flex-fuel propulsion structure, Brazilian fleet ageing, Mexico's end to import regularisation, the pan-regional platform model and its financing dependency, and the pace of channel formalisation. Comparative benchmarking against a region at a similar stage of formalisation is available in the Middle East and Africa used car market report. An extended forecast to 2035 is available under customization, alongside deeper country breakouts on request.