Market Snapshot
Key Takeaways
Market Overview & Analysis
Report Summary
The Brazil used car market comprises used passenger vehicle transactions recorded across all states and the federal district in a calendar year, transacted through manufacturer-authorised networks, independent dealers and resale lots, digital platforms, rental fleet disposal channels, and direct private-party sales. This study segments demand by vehicle type, propulsion type, seller type, sales channel, vehicle age, vehicle mileage, price band, certification status, vehicle positioning, and brand, with a 2025 base year, historical coverage from 2021 to 2025, and forecasts to 2030.
Three different Brazilian totals circulate and each answers a different question. Industry reporting places used passenger cars and light commercial vehicles at roughly 12.8 million transactions for 2025. A broader used and nearly-new series covering additional vehicle categories, including motorcycles, reached approximately 18 million and was described as a record. Total ownership transfers across all vehicle types reached about 18.5 million. This report counts used passenger vehicles at 13.70 million, and readers benchmarking against the eighteen-million figures will conclude the model is roughly a quarter low when in fact the vehicle scopes differ.
Interest rates are the dominant demand variable. Policy rates held at elevated levels throughout 2025, which raised the cost of vehicle credit and pushed buyers toward vehicles with better absolute affordability. The consequence was a record year: cumulative transactions reached 16.73 million units through November on the broader series, about 17% above the same period of 2024 and already exceeding the full prior-year record. Momentum carried into 2026, with first-quarter transactions of about 4.38 million units, up 12.7% year on year.
Fleet ageing follows directly from that affordability squeeze. Average vehicle age has passed eleven years, a historic high, and the eleven-to-fifteen-year cohort has roughly doubled its share of the circulating fleet from about 15% to about 31%. The highest-volume model in that band is a compact hatchback discontinued years ago, which illustrates how far demand has shifted toward the oldest tradeable stock. The forecast shows this reversing gradually, with vehicles over ten years old falling from about 35% of transactions to about 24% by 2030.
Market Dynamics
Key Drivers
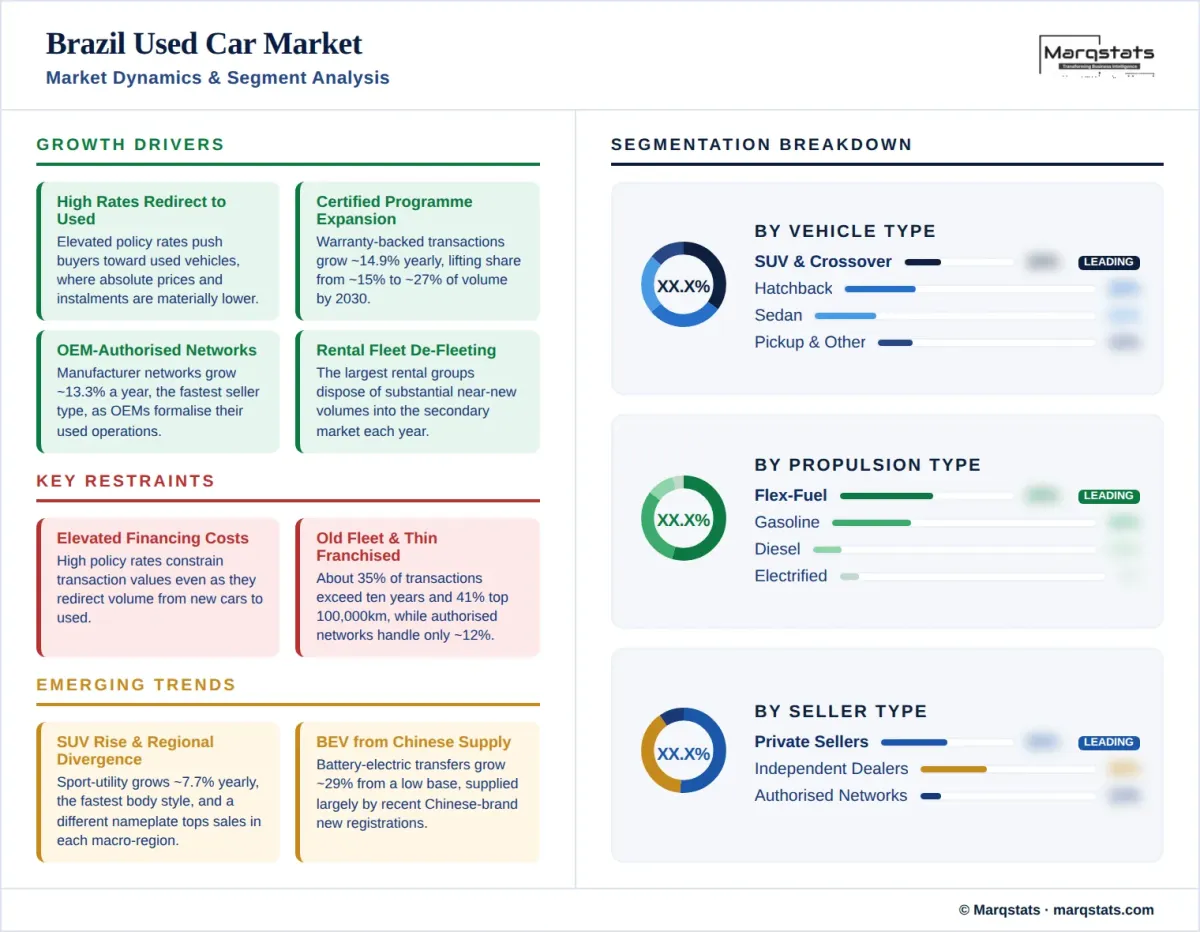
- Elevated policy interest rates redirect demand toward used vehicles, where absolute purchase prices and instalment sizes are materially lower than for new cars.
- Certified and warranty-backed transactions grow at a 14.87% CAGR, lifting share from about 15% of volume to about 27% by 2030.
- Manufacturer-authorised networks grow at a 13.33% CAGR, the fastest seller-type growth, as original-equipment manufacturers formalise used operations.
- Digital and omnichannel retail scales at an 8.73% CAGR from an already substantial 55% base, reaching about 73% of transactions by 2030.
- Rental and fleet operators supply near-new inventory at scale, with the largest groups disposing of substantial volumes into the secondary market annually.
Key Restraints
- Financing costs remain elevated, constraining transaction values even as they redirect volume from new to used.
- The traded fleet is old and high-mileage, with about 35% of transactions involving vehicles over ten years old and about 41% above 100 thousand kilometres.
- Manufacturer-authorised networks handle only about 12% of transactions, leaving most of the market outside warranty and structured finance.
- Entry-price inventory is contracting at a negative 2.99% CAGR, reducing supply below USD 10,000 that still carries about 40% of volume.
Key Trends
- Sport-utility and crossover share grows at a 7.74% CAGR, the fastest body-style growth in the market, reaching about 43% of transactions by 2030.
- Regional model preference diverges sharply, with a different nameplate topping sales in each of the five macro-regions.
- Battery-electric transfers grow at a 29.41% CAGR from a very low base, supplied largely by recent Chinese-brand new registrations.
- Pickup trucks hold about 10% of transactions and grow at 6.67% annually, supported by agriculture and small-business demand.
Market Segmentation
Sport-utility and crossover models account for about 34% of 2025 volume, the largest body type, and grow at a 7.74% CAGR to about 43% by 2030. Regional listing data shows sport-utility vehicles already ahead among nearly-new stock in the southern states at about 31% of that cohort, confirming the format arrives first in the younger age bands. Pickup trucks hold about 10% of transactions, a share exceeded only in North America, and grow at 6.67% annually, supported by agriculture, construction and small-business demand across the interior states.
Hatchbacks account for about 28% of 2025 volume and contract at a negative 2.87% CAGR to about 21% by 2030, the steepest body-style decline in the market. The segment nonetheless dominates the oldest age bands, where regional data shows hatchbacks at about 35% of transactions in the south and about 38% in the north, rising to about 39% for vehicles over thirteen years old in the centre-west. Sedans hold about 22% of transactions and contract at 2.38% annually to about 17%.
Flex-fuel vehicles account for about 53% of 2025 volume, the highest single-technology concentration of any market in this study, and remain about 47% of transactions in 2030 while growing marginally at 0.44% annually. Gasoline-only vehicles hold about 30% and contract at 2.54%, while diesel holds about 10% and contracts at 1.67%, concentrated almost entirely in pickups and larger utility vehicles rather than in passenger cars. The flex-fuel installed base means a substantial share of the Brazilian parc already operates on renewable fuel without any electrification.
Battery-electric transfers grow from roughly 274 thousand units in 2025 to roughly 1.25 million by 2030, a 29.41% CAGR that lifts share from about 2% to about 8%. Hybrids grow at 21.19% annually to about 10% of volume and plug-in hybrids at 29.41% to about 4%. Chinese marques have supplied the majority of recent electrified new registrations in Brazil, and that cohort will determine the composition of used electrified stock from 2027 onward. Combined electrified share reaches about 22% of transactions by 2030.
Private sellers handle about 50% of 2025 transactions and contract at a negative 4.98% CAGR to about 34% by 2030, one of the steeper private-channel declines in this study. Much of this volume moves through large national classified platforms rather than through professional premises. The contraction is happening while the market itself grows at 2.92% annually, which means organised retail is absorbing the entire volume increase and taking share from the informal channel simultaneously.
Independent dealers and professional retailers hold about 38% of 2025 volume, the largest professional channel, growing at a 6.84% CAGR to about 46% by 2030. Manufacturer-authorised networks hold only about 12% of transactions, among the lowest franchised shares in this study, however they grow fastest of any seller type at a 13.33% CAGR to about 20%. Certified and warranty-backed transactions grow at 14.87% annually from about 15% of the market to about 27%, supported by manufacturer programmes and by rental groups retailing their own de-fleeted vehicles.
Online and omnichannel transactions hold about 55% of 2025 volume and grow at an 8.73% CAGR to about 73% by 2030. Brazil's classified platforms achieved very large scale early and now function as the primary discovery layer for both private and professional sellers, publishing listing, search and pricing observatories that the trade uses as market indicators. Auction platforms sourcing from corporate fleets, rental companies, banks and insurers have grown quickly, supplying dealers seeking documented-provenance stock.
Offline transactions hold about 45% of 2025 volume and decline at a negative 7.51% CAGR to about 27% by 2030. The offline channel spans manufacturer showrooms, established independent dealerships and smaller resale lots that remain significant across interior municipalities. Physical inspection retains particular importance given the age profile of the traded fleet, and documentation and transfer procedures sustain an intermediary role that digital channels have not fully displaced.
Vehicles older than ten years account for about 35% of 2025 transactions and contract at a negative 4.81% CAGR to about 24% by 2030, the steepest age-cohort decline in the market. Vehicles aged seven to ten years hold about 27% and grow at 3.67% annually. The contraction of the oldest cohort runs against the fleet-ageing trend and reflects the forecast recovery in new-vehicle supply feeding younger stock into resale, alongside gradual improvement in credit conditions.
Vehicles up to three years old account for about 15% of 2025 volume and grow fastest of any age cohort at an 8.82% CAGR to about 20% by 2030. The four-to-six-year cohort holds about 23% and grows at 6.96% to about 28%, becoming the largest single age band. Rental and corporate fleet disposals are the principal organised source for both cohorts, and the scale of Brazilian rental operations makes near-new supply unusually sensitive to fleet renewal cycles.
Transactions below USD 10,000 account for about 40% of 2025 volume and contract at a negative 2.99% CAGR to about 30% by 2030. The USD 10,001 to USD 20,000 band is the volume core at about 39% of transactions and grows at 1.27% annually. Together these bands carry about 79% of national volume, which is why average transaction price sits at USD 9,857, close to the Latin American regional average and well below European levels.
The USD 20,001 to USD 30,000 band grows at 10.23% annually from about 14% of volume to about 20%. Transactions above USD 30,000 grow at 16.94% annually, rising from about 7% of volume to about 14% and reaching USD 56.14 billion by 2030, approximately a third of total market value. Premium and luxury vehicles grow at 8.30% annually from about 10% of transactions to about 13%, concentrated in the south-east metropolitan markets.
By Geography
Southeast
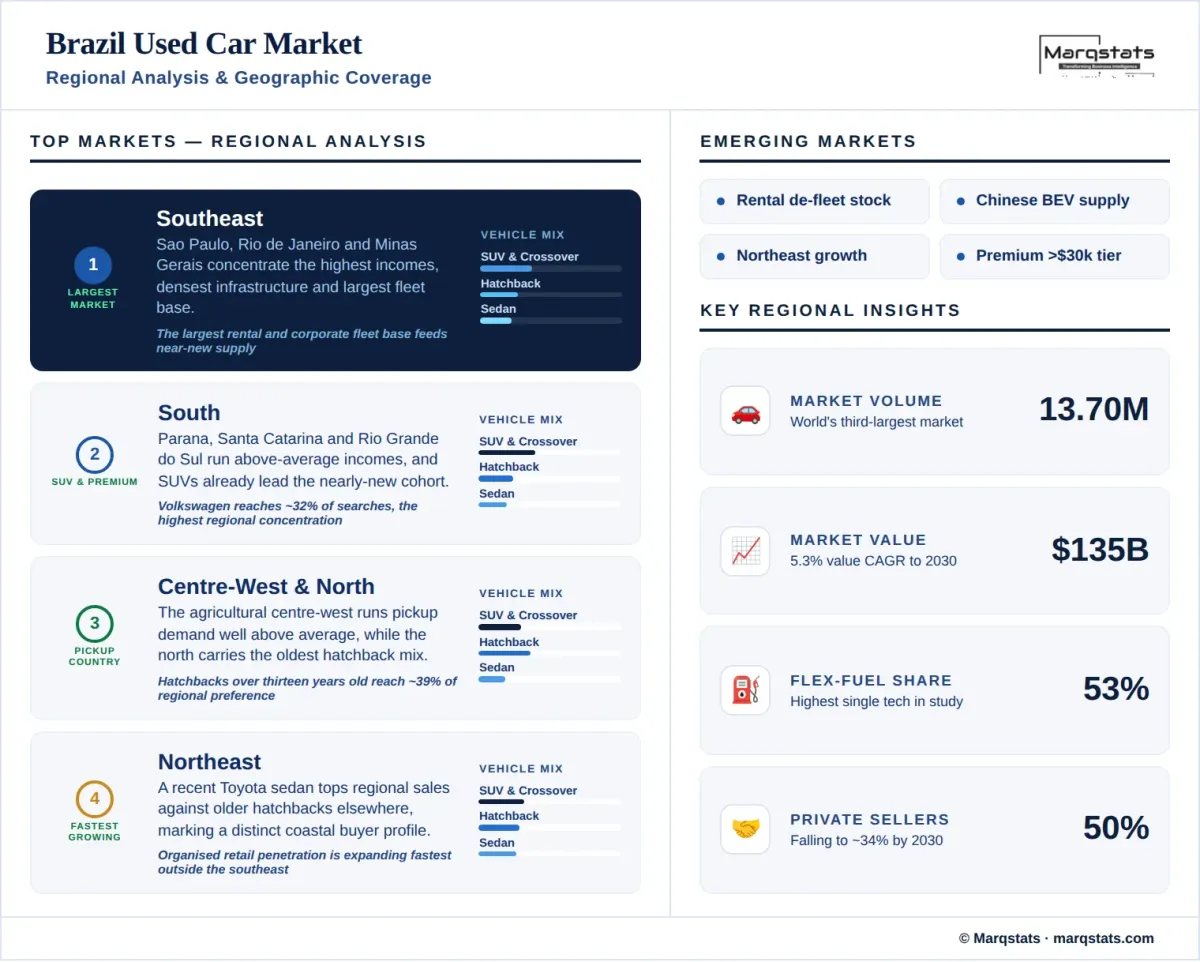
The southeast, encompassing São Paulo, Rio de Janeiro, Minas Gerais and Espírito Santo, is the largest regional market by both volume and value. It concentrates the highest household incomes, the densest dealer and platform infrastructure, and the largest rental and corporate fleet base in the country. Regional listing data shows a compact hatchback from the mid-2010s topping sales while an older sedan led searches, indicating a gap between aspiration and affordability that is more pronounced here than elsewhere.
South
Paraná, Santa Catarina and Rio Grande do Sul form the second-largest regional market by value, with higher average incomes than the national mean. Sport-utility vehicles already lead among nearly-new stock at about 31% of that cohort, while hatchbacks dominate the oldest age bands at about 35%. Volkswagen holds the strongest regional brand position at about 32% of platform searches, the highest single-brand concentration recorded in any Brazilian region.
Centre-West & North
The centre-west, covering Goiás, Mato Grosso, Mato Grosso do Sul and the federal district, is an agricultural powerhouse where pickup demand runs well above the national average. Hatchbacks over thirteen years old account for about 39% of regional preference, the oldest mix in the country, and a compact Fiat hatchback from 2012 led regional sales. The north, spanning the Amazon states, shows a similar age profile with older hatchbacks at about 38% and Chevrolet the strongest brand at about 27% of searches.
Northeast
The northeast, covering Bahia, Pernambuco, Ceará and the surrounding states, diverges from the national pattern in a way no other region does. A recent Toyota sedan led regional sales, against older hatchbacks and compact models everywhere else, indicating a distinct buyer profile concentrated in the coastal capitals. The region combines lower average incomes with rapid growth in organised retail penetration, and it is where platform operators have expanded fastest outside the south-east.
How Competition Is Evolving
The Brazil used car market is fragmented and substantially informal. Private-party transactions account for about 50% of 2025 volume, independent dealers and resale lots for about 38%, and manufacturer-authorised networks for only about 12%. No operator holds more than a low single-digit share of national transactions. Formalisation is advancing quickly, with certified programmes growing at 14.87% annually and authorised networks at 13.33%, both faster than any other seller-side measure in the market.
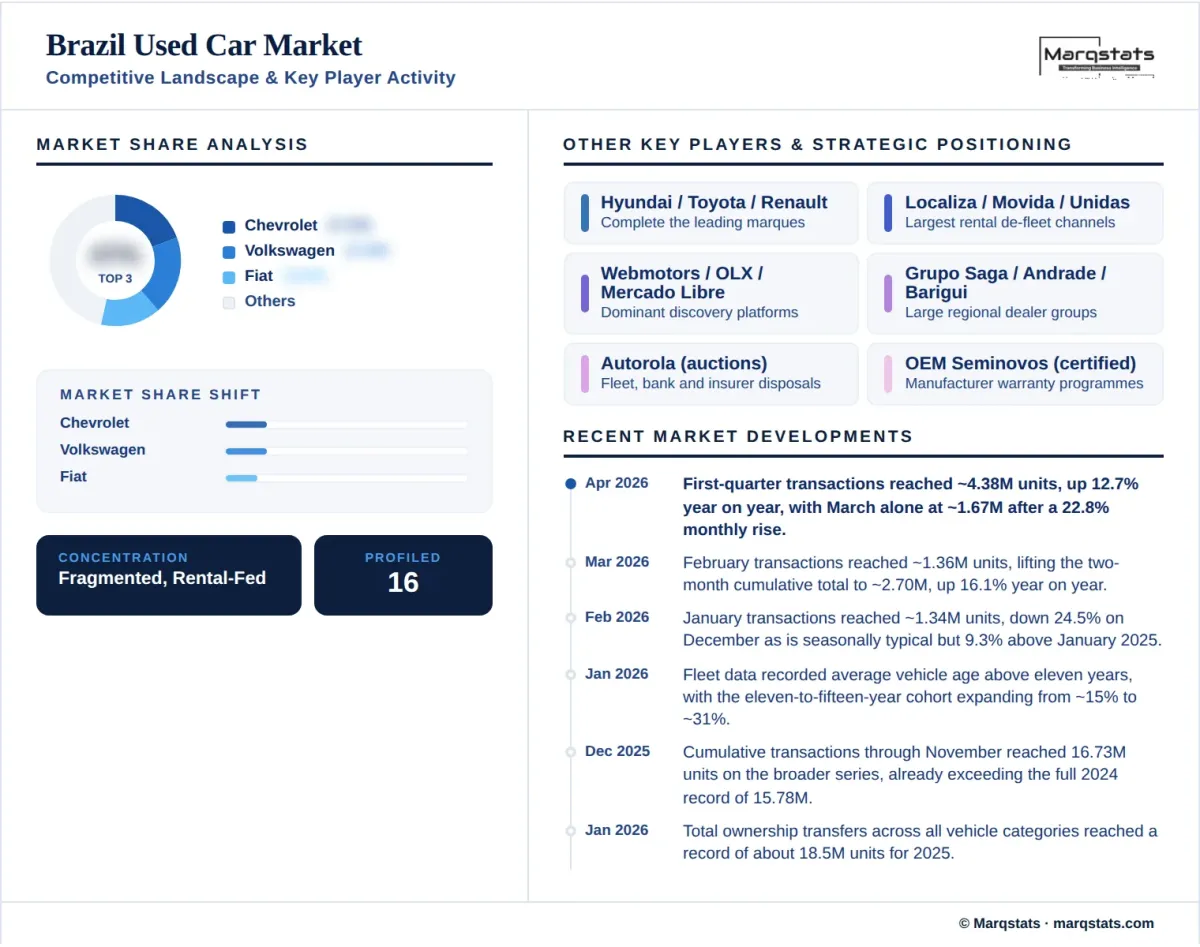
Brand structure reflects decades of local manufacturing. Chevrolet and Volkswagen lead jointly at about 17% of transactions each, followed by Hyundai and Toyota at about 9% and Renault at about 8%. Fiat holds a comparable top-tier position, and its compact models dominate the oldest age bands: a Fiat hatchback was the highest-volume used model in the eleven-to-fifteen-year fleet cohort, and a Fiat compact sedan ranked second among all used models nationally at roughly 35 thousand units. Any brand analysis that omits Fiat misreads the Brazilian market.
Three operator types compete for the organised segment. Rental and mobility groups operate the largest single disposal channels in the country, retailing de-fleeted vehicles through their own branded used networks, and their scale gives them sourcing advantages no independent can match. Digital platforms provide the discovery layer and increasingly the transaction layer, with auction operations sourcing from corporate fleets, banks and insurers. Manufacturer certified programmes are growing fastest from the smallest base, using franchised showroom networks and warranty backing.
Competition centres on inventory sourcing and provenance rather than on retail pricing. With half the market informal and a traded fleet averaging over a decade old, the operators in the strongest position are those with structural access to documented-provenance stock, whether through rental de-fleeting, corporate fleet contracts or bank and insurer disposals. Financing attachment is the second determinant of profit per unit, and it carries particular weight where policy rates keep consumer credit expensive.
Companies Covered
The report profiles 16+ companies with full strategy and financials analysis, including:
Recent Market Activity
Table of Contents
Coverage & Segmentation
This report provides a comprehensive assessment of the Brazil used car market across a 2025 base year, historical data from 2021 to 2025, and forecasts spanning 2026 to 2030. Market sizing is presented in unit-volume terms and complemented by value analysis in United States dollars converted from a Brazilian real base. Segmentation covers ten dimensions. The transaction layer counted is the used passenger vehicle transaction, which is narrower than the widely quoted eighteen-million figures covering additional vehicle categories and total ownership transfers.
The scope covers demand drivers, restraints and structural trends, with particular focus on the flex-fuel parc structure, fleet ageing and the expansion of the eleven-to-fifteen-year cohort, interest rate effects on demand redirection, rental fleet disposal as a near-new supply channel, regional model divergence, and the pace of channel formalisation. Comparative benchmarking against the region's second-largest market is available in the Mexico used car market report. An extended forecast to 2035 is available under customization, alongside state-level breakouts and deeper cuts by brand or channel on request.