Market Snapshot
Key Takeaways
Market Overview & Analysis
Report Summary
The Saudi Arabia used car market comprises used passenger vehicle transactions recorded across all thirteen administrative regions in a calendar year, transacted through manufacturer-authorised dealer networks, independent dealers and vehicle lots, digital marketplaces and classified platforms, and direct private-party sales. This study segments demand by vehicle type, propulsion type, seller type, sales channel, vehicle age, vehicle mileage, price band, certification status, vehicle positioning, and brand, with a 2025 base year, historical coverage from 2021 to 2025, and forecasts to 2030.
Data availability requires unusual candour here. No government authority publishes used-vehicle transaction volumes or values for the kingdom, and the estimates that circulate publicly disagree by a factor of roughly two and a half. Values of about USD 10 billion, about USD 13 billion and about USD 24.5 billion have all been published for 2025 by different organisations. That range is not a disagreement about growth or momentum; it reflects different assumptions about how many vehicles change hands and at what average price, neither of which any of those sources discloses.
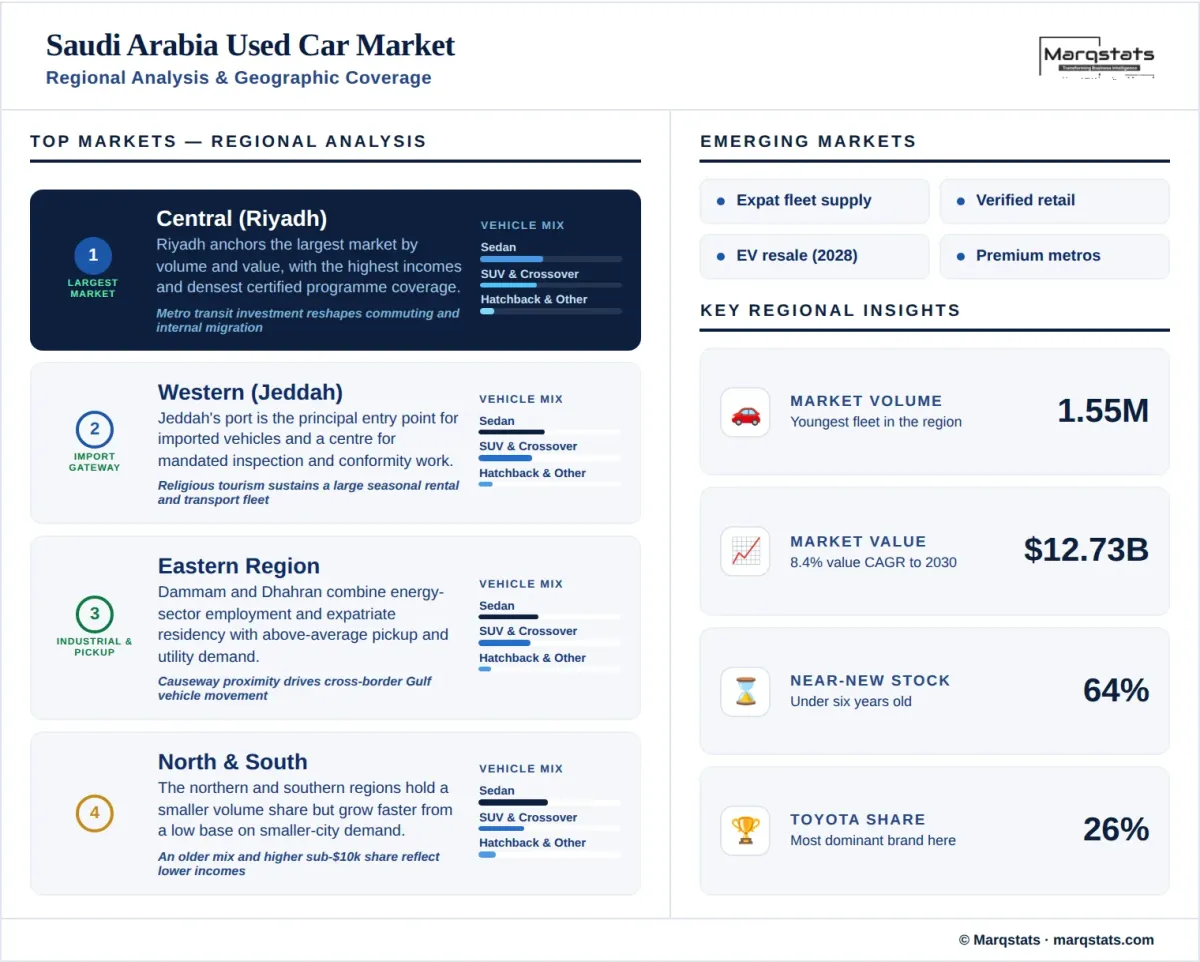
This report resolves the problem by sizing on volume. Marqstats estimates 1.55 million used passenger-vehicle transactions in 2025 at an average transaction price of about USD 8,214, giving USD 12.73 billion. Both inputs are stated, so a reader who disagrees with either can substitute their own and recompute. A figure near USD 24.5 billion would require either roughly three million annual transactions or an average price near USD 15,800, and neither is consistent with a market where new-vehicle sales run below one million units and where the mid-price band dominates.
The structural picture is a young, formalising market with an unusual supply mechanism. Expatriate residents form a substantial share of the population, and their departures release low-mileage vehicles into the market in seasonal concentrations that have no equivalent in other markets covered. Corporate and rental fleets rotate vehicles on short cycles, and a policy change removing incentives tied to taxi vehicle age released additional sedan stock into resale. Together these produce a traded fleet materially younger than regional norms.
Market Dynamics
Key Drivers
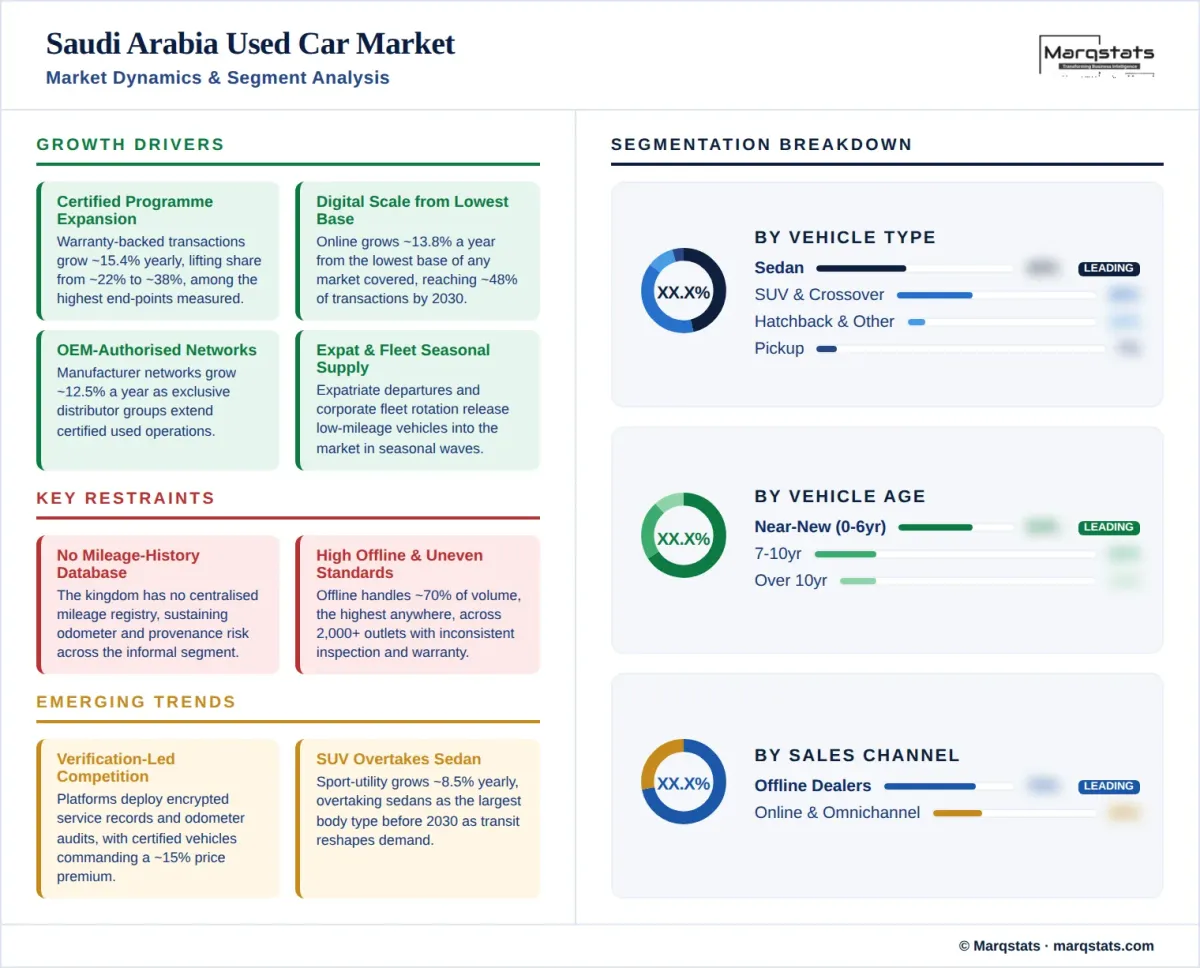
- Certified programmes grow at a 15.35% CAGR, lifting warranty-backed share from about 22% of volume to about 38% by 2030, among the highest end-points in this study.
- Digital and omnichannel retail scales at a 13.80% CAGR from the lowest base of any market covered, reaching about 48% of transactions by 2030.
- Manufacturer-authorised networks grow at a 12.48% CAGR as distributor groups extend certified used operations.
- Expatriate departures and corporate fleet rotation release low-mileage vehicles into the market in seasonal concentrations.
- Mandated inspection and conformity certification for imported used vehicles is raising baseline quality across the formal channel.
Key Restraints
- No centralised vehicle mileage-history database exists, sustaining odometer and provenance risk across the informal segment.
- Offline channels still handle about 70% of transactions, the highest offline share of any market covered, limiting price transparency.
- Inspection quality, warranty practice and service-record documentation remain inconsistent across a dealer base exceeding two thousand outlets.
- The absence of official transaction data raises planning risk, with published market valuations differing by roughly two and a half times.
Key Trends
- Digital platforms are competing on verification, deploying encrypted service-record uploads and electronic odometer audits to justify a price premium.
- Buyers pay a measurable premium for certified vehicles, reported at around 15% over comparable non-certified stock.
- Sport-utility and crossover share grows at an 8.51% CAGR, overtaking sedans as the largest body type before 2030.
- Metropolitan transit investment in the central region is reshaping commuter vehicle demand and internal migration patterns.
Market Segmentation
Sedans account for about 45% of 2025 volume, the largest body type and a share exceeded only in China among the markets covered. The concentration reflects Gulf purchasing patterns, long highway distances and a taxi and ride-hailing fleet built almost entirely on mid-size saloons. The segment contracts marginally at 0.55% annually to about 36% by 2030. Hatchbacks account for only about 4% of transactions, among the smallest hatchback shares in this study, reflecting fuel costs low enough that compact-car economics carry little weight.
Sport-utility and crossover models account for about 38% of 2025 volume and grow at an 8.51% CAGR, overtaking sedans as the largest body type before 2030 and reaching about 47%. Terrain, family size and highway distances all favour the format, and Gulf new-vehicle purchasing shifted decisively toward it over the past decade. Pickup trucks hold about 7% of transactions and grow at 6.87% annually, supported by construction, agriculture and commercial demand across the eastern and northern regions.
Gasoline accounts for about 88% of 2025 volume and grows marginally at 0.49% annually while falling to about 74% of share by 2030. Diesel holds only about 5% of transactions, concentrated in pickups and commercial-adjacent vehicles. Fuel pricing has historically favoured larger-displacement gasoline engines, and the passenger parc reflects that: the propulsion transition here runs directly from gasoline to electrified without any diesel decline phase.
Battery-electric transfers grow from roughly 12 thousand units in 2025 to roughly 113 thousand by 2030, a 39.88% CAGR and among the fastest electrification rates in this study, lifting share from about 0.8% to about 6%. Hybrids grow at 29.44% annually to about 11% of volume and plug-in hybrids at 38.40% to about 2%. Growth is supported by national industrial policy directed at electric vehicle manufacturing and charging infrastructure, though the used market will only reflect that from around 2028 as recent registrations reach resale age.
Independent dealers and professional retailers hold about 42% of 2025 volume, the largest seller channel, growing at a 7.30% CAGR to about 49% by 2030. Manufacturer-authorised networks hold about 16% and grow at a 12.48% CAGR to about 24%, a comparatively high franchised share for the region reflecting the strength of exclusive national distributor groups. Certified and warranty-backed transactions grow at 15.35% annually from about 22% of the market to about 38%, among the highest certification end-points in this study.
Private sellers handle about 42% of 2025 transactions and contract at a negative 5.05% CAGR to about 27% by 2030, one of the steepest private-channel declines measured in this study. The contraction reflects both the expansion of certified programmes and the growing weight buyers place on documented inspection in a market without a centralised mileage-history database. Classified platforms carry much of the remaining private volume and are themselves migrating toward verified-listing models.
Offline transactions hold about 70% of 2025 volume, the highest offline share of any market in this study, and decline at a negative 2.08% CAGR to about 52% by 2030. Physical inspection retains particular weight in a market where mileage and accident history cannot be verified through any central registry, and vehicle lots concentrated around the major metropolitan areas remain the default transaction venue. The dealer base exceeds two thousand outlets and varies widely in inspection and warranty practice.
Online and omnichannel transactions hold about 30% of 2025 volume, the lowest digital share of any market covered, and grow at a 13.80% CAGR to about 48% by 2030. That growth rate is among the fastest measured, and the low base is precisely the opportunity. Digital operators compete on verification rather than on price, deploying encrypted service-record uploads, electronic odometer audits and rapid inspection turnaround, and that transparency layer is what justifies the premium they command over informal lots.
Vehicles up to three years old account for about 25% of 2025 volume and grow at a 7.18% CAGR to about 29% by 2030. The four-to-six-year cohort is the largest single age band at about 39% of transactions. Together they represent about 64% of volume, a near-new concentration exceeded only in China among the markets covered. Corporate and rental fleet rotation, expatriate departures and short private holding periods all feed this profile.
Vehicles aged seven to ten years hold about 22% of volume and grow at 3.12% annually. Vehicles older than ten years account for only about 14% of transactions, the lowest older-vehicle concentration in the Middle East and Africa and less than a third of the regional average. Vehicles above 100 thousand kilometres represent about 18% of transactions, also the lowest mileage profile in the region. Older stock exits the domestic market through export channels toward neighbouring and African destinations.
Transactions below USD 10,000 account for about 38% of 2025 volume and contract at a negative 2.25% CAGR to about 28% by 2030. The USD 10,001 to USD 20,000 band is the volume core at about 42% of transactions and grows at 3.07% annually. Together these bands carry about 80% of national volume, and average transaction price sits at USD 8,214, rising to USD 10,013 by 2030 as the mix shifts toward younger and higher-specification stock.
The USD 20,001 to USD 30,000 band grows at 13.00% annually from about 13% of volume to about 20%. Transactions above USD 30,000 grow at 15.19% annually, rising from about 7% of volume to about 12% and reaching USD 6.08 billion by 2030. Premium and luxury vehicles grow at 10.84% annually from about 13% of transactions to about 18%, concentrated in the central and western regions where household incomes and premium new-vehicle penetration are highest.
By Geography
Central Region
The central region, anchored by Riyadh, is the largest market by both volume and value. It concentrates the highest household incomes, the densest authorised dealer and certified programme coverage, and the largest corporate fleet base in the kingdom. Major metropolitan transit investment is reshaping commuting patterns and drawing internal migration into the capital, which supports sustained vehicle demand even as public transport capacity expands. The region also records the strongest premium and certified penetration nationally.
Western Region
The western region, covering Jeddah, Makkah, Madinah and Taif, forms the second-largest market. Jeddah's port makes it the principal entry point for imported vehicles and a centre for the inspection and conformity certification now required on used imports. Religious tourism generates substantial seasonal transport demand and sustains a large rental and transport fleet whose disposal cycles feed near-new stock into the secondary market on a distinct seasonal rhythm.
Eastern Region
The eastern region, encompassing Dammam, Dhahran, Al Khobar and Jubail, combines the highest concentration of industrial and energy-sector employment in the kingdom with substantial expatriate residency. Pickup and utility vehicle demand runs above the national average, supported by construction and industrial activity. Proximity to the causeway crossing creates cross-border vehicle movement with neighbouring Gulf markets that influences local pricing and availability.
Northern & Southern Regions
The northern regions, including Tabuk, Al Jouf and the Northern Borders, and the southern regions, covering Asir, Jazan and Najran, together account for a smaller share of national volume while showing faster proportional growth from a low base. Both areas carry an older vehicle mix and a higher share of transactions below USD 10,000, reflecting lower average incomes and thinner authorised dealer coverage. Demand from smaller cities has been among the more reliable growth sources in recent years.
How Competition Is Evolving
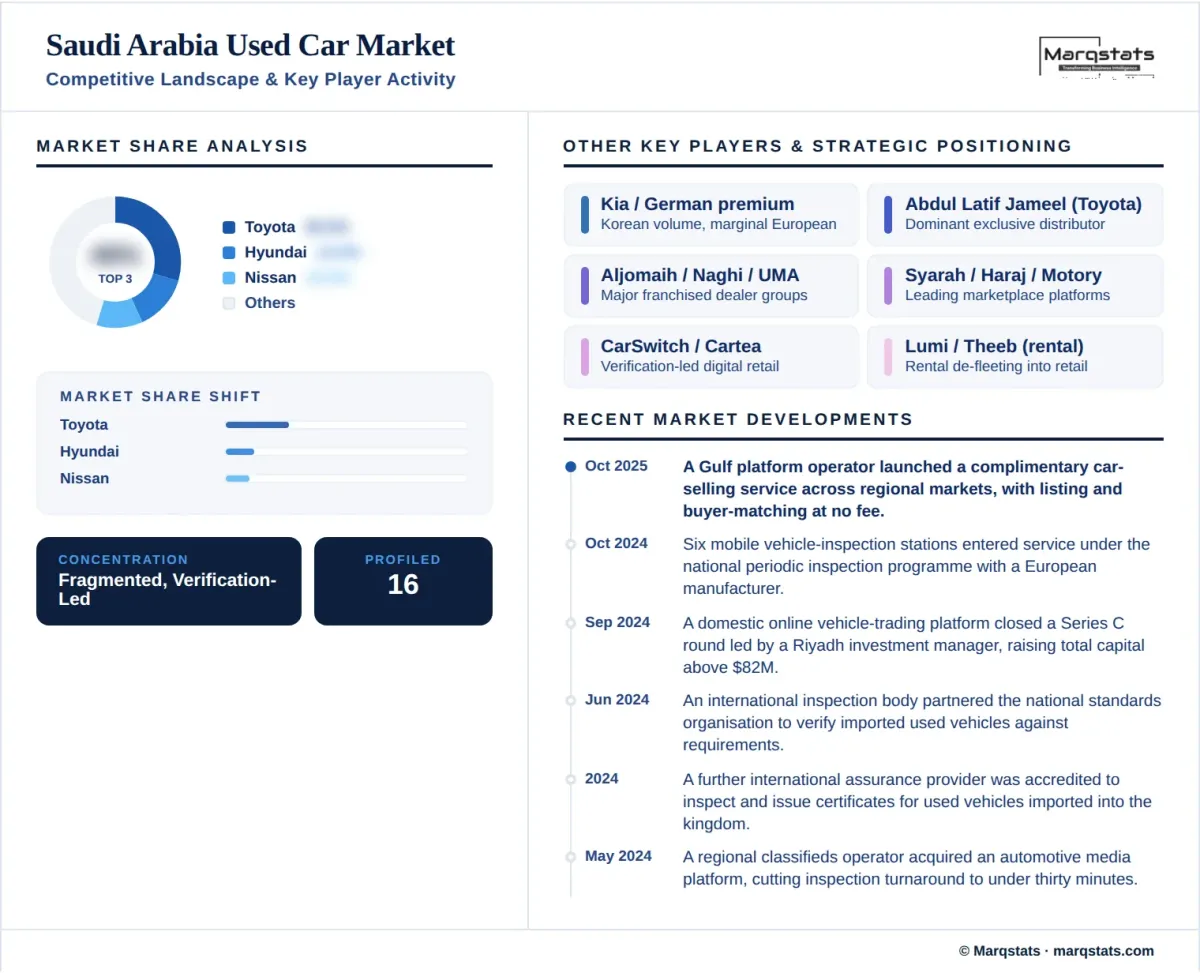
The Saudi Arabia used car market is fragmented, with independent dealers and professional retailers holding about 42% of volume, private sellers about 42% and manufacturer-authorised networks about 16%. The dealer base exceeds two thousand outlets, and inspection quality, warranty practice, mileage disclosure and service-record documentation remain inconsistent across it. No operator holds more than a low single-digit share of transactions, though concentration is increasing as certified programmes grow at 15.35% annually.
Brand structure is unusually concentrated. Toyota holds about 26% of used transactions, one of the most dominant single-brand positions measured in this study, supported by durability, parts availability and decades of leadership in Gulf new-vehicle sales. Hyundai follows at about 12%, Nissan at about 10% and Kia at about 9%. The Japanese and Korean marques together account for well over half of national volume, while European brands hold marginal positions outside the German premium segment at about 6% combined.
Competition is organised around verification rather than inventory. Because no central mileage-history database exists, the operators able to document condition credibly command a measurable premium, reported at around 15% for certified vehicles over comparable non-certified stock. Digital platforms have invested heavily in inspection turnaround, encrypted service records and electronic odometer audits, and international inspection bodies have been accredited to issue conformity certificates for imported used vehicles under national standards requirements.
Three operator groups compete for the formal segment. Exclusive national distributor groups leverage franchised networks, trade-in flows and manufacturer-backed certified programmes. Digital marketplaces and classified platforms provide discovery and are extending into inspection, financing and fulfilment, supported by successive venture funding rounds. Rental and mobility operators form a third layer, opening dedicated used outlets to retail their own de-fleeted vehicles directly rather than disposing through wholesale channels.
Companies Covered
The report profiles 16+ companies with full strategy and financials analysis, including:
Recent Market Activity
Table of Contents
Coverage & Segmentation
This report provides a comprehensive assessment of the Saudi Arabia used car market across a 2025 base year, historical data from 2021 to 2025, and forecasts spanning 2026 to 2030. Market sizing is presented in unit-volume terms and complemented by value analysis in United States dollars, with value derived as volume multiplied by segment-weighted average transaction price rather than estimated independently. Segmentation covers ten dimensions. The transaction layer counted is the used passenger vehicle transaction including private-party sales.
The scope covers demand drivers, restraints and structural trends, with particular focus on the absence of official transaction data and the resulting divergence in published valuations, the youngest traded fleet in the region, expatriate and fleet-driven supply seasonality, the mileage-verification gap and the inspection and certification response, and the lowest digital channel penetration of any market covered. Comparative benchmarking against the region's principal transit hub is available in the United Arab Emirates used car market report. An extended forecast to 2035 is available under customization, alongside regional breakouts on request.