Market Snapshot
Key Takeaways
Market Overview & Analysis
Report Summary
The Japan used car market comprises used passenger vehicle transactions recorded across all prefectures in a calendar year, transacted through manufacturer-affiliated dealer networks, independent dealers and used-car retail chains, online platforms, auction houses, and direct private-party channels. This study segments demand by vehicle type, propulsion type, seller type, sales channel, vehicle age, vehicle mileage, price band, certification status, vehicle positioning, and brand, with a 2025 base year, historical coverage from 2021 to 2025, and forecasts to 2030.
Japanese statistics are published across two separate authorities, which readers should reconcile before comparison. Registered passenger vehicles are reported by one national dealer association and light vehicles by another, and used-vehicle figures are compiled as new inspection registrations plus ownership transfers. New-vehicle sales for 2025 totalled about 4.57 million units across both categories, up 3.3%, comprising 2.90 million registered vehicles and 1.67 million light vehicles. Used transaction totals in this report combine both categories on a consistent basis.
The domestic market is mature and structurally flat. Volume has moved within a narrow band between 6.28 million and 6.51 million units across the review period, and the forecast holds that pattern through 2030 with growth of only 0.72% annually. Value grows five times faster at 3.73%, driven by mix and price rather than transaction count, and average transaction price rises from USD 8,527 to USD 9,857. Price strength reflects scarcity rather than demand strength, which is the central analytical point of this report.
Export competition for inventory is the defining constraint. Used-vehicle exports exceeded 1.70 million units for the first time in 2025, and yen weakness has made Japanese stock unusually attractive to buyers across Russia, the Gulf, East Africa, Central Asia and Oceania. Because export buyers compete directly with domestic dealers at auction, the outflow raises acquisition costs across the domestic trade. Small and mid-sized retailers report the greatest difficulty, lacking the volume commitments that secure priority access to auction inventory.
Market Dynamics
Key Drivers
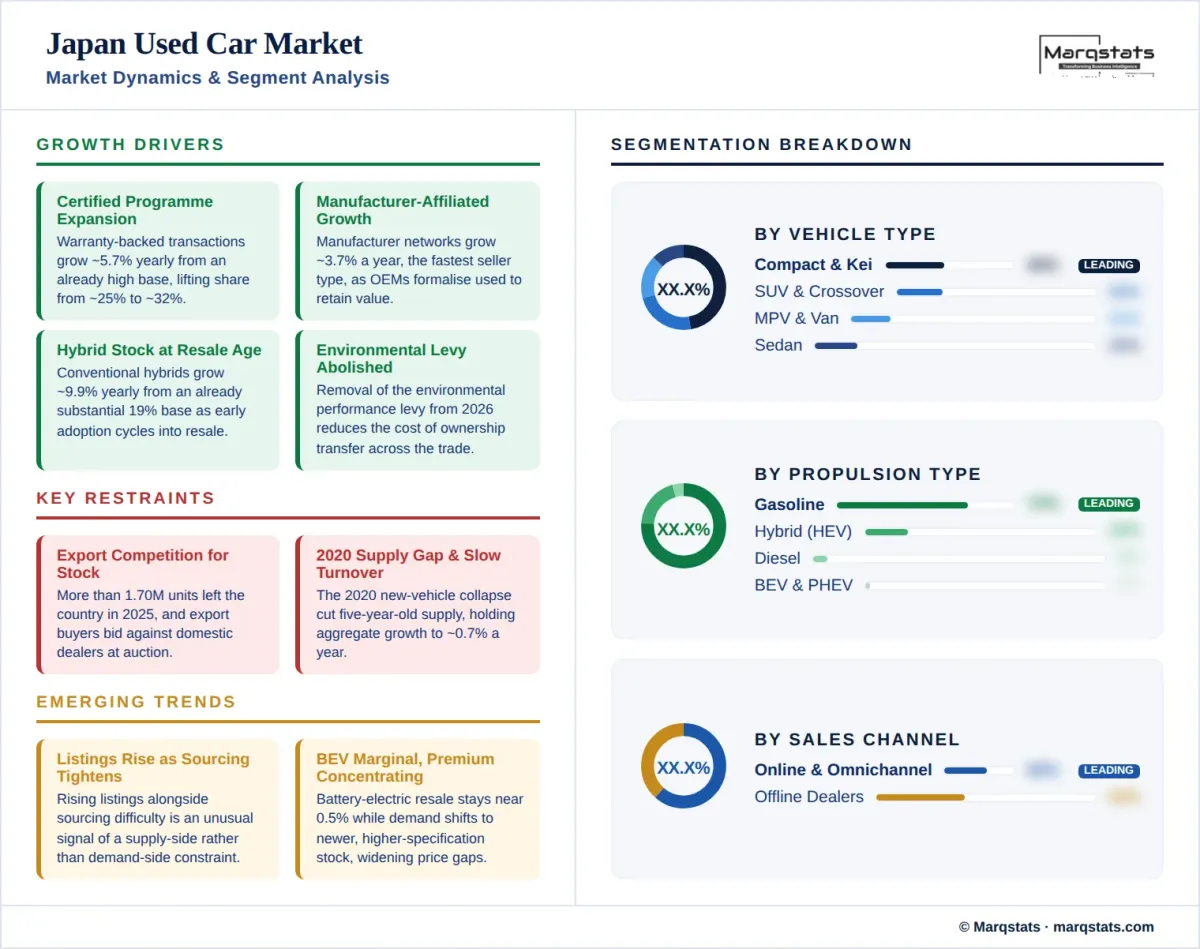
- Certified programme expansion grows at a 5.68% CAGR, lifting warranty-backed share from about 25% of volume to about 32% by 2030.
- Manufacturer-affiliated networks grow at a 3.71% CAGR, the fastest seller-type growth, as manufacturers formalise used operations to capture retained value.
- Hybrid stock reaches resale age in volume, with hybrid transactions growing at 9.85% annually from an already substantial 19% base.
- Online and omnichannel retail scales at a 4.66% CAGR from a 60% base, reaching about 73% of transactions by 2030.
- Vehicle taxation reform removed the environmental performance levy from 2026, reducing the cost of ownership transfer.
Key Restraints
- Export demand competes directly for domestic inventory, with more than 1.70 million units leaving the country in 2025.
- The 2020 collapse in new-vehicle sales structurally reduced the supply of five-year-old vehicles now reaching resale age.
- Aggregate volume growth is limited to a 0.72% CAGR, among the slowest in this study, as the domestic parc turns over slowly.
- Acquisition costs are rising across the trade, with small and mid-sized retailers least able to secure auction inventory.
Key Trends
- Listing volumes and sourcing difficulty are rising together, an unusual combination that indicates supply-side rather than demand-side constraint.
- Battery-electric resale remains marginal at about 0.5% of transactions, the lowest of any developed market covered in this study.
- Demand is concentrating in newer and higher-specification vehicles, widening the price gap against older stock.
- Auction houses retain central price-discovery authority that online retail entrants have not displaced.
Market Segmentation
Compact body styles account for about 46% of 2025 volume, the highest concentration of any market in this study and roughly ten percentage points above the European average. The share reflects Japan's light-vehicle category, which occupies about a third of new registrations and benefits from lower taxation, reduced parking requirements and dimensional advantages in dense urban environments. The segment contracts marginally at 1.00% annually to about 43% by 2030 as crossover demand grows, though it remains the dominant body style throughout.
SUVs and crossovers hold about 23% of 2025 volume and grow at a 5.57% CAGR, the fastest body-style growth in the market, reaching about 29% by 2030. Sedans account for about 15% of transactions and contract fastest of any body style at a negative 3.77% CAGR to about 13%, continuing a decline that began in new-vehicle sales more than a decade ago. MPV and minivan models hold about 10% of volume, a comparatively high share sustained by family demand and by the popularity of tall-wagon formats.
Gasoline accounts for about 74% of 2025 volume and contracts at a negative 3.36% CAGR to about 60% by 2030. Conventional hybrids hold about 19% of transactions, the highest hybrid share measured in any market in this study, and grow at 9.85% annually to about 30%. Japan's early and sustained domestic adoption of hybrid powertrains means the technology has been circulating in the secondary market for far longer than elsewhere, and buyer familiarity with hybrid battery longevity is correspondingly higher.
Battery-electric transfers grow from roughly 33 thousand units in 2025 to roughly 202 thousand by 2030, a 32.55% CAGR from the smallest base of any developed market covered, lifting share from about 0.5% to about 3%. Plug-in hybrids grow at 18.61% to about 2% of volume. Diesel holds about 5% of transactions and contracts fastest of any propulsion segment at a negative 7.41% CAGR. Japan's electrification path runs through hybrids rather than full electrification, and the used market reflects that choice more clearly than the new market does.
Independent dealers and professional retailers hold about 45% of 2025 volume, the largest seller channel, growing at a 2.02% CAGR to about 48% by 2030. Manufacturer-affiliated networks hold about 25% and grow fastest among seller types at 3.71% annually to about 29%, as manufacturers expand certified operations to retain value within their own networks. Certified and warranty-backed transactions grow at 5.68% annually from about 25% of the market to about 32%, a comparatively high base reflecting established inspection and disclosure standards.
Private sellers handle about 30% of 2025 transactions and contract at a negative 4.62% CAGR to about 23% by 2030. Japan's ownership transfer procedures require parking space certification, inspection compliance and documented deregistration, which raises the administrative burden of private-party sale relative to markets with simpler transfer processes. That friction, combined with strong consumer preference for inspected and warranted vehicles, continues to route volume toward professional channels.
Online and omnichannel transactions hold about 60% of 2025 volume and grow at a 4.66% CAGR to about 73% by 2030. Japanese listing platforms achieved scale early and provide standardised vehicle condition grading that buyers rely on in place of physical inspection. The auction system underpins this, since auction condition grades are published, widely understood and function as a common quality language across the trade, which makes remote purchase materially less risky than in markets without such standards.
Offline transactions hold about 40% of 2025 volume and decline at a negative 7.16% CAGR to about 27% by 2030, among the steeper channel contractions in this study. Physical sites retain their role in inspection compliance, trade-in appraisal and the administrative processing that Japanese ownership transfer requires. Auction houses remain structurally central as wholesale infrastructure rather than as retail channels, and their throughput determines pricing across both domestic retail and export.
Vehicles older than ten years account for about 30% of 2025 transactions and contract at a negative 0.67% CAGR to about 28% by 2030. Vehicles aged seven to ten years hold about 27% and grow at 0.72% annually. Together these cohorts represent about 57% of volume. Japan's mandatory periodic inspection regime imposes rising costs as vehicles age, which historically encouraged earlier replacement and fed the export channel, though vehicles are now being retained longer as replacement costs rise.
Vehicles up to three years old account for about 18% of 2025 volume and grow at a 1.81% CAGR to about 19% by 2030, while the four-to-six-year cohort holds about 25% and grows at 1.51%. The four-to-six-year band is the segment most affected by the 2020 new-vehicle collapse, since those vehicles were sold new during the period of sharpest decline. Recovery in this cohort depends on the stronger 2023 to 2025 new-vehicle years reaching resale age from 2028.
Transactions below USD 10,000 account for about 50% of 2025 volume and contract at a negative 2.32% CAGR to about 43% by 2030. The share reflects the weight of light vehicles and older stock in the transaction mix. The USD 10,001 to USD 20,000 band holds about 30% of transactions and grows at 1.38% annually. Together these bands carry about 80% of volume, which is why average transaction price sits at USD 8,527 despite Japan's income levels.
The USD 20,001 to USD 30,000 band grows at 5.21% annually from about 12% of volume to about 15%. Transactions above USD 30,000 grow at 7.11% annually, rising from about 8% of volume to about 11% and reaching USD 19.63 billion by 2030. Premium and luxury vehicles grow at 4.39% annually from about 15% of transactions to about 18%, supported by German marques that hold a durable position in the Japanese premium parc.
By Geography
Kanto & Greater Tokyo
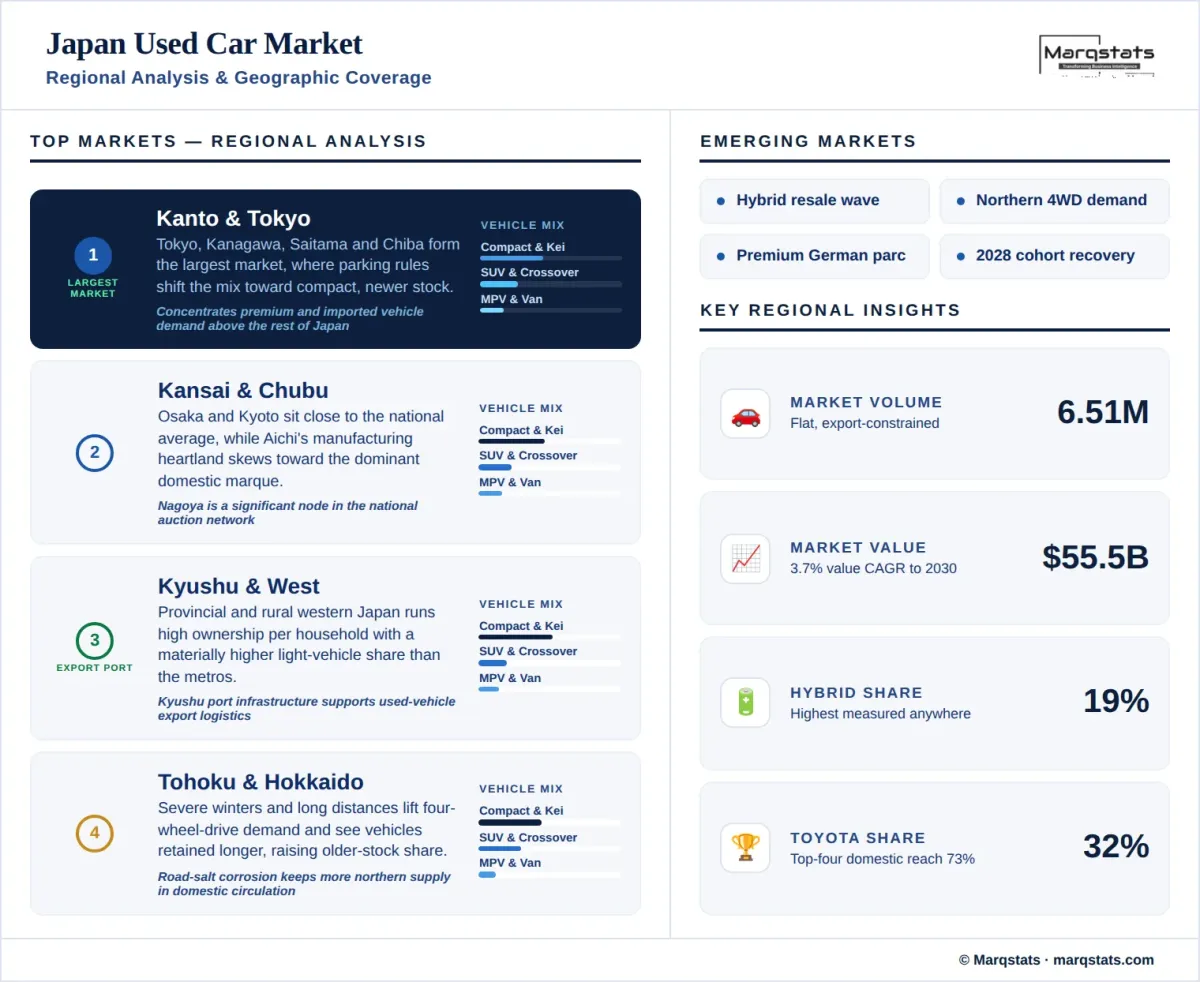
The Kanto region, encompassing Tokyo, Kanagawa, Saitama, Chiba, Ibaraki, Tochigi and Gunma, forms the largest regional market by both volume and value. Tokyo's parking space certification requirements and high parking costs suppress vehicle ownership per household relative to the rest of the country, which shifts the regional mix toward compact vehicles and toward newer stock purchased through professional channels. The region also concentrates premium and imported vehicle demand more heavily than anywhere else in Japan.
Kansai & Chubu
The Kansai region, centred on Osaka, Kyoto and Hyogo, forms the second-largest market with a mix close to the national average. Chubu, containing Aichi and the domestic automotive manufacturing heartland, records an unusually high concentration of the dominant domestic marque in both new and used stock, alongside dense dealer coverage and strong supplier employment. Nagoya and its surrounding prefectures function as a significant node in the national auction and wholesale network.
Kyushu, Chugoku & Shikoku
The western regions combine provincial cities with substantial rural populations where vehicle ownership per household runs well above the national average. Light vehicles hold a materially higher share of the regional mix than in the metropolitan centres, reflecting lower incomes, narrower rural roads and the absence of parking constraints. Kyushu's port infrastructure also gives the region a role in used-vehicle export logistics toward Asian and African destinations.
Tohoku & Hokkaido
Northern Japan sustains a distinct market shaped by severe winter conditions and long inter-city distances. Four-wheel-drive variants hold materially higher shares than the national average across both light vehicles and crossovers, and vehicles are retained longer, which raises the proportion of transactions involving older stock. Corrosion from road salt reduces the export attractiveness of northern vehicles, so a greater share of regional supply remains in domestic circulation than elsewhere in the country.
How Competition Is Evolving
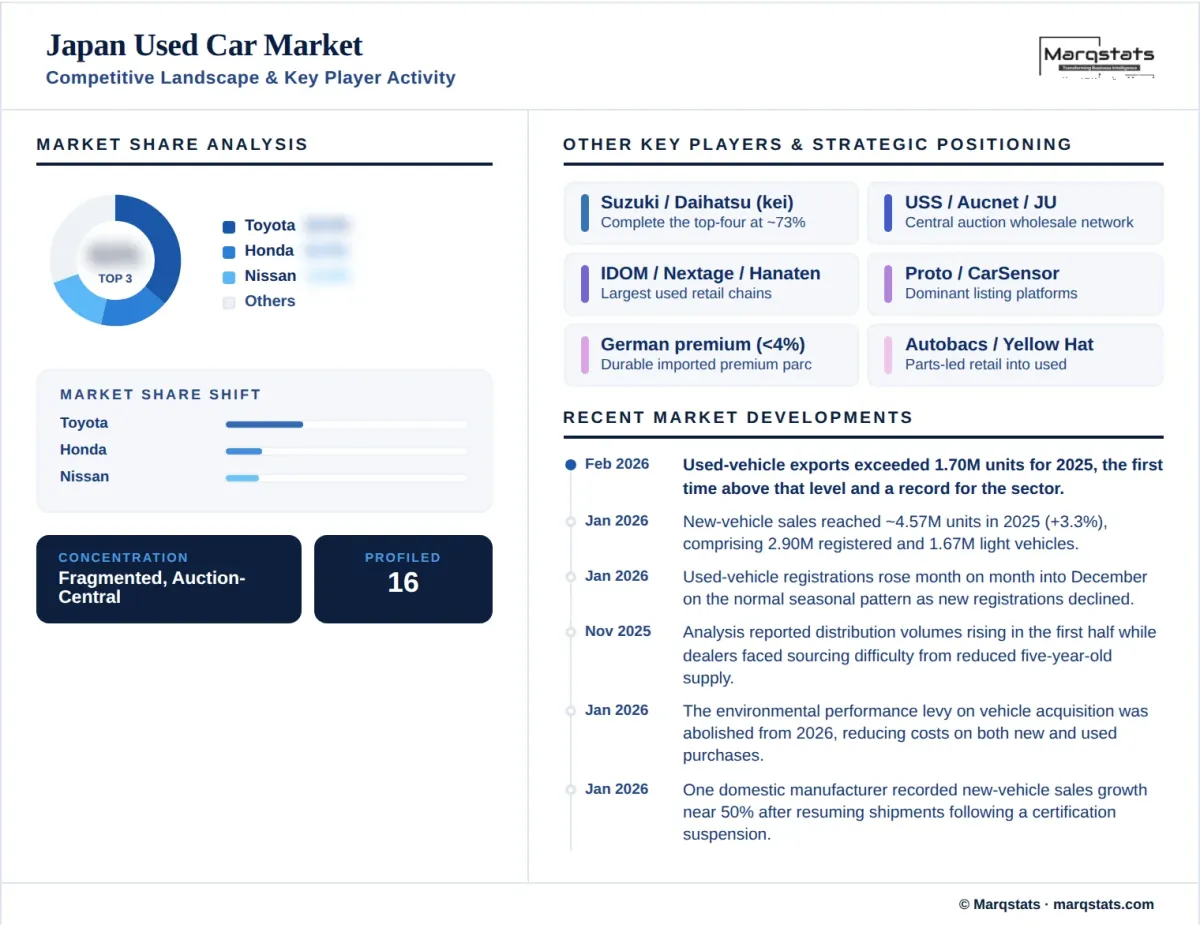
The Japan used car market is fragmented at retail level, with independent dealers and professional retailers holding about 45% of volume, manufacturer-affiliated networks about 25% and private sellers about 30%. No retailer controls more than a low single-digit share of transactions. The market is nonetheless highly formalised, with certified transactions at about 25% and standardised auction condition grading providing a common quality framework that few other markets possess.
Brand structure is the most domestically concentrated in this study. Toyota holds about 32% of used transactions, with Honda at about 15%, Nissan at about 14% and Suzuki at about 12%. The top four domestic marques together account for about 73% of the market. Foreign brands hold marginal positions outside the German premium marques, which together represent under 4% of transactions, and Chinese and Korean marques remain effectively immaterial in Japanese resale despite gains elsewhere in the region.
Auction houses occupy the structurally central position. Japan's auction network functions as the primary wholesale mechanism, the reference point for price discovery, and the venue where domestic retailers and export buyers compete directly for the same inventory. Published condition grading standards give auction data authority across the trade, and the largest operators handle throughput that no retail group approaches. This concentration of wholesale infrastructure is unusual and gives auction operators influence over domestic retail economics that exceeds their direct transaction share.
Competition centres on inventory access rather than on retail differentiation. With export buyers bidding against domestic dealers and the four-to-six-year cohort constrained by the 2020 supply gap, the operators in the strongest position are those with volume commitments securing auction priority, manufacturer trade-in flows, or direct consumer buying operations that intercept vehicles before auction. Retailers dependent on open auction purchase face the sharpest margin compression, and consolidation pressure falls hardest on small and mid-sized operators.
Companies Covered
The report profiles 16+ companies with full strategy and financials analysis, including:
Recent Market Activity
Table of Contents
Coverage & Segmentation
This report provides a comprehensive assessment of the Japan used car market across a 2025 base year, historical data from 2021 to 2025, and forecasts spanning 2026 to 2030. Market sizing is presented in unit-volume terms and complemented by value analysis in United States dollars converted from a yen base. Segmentation covers ten dimensions. The transaction layer counted combines registered passenger vehicles and light vehicles on a consistent basis, since Japanese statistics are published separately by two national associations and the two series must be reconciled before use.
The scope covers demand drivers, restraints and structural trends, with particular focus on export competition for domestic inventory, the 2020 supply gap and its effect on the four-to-six-year cohort, the light-vehicle category, hybrid dominance in resale, and the central role of the auction system. Regional context is available in the Asia-Pacific used car market report, where Japan functions as the region's export engine rather than a growth market.
Comparative benchmarking against the region's fastest-growing large market is available in the China used car market report. An extended forecast to 2035 is available under customization, alongside deeper cuts by prefecture, brand or channel on request.