Market Snapshot
Key Takeaways
Market Overview & Analysis
Report Summary
The Germany used car market comprises all passenger-car ownership transfers recorded within Germany in a calendar year, sold through original-equipment franchised networks, independent dealers and professional retailers, and direct private-party channels. This study segments demand by vehicle type, propulsion type, seller type, sales channel, vehicle age, vehicle mileage, price band, certification status, vehicle positioning, and brand, with a 2025 base year, historical coverage from 2021 to 2025, and forecasts to 2030. Sizing is presented in unit-volume terms and complemented by value analysis in United States dollars.
Definitional discipline matters in this market, as published estimates diverge sharply. Aggregate registration statistics covering all motor-vehicle classes exceed 7.6 million transfers annually, whereas the passenger-car-only series stands at 6.51 million. Value estimates diverge further, since a market sized on dealer retail listings captures a younger and more expensive subset of inventory and omits private sellers entirely. Marqstats sizes on the passenger-car transfer population and derives value as volume multiplied by blended transaction price, so the two metrics reconcile arithmetically at every segment level.
Supply is governed by parc turnover rather than demand. New-car registrations reached approximately 2.9 million units in 2025, a 1.4% increase, restoring the inflow that feeds near-new used supply three years forward. The 2020–2022 registration deficit continues to suppress availability in the four-to-six-year cohort on which certified programmes depend, and that cohort recovers progressively from 2027 as the stronger 2023–2025 registration years reach resale age.
The most consequential recent development is domestic rather than European. A federal purchase incentive of up to EUR 6,000 for new battery-electric cars took effect in January 2026, compressing the price gap between a subsidised new electric car and a one-to-three-year-old used equivalent to near parity. Dealers discounted used electric stock in response, and the median used battery-electric price fell to approximately EUR 29,700 in February 2026, a second consecutive month below the EUR 30,000 threshold and the lowest level recorded since 2024. The incentive therefore suppresses used electric residuals while used electric volume grows rapidly, a divergence specific to Germany.
Market Dynamics
Key Drivers
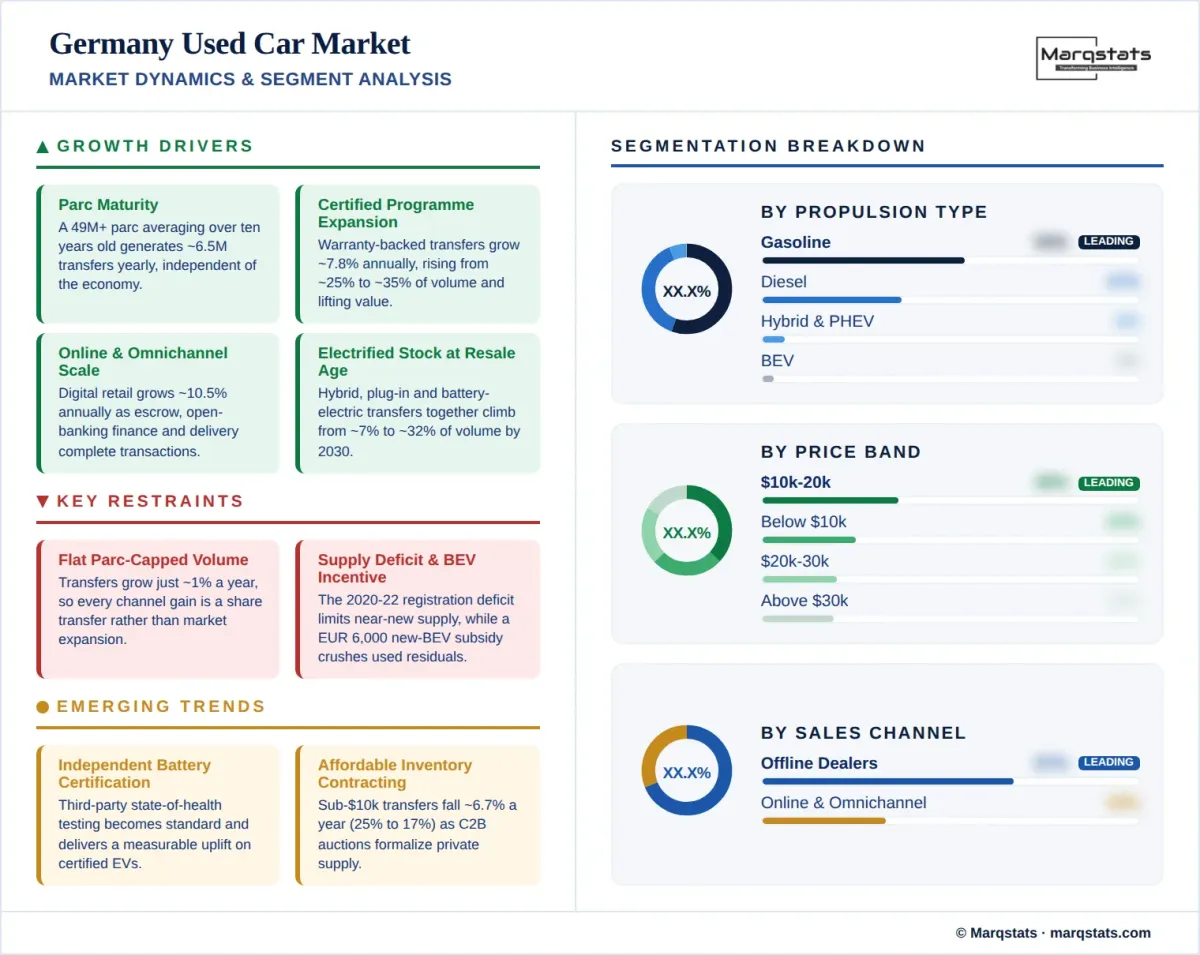
- Parc maturity sustains a structural transfer base, as a passenger-car parc above 49 million units at an average age exceeding ten years generates roughly 6.5 million ownership changes annually independent of economic cycle.
- Certified programme expansion lifts value per transaction, as warranty-backed transfers grow at a 7.80% CAGR and raise their share of volume from about 25% to about 35% by 2030.
- Online and omnichannel retail scales rapidly at a 10.52% CAGR, as marketplace operators integrate escrow payment, open-banking financing, and home delivery into complete transactions.
- Electrified supply reaches resale age in volume, as hybrid, plug-in hybrid, and battery-electric transfers together rise from about 7% of volume to about 32% by 2030.
- Franchised networks capture share from private sellers at a 3.72% CAGR, the fastest growth of any seller type, supported by manufacturer certified programmes and captive financing.
Key Restraints
- Aggregate volume is capped by parc turnover at a 1.02% CAGR, so every channel gain represents a share transfer rather than market expansion.
- The 2020–2022 registration deficit constrains near-new supply, limiting certified programme inventory until the four-to-six-year cohort recovers from 2027.
- New-car purchase incentives cannibalise used electric demand, as the EUR 6,000 federal subsidy introduced in January 2026 narrowed the new-to-used price gap to near parity.
- Battery valuation uncertainty suppresses electric residuals, as three-year battery-electric vehicles retain roughly 49% of list price against 61% to 63% for diesel and gasoline equivalents.
Key Trends
- Independent battery certification is becoming standard practice, as third-party state-of-health testing displaces manufacturer diagnostics readouts and delivers measurable price uplift on certified electric stock.
- Affordable inventory is contracting sharply, as transfers below USD 10,000 decline at a 6.73% CAGR and fall from about 25% of volume to about 17% by 2030.
- Consumer-to-business auction models formalise private supply, as digitised channels convert private-party inventory into professional dealer stock within 24 hours.
- Chinese marques remain marginal in resale at under 1% of transfers, lagging their new-registration share by a full ownership cycle.
Market Segmentation
SUV and crossover models account for about 30% of 2025 volume and grow at a 4.84% CAGR, the strongest of any body style, reaching about 35% of volume by 2030. The segment overtakes hatchbacks as the largest body type during the forecast period. Growth is attributed to the composition of new registrations between 2018 and 2024, when crossover derivatives displaced conventional hatchback and estate models across German mass-market ranges, and that mix is now flowing through into resale. Pickup trucks remain marginal at under 3% of volume, however they grow at 4.70% annually on demand from trades and rural households.
Hatchbacks hold about 32% of 2025 volume, the largest single share, however the segment contracts at 1.03% annually to about 29% by 2030. The decline reflects a shrinking supply of compact models entering resale age rather than weakening demand, as manufacturers withdrew entry-level hatchback nameplates from German ranges through the early 2020s. Sedans account for about 20% of volume and ease to about 19%, with demand concentrated in premium executive models where German manufacturers retain deep resale supply. MPV and minivan models hold about 9% and remain broadly flat.
Gasoline models hold about 55% of 2025 volume and decline at 3.94% annually to about 43% by 2030. Diesel contracts far faster, falling from about 37% of volume to about 24% at a negative 7.67% CAGR. Diesel decline is accelerated by low-emission zone enforcement across German urban centres, which suppresses resale demand for older diesel stock and compresses residual values relative to gasoline equivalents. Combustion models nonetheless retain roughly two-thirds of transfers at the end of the forecast period, reflecting the depth of the installed parc.
Battery-electric transfers grow from roughly 143 thousand units in 2025 to roughly 947 thousand units by 2030, a 33.73% CAGR and the fastest of any propulsion segment, lifting share from about 2% to about 14%. Supply is the governing variable, as Germany's battery-electric parc stood near 1.65 million units at the start of 2025 and each registration cohort adds resale inventory with a three-year lag. Hybrid models grow at 24.52% annually and plug-in hybrids at 29.24%, together reaching about 18% of volume by 2030. Hybrids benefit from the absence of battery-replacement anxiety that constrains full-electric resale, moreover they retain residual values closer to conventional gasoline models.
Independent dealers and professional retailers form the largest seller channel at about 42% of 2025 volume, growing at a 3.30% CAGR to about 47% by 2030. The channel includes digital-first operators that acquire inventory directly from private owners and remarket it through proprietary retail platforms. Franchised networks hold about 21% of volume and grow fastest among seller types at 3.72% annually, reaching about 24% by 2030 on the strength of manufacturer certified programmes. Certified and warranty-backed transfers across both channels grow at 7.80% annually, rising from about 25% of the total market to about 35%.
Private-seller transfers fall from about 37% of volume in 2025 to about 29% by 2030 at a negative 3.89% CAGR, the sharpest contraction of any seller type. The shift is structural rather than cyclical, as instant-valuation and direct-purchase services convert transactions that would previously have occurred between private parties into professional inventory. Consumer preference for warranty coverage, documented service history, and integrated financing continues to favour dealer channels, and the erosion is most pronounced in vehicles under seven years old where warranty value is highest.
Online and omnichannel transactions reach about 33% of 2025 volume and grow at a 10.52% CAGR, overtaking offline retail in 2030 when they account for about 53% of transfers. German marketplace operators have integrated escrow payment, open-banking financing, and home delivery, removing the friction that previously confined online activity to lead generation rather than transaction completion. Consumer-to-business auction channels launched over the review period allow private sellers to transact with verified dealers within 24 hours, converting private supply directly into professional inventory.
Offline transactions decline from about 67% of volume to about 47% by 2030 at a negative 6.11% CAGR, a loss of twenty percentage points of share across the forecast period. Physical forecourts retain relevance for older and lower-value inventory, for buyers requiring inspection before purchase, and for the servicing and financing attachment that follows the sale. The surviving network is consolidating around larger operators that combine physical presence with capable digital platforms, and smaller independent dealers remain the most exposed.
Vehicles up to three years old account for about 16% of 2025 volume and grow at a 4.49% CAGR to about 19% by 2030, while the four-to-six-year cohort holds about 22% and grows at 3.61% to about 25%. Both cohorts are supplied by registration years recovering from the pandemic-era deficit, and together they represent the inventory pool on which certified programmes and captive financing depend. The recovery of this supply from 2027 is the single most important variable for franchised dealer profitability across the forecast period.
Vehicles aged seven to ten years hold about 24% of volume and grow modestly at 1.85% annually. Vehicles older than ten years remain the largest single age cohort at about 38% of 2025 volume, however this cohort contracts at 3.08% annually to about 31% by 2030. Contraction is accelerated by European end-of-life vehicle rules, which restrict the export of non-roadworthy vehicles and channel older stock into authorised treatment facilities rather than third-country resale, removing a disposal route that historically absorbed substantial German volume.
Transfers below USD 10,000 fall from about 25% of 2025 volume to about 17% by 2030 at a negative 6.73% CAGR, the sharpest contraction of any price band and the market's most consequential affordability constraint. The USD 10,001 to USD 20,000 band remains the volume core at about 36% of transfers and holds roughly flat in unit terms while easing to about 34% of share. Together these bands still account for a majority of transactions at the end of the forecast period, however their combined share falls by ten percentage points.
The USD 20,001 to USD 30,000 band grows at 3.85% annually from about 20% of volume to about 23%, absorbing buyers displaced upward from the contracting entry tier. Transfers above USD 30,000 grow fastest at 7.34% annually, rising from about 19% of volume to about 26% and reaching USD 52.75 billion by 2030. This band drives the divergence between volume and value growth across the market, and its expansion mirrors the premium and luxury positioning segment, which grows at 2.64% annually against 0.49% for mass-market vehicles.
By Geography
North Rhine-Westphalia & Western Germany
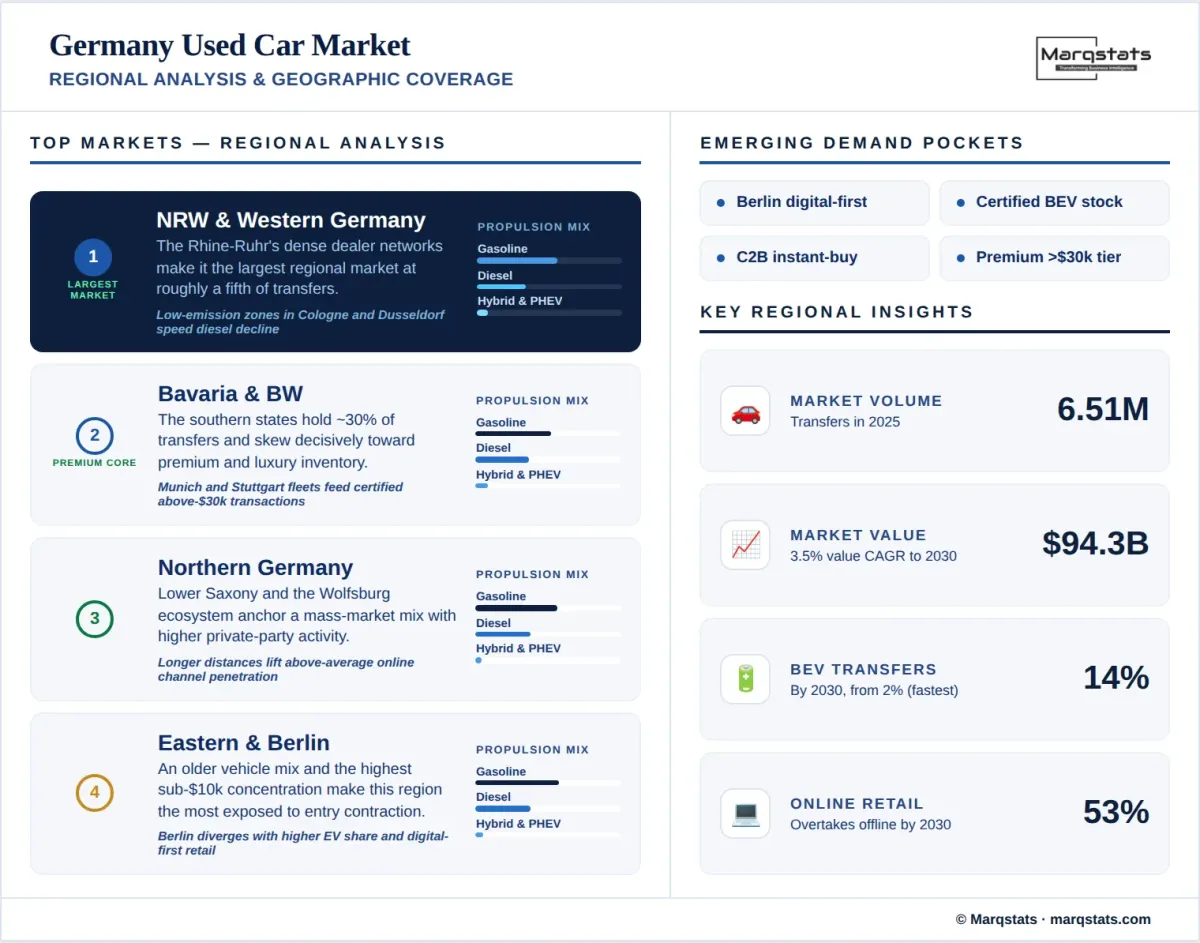
North Rhine-Westphalia forms the largest regional market, accounting for an estimated fifth of national transfers on the strength of a population above 17.9 million and the dense dealer networks of the Rhine-Ruhr conurbation. Low-emission zone enforcement across Cologne, Dusseldorf, and Essen suppresses resale demand for older diesel stock, accelerating the region's propulsion mix shift ahead of the national average. Rhineland-Palatinate and Saarland add further volume, with cross-border activity toward France, Luxembourg, and Belgium influencing pricing in the western border districts.
Bavaria & Baden-Wurttemberg
The southern states together account for an estimated three-tenths of transfers and skew decisively toward premium and luxury inventory. Bavaria concentrates manufacturer headquarters, captive finance operations, and corporate fleets in and around Munich, while Baden-Wurttemberg combines premium manufacturer presence in Stuttgart with a dense Mittelstand employer base that sustains company-car provision. Both states generate a steady flow of three-year fleet disposals into certified programmes, and both contribute disproportionately to transactions above USD 30,000. Stuttgart operates among the strictest low-emission zones in Germany.
Northern Germany
Lower Saxony anchors the northern market, supported by Wolfsburg and its associated supplier and captive-finance ecosystem. Together with Schleswig-Holstein, Hamburg, Bremen, and Mecklenburg-Western Pomerania, the northern states account for roughly a fifth of national volume. The regional mix is weighted toward mass-market vehicles and carries a higher proportion of private-party transactions than the southern states, reflecting lower average incomes outside the Hamburg metropolitan area and longer distances between dealer locations, which also supports above-average online channel penetration.
Eastern Germany & Berlin
Berlin, Brandenburg, Saxony, Saxony-Anhalt, and Thuringia together account for an estimated seventh of transfers. The eastern states carry an older vehicle mix and the highest concentration of transactions below USD 10,000, which makes the region the most exposed to the 6.73% annual contraction in entry-price inventory. Berlin diverges sharply from the surrounding states, combining lower car ownership per household with a higher share of electric and hybrid transfers and the densest concentration of digital-first retail activity outside the western conurbations.
How Competition Is Evolving
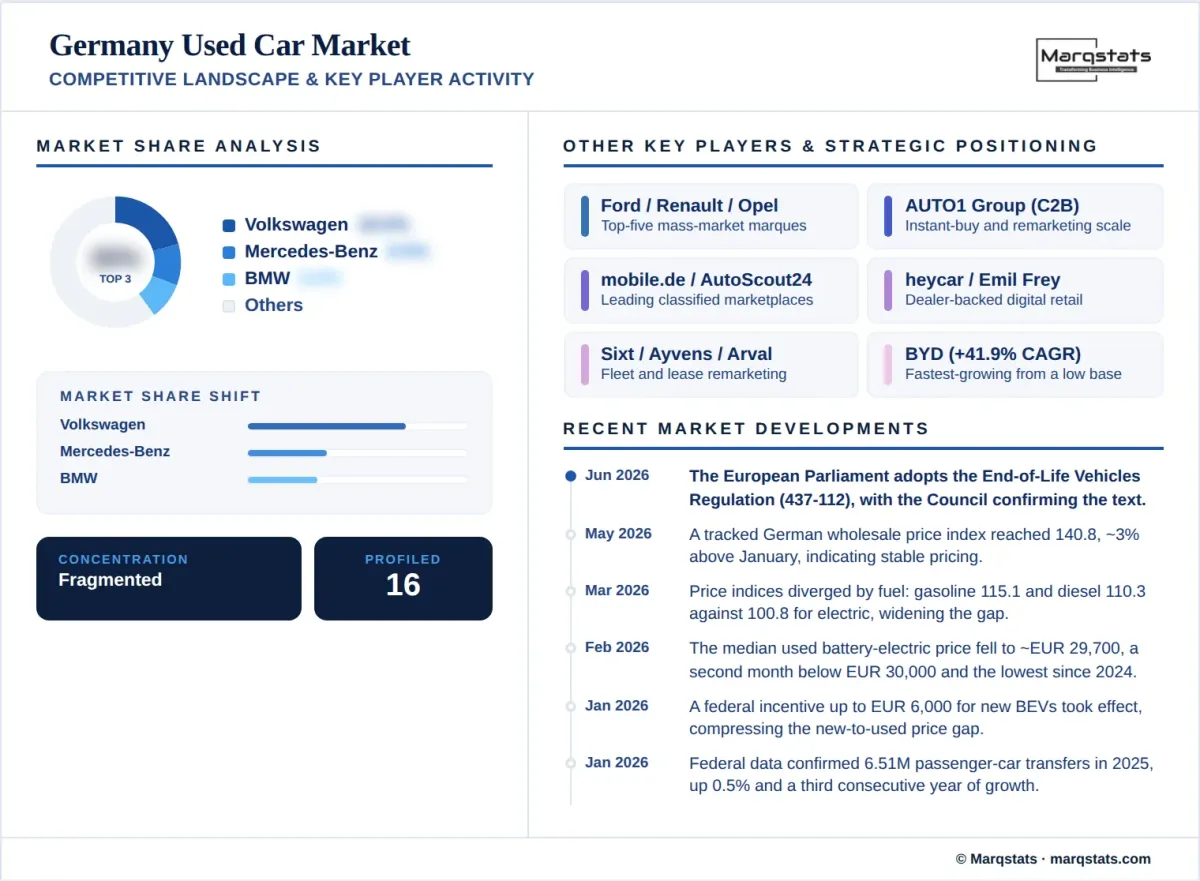
The Germany used car market is fragmented, and no operator controls more than a low single-digit share of annual transfers. Fragmentation is structural, as roughly 37% of 2025 volume moved directly between private parties and the remaining professional volume is distributed across several thousand independent dealers alongside franchised networks operating under manufacturer certified programmes. Concentration is nonetheless increasing at the margin, as digital-first operators and manufacturer-backed programmes absorb share from private sellers throughout the forecast period.
At brand level the market mirrors the new-car registrations of the preceding decade. Volkswagen leads with roughly 18% of transfers, ahead of Mercedes-Benz and BMW, and the top three marques together account for roughly a third of volume. Ford and Renault complete the top five. Brand share in the secondary market therefore lags new-registration share by five to eight years, which explains why Chinese marques remained under 1% of transfers through 2025 despite approaching 2% of new registrations. BYD grows fastest at a 41.87% CAGR from a very low base, reaching a low single-digit share by 2030.
Competition operates on three distinct layers. The first is inventory acquisition, where instant-valuation and direct-purchase services compete to intercept vehicles before they reach private-party listings. The second is marketplace liquidity, where classified platforms compete on listing depth and buyer traffic rather than on inventory ownership. The third is transaction monetisation, where financing attachment, warranty products, and delivery services determine profit per unit far more than vehicle margin alone. The financing layer has become the primary differentiator, as operators with securitised funding structures access wholesale capital at spreads that permit competitive consumer lending rates.
Manufacturer-backed certified programmes represent the countervailing force. Franchised networks grow transfers at 3.72% annually, the fastest of any seller type, using warranty backing and captive finance to defend the near-new segment. Extended producer responsibility obligations arriving under European end-of-life vehicle rules will require manufacturers to fund collection and treatment of vehicles across the bloc, strengthening the commercial case for proprietary buy-back programmes that capture vehicles before they reach independent wholesale channels.
Companies Covered
The report profiles 16+ companies with full strategy and financials analysis, including:
Recent Market Activity
Table of Contents
Coverage & Segmentation
This report provides a comprehensive assessment of the Germany used car market across a 2025 base year, historical data from 2021 to 2025, and forecasts spanning 2026 to 2030. Market sizing is presented in unit-volume terms and complemented by value analysis in United States dollars, with segmentation by vehicle type, propulsion type, seller type, sales channel, vehicle age, vehicle mileage, price band, certification status, vehicle positioning, and brand. The transaction layer counted is passenger-car ownership transfer as recorded by federal registration authorities, excluding commercial-vehicle, motorcycle, and trailer transfers, and excluding intra-company re-registrations that generate a registration event without an economic change of ownership.
The scope covers demand drivers, restraints, and structural trends, with particular focus on the January 2026 federal purchase incentive for new battery-electric cars and its effect on used electric residuals, low-emission zone enforcement and diesel decline, the recovery of near-new supply from 2027, the contraction of affordable inventory, and the European end-of-life vehicle rules confirmed by the Council of the European Union. An extended forecast to 2035 is available under customization for subscribers requiring a longer planning horizon, alongside deeper cuts by federal state, brand, or channel on request.
Comparative benchmarking is drawn from adjacent Marqstats coverage, including the United States used car market, which permits comparison of certified penetration, online channel share, and average transaction price against a market of similar maturity operating under different supply conditions.