Market Snapshot
Key Takeaways
Market Overview & Analysis
Report Summary
The India used car market comprises used passenger vehicle transactions recorded across all states and union territories in a calendar year, transacted through manufacturer-authorised certified programmes, organised digital retailers, independent dealers and brokers, and direct private-party channels. This study segments demand by vehicle type, propulsion type, seller type, sales channel, vehicle age, vehicle mileage, price band, certification status, vehicle positioning, and brand, with a 2025 base year, historical coverage from 2021 to 2025, and forecasts to 2030.
India publishes no single authoritative used-vehicle transaction series, and figures in circulation vary according to whether they count registered ownership transfers, organised retail sales, or total transactions including informal private-party trades. This report counts total transactions on the broadest basis. Readers comparing against organised-sector-only figures should expect a materially lower number, since roughly 45% of 2025 volume moved outside professional channels. Transaction volumes are cross-checked against registration transfer records and platform reporting.
The market trades roughly 1.3 used cars for every new passenger vehicle sold, against ratios above 2 across most mature markets. That gap is the source of the growth forecast. India's passenger vehicle parc has expanded rapidly over the past decade without a corresponding resale infrastructure, and the organised sector is now building the certification, financing and logistics capacity that converts parc growth into transaction volume. Growth here is a function of channel development rather than of parc expansion alone.
Body-type composition requires care, because the used market lags the new market by five to eight years. India's new-vehicle market crossed into majority sport-utility purchasing only recently, whereas industry retail reporting places used sport-utility share near 32% in 2025, up from about 15% in 2023 and 19% in 2024. Hatchbacks remain the volume core, and the most-traded used models in the country are consistently compact hatchbacks, with only one sport-utility model appearing in the top ten. Applying new-market mix to resale would materially overstate the sport-utility share.
Market Dynamics
Key Drivers
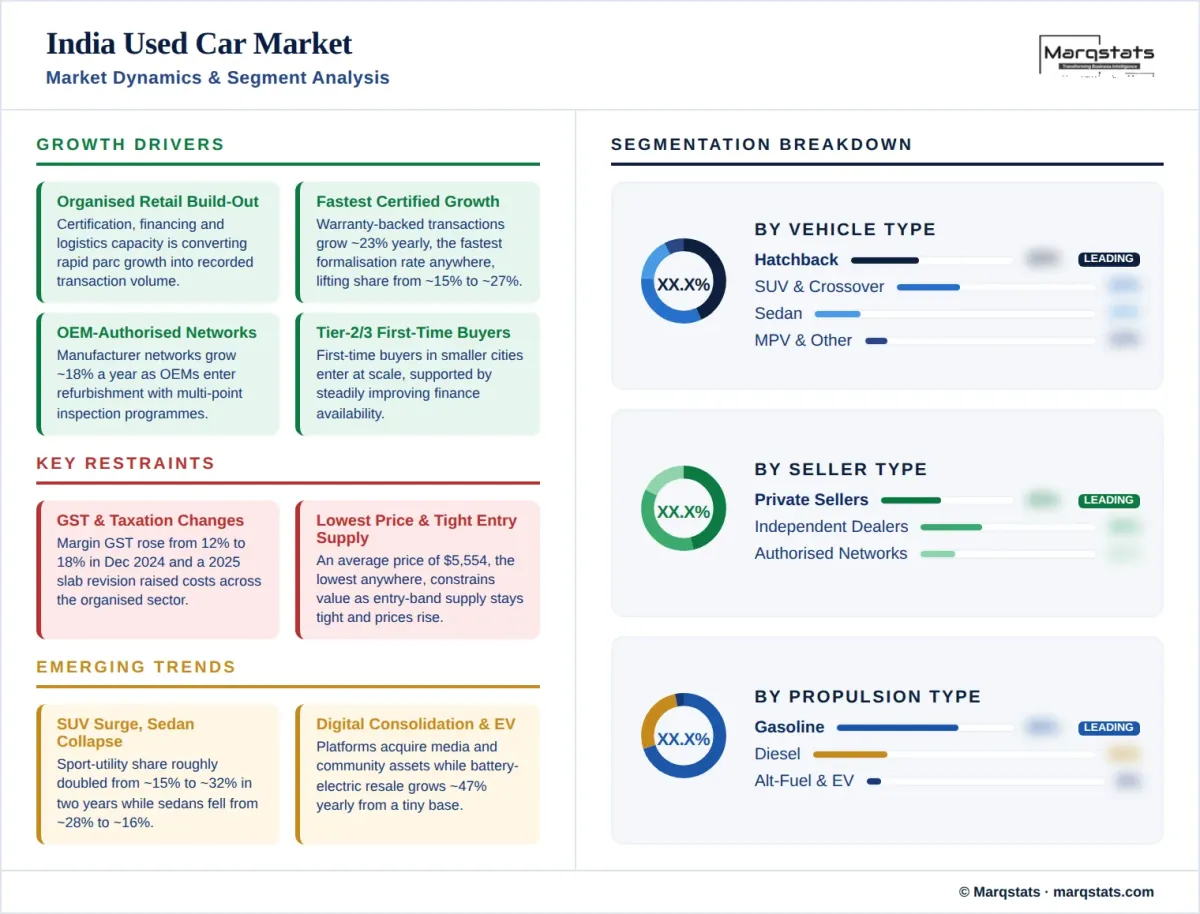
- Organised retail is building certification, financing and logistics capacity that converts parc growth into transaction volume.
- Certified programmes grow at a 22.95% CAGR, the fastest formalisation rate in this study, lifting warranty-backed share from about 15% to about 27% by 2030.
- Manufacturer-authorised networks grow at an 18.31% CAGR as original-equipment manufacturers enter refurbishment with multi-point inspection programmes.
- Digital and omnichannel retail scales at a 16.39% CAGR, reaching about 73% of transactions by 2030.
- First-time buyers in tier-two and tier-three cities are entering the market at scale, supported by improving finance availability.
Key Restraints
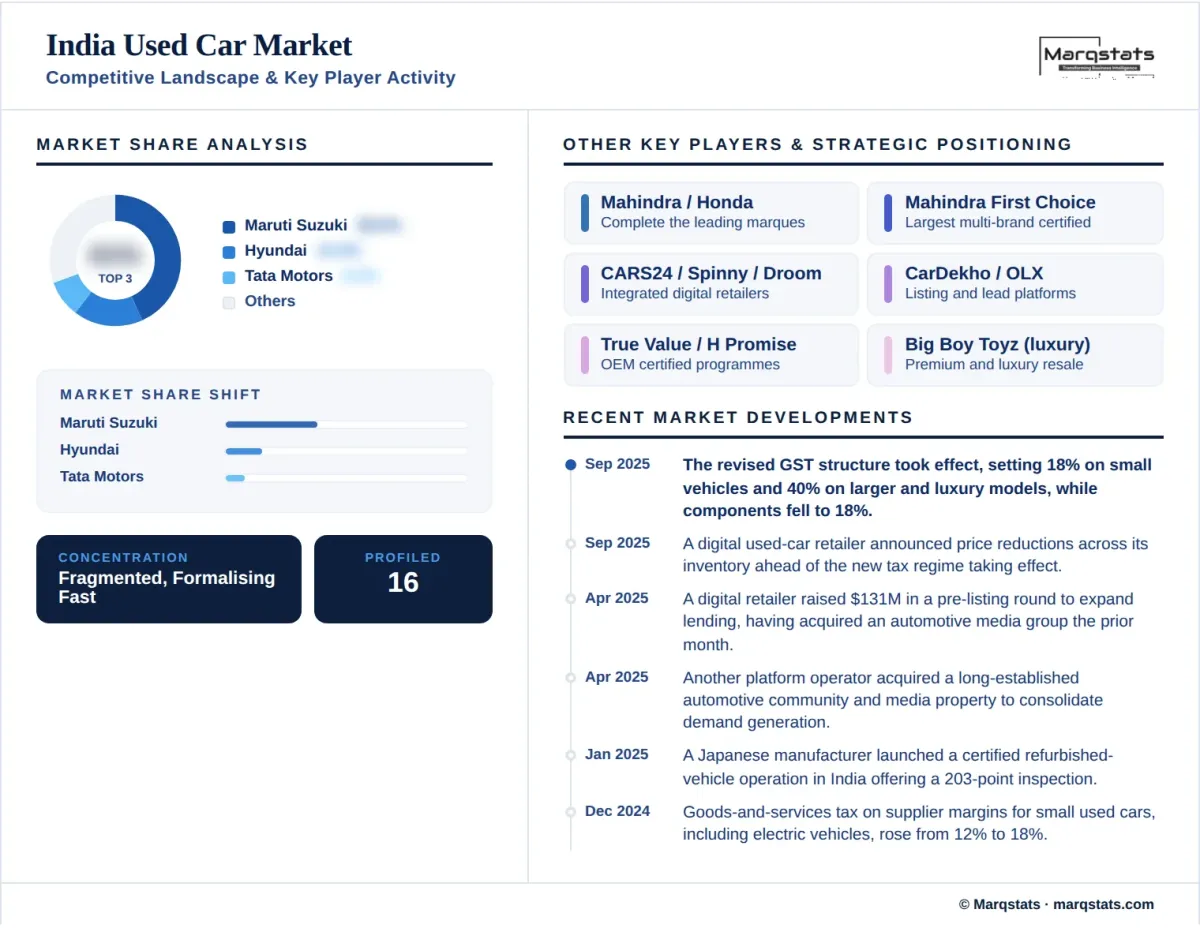
- Taxation changes raised costs across the organised sector, with goods and services tax on supplier margins rising from 12% to 18% in December 2024.
- Average transaction price of USD 5,554 is the lowest of any market covered, constraining value capture per unit.
- Supply is tight in the entry price band, with resale prices in the lower brackets rising materially year on year.
- Vehicle provenance and service history documentation remain inconsistent, raising inspection and warranty costs for organised retailers.
Key Trends
- Sport-utility share of used transactions roughly doubled in two years, from about 15% in 2023 to about 32% in 2025.
- Sedan share has collapsed over the same period, falling from about 28% to about 16% of transactions.
- Digital retailers are consolidating through acquisition, taking positions in automotive media and community platforms.
- Electrified resale is emerging from a very low base, with battery-electric transfers growing at a 47.40% CAGR.
Market Segmentation
Hatchbacks remain the volume core of the Indian used market, and the most-traded used models in the country are consistently compact hatchbacks, with the three highest-volume nameplates all falling in this category. Affordability, compact dimensions and deep parc penetration from the two largest manufacturers sustain the segment. Sedans have contracted sharply, falling from about 28% of transactions in 2023 to about 16% in 2025, a decline that mirrors the collapse of the segment in new-vehicle sales several years earlier.
Sport-utility and crossover share of used transactions reached about 32% in 2025, up from about 15% in 2023 and about 19% in 2024, a near-doubling in two years and the fastest body-style shift recorded in this study. The segment nonetheless remains under-represented relative to new-vehicle purchasing, because the sport-utility boom is still working through the resale cycle. Only one sport-utility model appears in the ten most-traded used vehicles. Compact sport-utility demand is strongest in tier-two and tier-three cities, where ground clearance and perceived value retention carry particular weight.
Gasoline accounts for about 68% of 2025 volume and grows at a 7.04% CAGR while falling to about 59% of share by 2030. Diesel holds about 26% of transactions and grows at 3.28% annually while falling to about 19% of share. Diesel's decline in resale follows its withdrawal from small-car segments after emissions standards tightened, though it retains a durable position in larger sport-utility and commercial-adjacent vehicles where running-cost economics still favour it.
Battery-electric transfers grow from roughly 41 thousand units in 2025 to roughly 475 thousand by 2030, a 47.40% CAGR and among the fastest electrification rates in this study, though from a very small base of about 0.7% of volume. Hybrids grow at 51.44% annually to about 7% of transactions. All electrified segments start from bases below 1%, and their expansion depends on the new-vehicle electrification of 2023 to 2027 reaching resale age. Alternative fuels, principally compressed natural gas, hold about 5% of transactions and grow at 25.17%.
Private sellers handle about 45% of 2025 transactions and hold roughly flat in absolute unit terms at a negative 0.22% CAGR, however their share falls to about 28% by 2030 because the market grows at 10.16% around them. This is the clearest illustration of formalisation in this study: the informal channel is not shrinking so much as being overtaken, with organised retail absorbing the entire volume increase and taking share on top of it.
Independent dealers and professional retailers hold about 35% of 2025 volume and grow at a 14.69% CAGR to about 43% by 2030. Manufacturer-authorised networks hold about 20% and grow at 18.31% annually to about 29%, the fastest seller-type growth recorded in this study. Certified and warranty-backed transactions grow at 22.95% annually from about 15% of the market to about 27%, supported by manufacturer refurbishment programmes offering multi-point inspection and by digital retailers building proprietary certification standards.
Online and omnichannel transactions hold about 55% of 2025 volume and grow at a 16.39% CAGR to about 73% by 2030. India's used-car market has developed alongside mobile commerce rather than before it, so platform-mediated discovery was the default from the outset. The largest operators combine listing, inspection, refurbishment, financing and delivery within integrated models, and several have raised substantial pre-listing capital and acquired automotive media and community assets to secure demand generation.
Offline transactions hold about 45% of 2025 volume and contract at a negative 1.00% CAGR in absolute terms, falling to about 27% of share by 2030. Physical presence retains importance for inspection, registration transfer processing and finance origination, particularly outside the metropolitan centres. Manufacturer certified programmes operate through franchised showroom networks, which gives the offline channel a durable role in the higher-value and warranty-backed segments even as its overall share declines.
Vehicles older than ten years account for about 31% of 2025 transactions and grow at only 1.62% annually, falling to about 21% of share by 2030 as newer stock enters the market. Vehicles aged seven to ten years hold about 27% and grow at 10.16%. The shift away from the oldest cohort reflects both organised retail's preference for newer, warrantable stock and the vehicle scrappage policy, which has begun removing the oldest vehicles from circulation.
Vehicles up to three years old account for about 14% of 2025 volume and grow fastest of any age cohort at a 17.99% CAGR to about 20% by 2030. The four-to-six-year cohort holds about 28% and grows at 13.10% to about 32%, becoming the largest single age band. Growth in both is driven by organised retailers, which require newer stock to support certification and warranty, and by the rapid expansion of India's new-vehicle market from 2021 onward now feeding into resale.
Transactions below USD 10,000 account for about 70% of 2025 volume, the highest entry-tier concentration of any market in this study, and grow at 4.46% annually while falling to about 54% of share by 2030. Industry retail reporting places the average used selling price near five and a half lakh rupees. The USD 10,001 to USD 20,000 band holds about 24% of transactions and grows at 17.16%. Supply is tight in the lower brackets, and resale prices in the entry bands have risen materially year on year.
The USD 20,001 to USD 30,000 band grows at 25.17% annually from about 4% of volume to about 8%. Transactions above USD 30,000 grow at 29.73% annually, the fastest price-band growth recorded in this study, rising from about 2% of volume to about 5% and reaching USD 11.94 billion by 2030. Premium and luxury vehicles grow at 21.31% annually from about 6% of transactions to about 10%, concentrated in the metropolitan markets where organised certified retail is most developed.
By Geography
North India
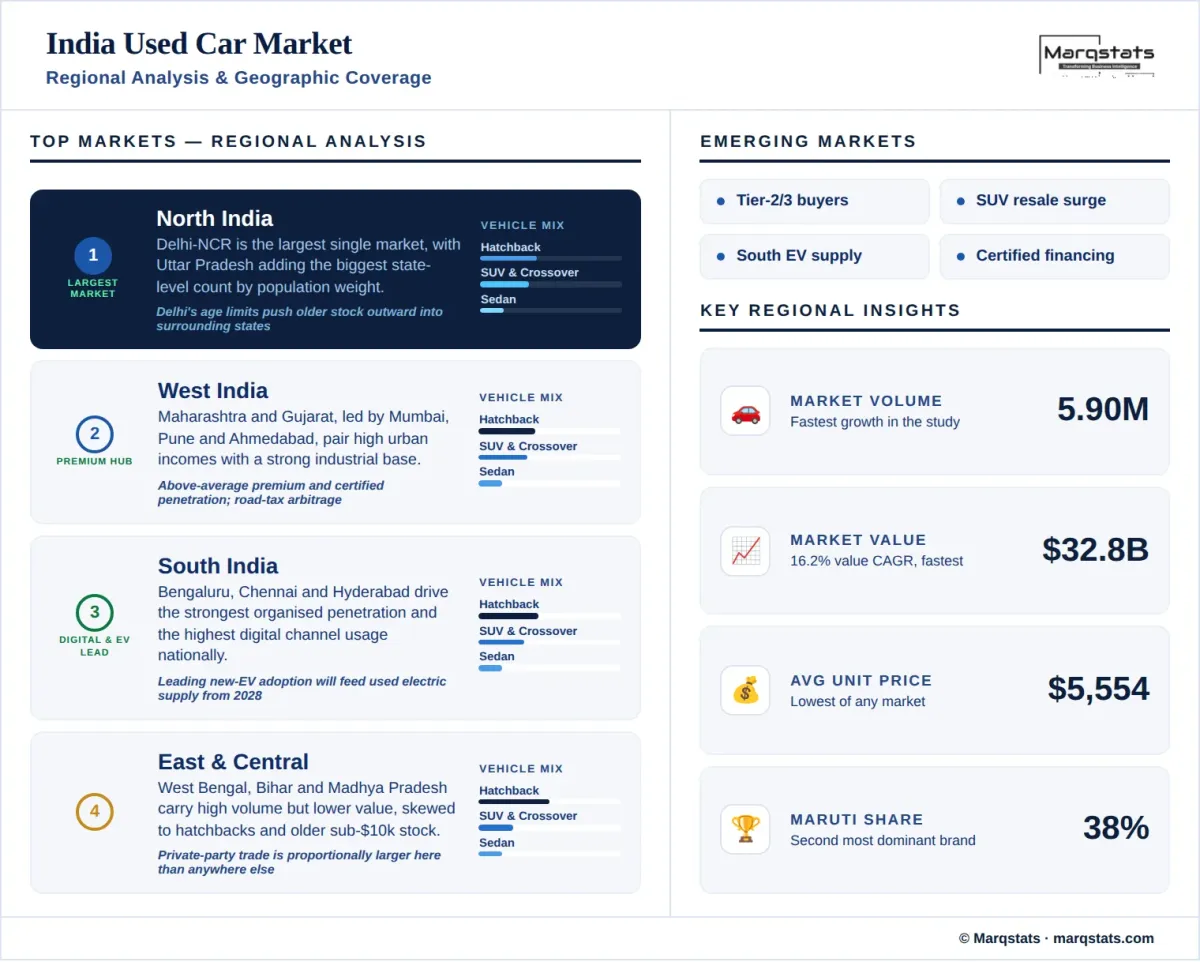
Delhi and the National Capital Region form the largest single regional market, combining high household incomes with the densest concentration of organised retail and certified programmes in the country. Punjab, Haryana, Uttar Pradesh and Rajasthan add substantial volume, with Uttar Pradesh contributing the largest state-level transaction count by population weight. Delhi's vehicle age restrictions, which bar older diesel and petrol vehicles from the capital, push a steady outflow of older stock into surrounding states.
West India
Maharashtra and Gujarat form the second-largest regional market by value, anchored by Mumbai, Pune and Ahmedabad. The region combines high urban incomes with a substantial industrial base and records above-average premium and certified penetration. Maharashtra's higher road tax rates influence registration patterns and create cross-border registration activity with neighbouring states, which affects the geography of recorded transfers relative to actual vehicle use.
South India
Karnataka, Tamil Nadu, Telangana, Andhra Pradesh and Kerala together form a large and comparatively affluent regional market. Bengaluru, Chennai and Hyderabad support strong organised retail penetration and the highest digital channel usage in the country. The southern states also show the strongest early adoption of electrified vehicles in new sales, which will feed a disproportionate share of the used electrified supply that reaches the market from 2028 onward.
East & Central India
West Bengal, Bihar, Odisha, Jharkhand, Madhya Pradesh and Chhattisgarh account for a substantial share of national transaction volume while contributing proportionally less value. The regional mix skews decisively toward hatchbacks, older vehicles and the sub-USD 10,000 price band, reflecting lower household incomes and thinner organised retail coverage outside Kolkata and the state capitals. Private-party transactions are proportionally more significant here than anywhere else in the country.
How Competition Is Evolving
The India used car market is fragmented and still substantially informal, with private sellers handling about 45% of 2025 volume, independent dealers and brokers about 35%, and manufacturer-authorised networks about 20%. No operator controls more than a low single-digit share of total transactions. Formalisation is nonetheless advancing faster here than in any other market covered in this study, and the organised sector is absorbing the entire volume increase while taking share from the informal channel simultaneously.
Brand structure is the second most concentrated in this study after Japan. Maruti Suzuki holds roughly 38% of used transactions, reflecting decades of dominance in new-vehicle sales and the depth of its parc across every price band. Hyundai follows at about 15%. Both operate their own certified used programmes, which gives them structural advantages in sourcing trade-ins and in converting first owners into repeat customers within their own networks.
Three operator types compete for the organised segment. Manufacturer-backed certified programmes leverage franchised showroom networks, trade-in flows and brand trust. Digital-first retailers combine inspection, refurbishment, financing and delivery within integrated models, and have raised substantial capital while acquiring automotive media and community assets to control demand generation upstream. Traditional independent dealers compete on local relationships, negotiating flexibility and lower overheads, though they face rising compliance and capital requirements.
Competition centres on sourcing and provenance rather than on retail pricing. With supply tight in the entry price bands and vehicle service history documentation inconsistent, the operators in the strongest position are those able to intercept vehicles at trade-in or through direct consumer purchase, and to verify provenance at scale. Refurbishment throughput and finance attachment determine profit per unit, and consolidation is expected as compliance costs and capital requirements pressure smaller brokers out of the organised segment.
Companies Covered
The report profiles 16+ companies with full strategy and financials analysis, including:
Recent Market Activity
Table of Contents
Coverage & Segmentation
This report provides a comprehensive assessment of the India used car market across a 2025 base year, historical data from 2021 to 2025, and forecasts spanning 2026 to 2030. Market sizing is presented in unit-volume terms and complemented by value analysis in United States dollars converted from a rupee base. Segmentation covers ten dimensions. The transaction layer counted is the total used passenger vehicle transaction including private-party sales, which is a materially wider measure than organised-sector retail volume.
The scope covers demand drivers, restraints and structural trends, with particular focus on the pace of formalisation, goods and services tax effects across two successive revisions, the lag between new-market and used-market body-type composition, entry-band supply tightness, and the emergence of electrified resale. Comparative benchmarking against the region's largest market is available in the China used car market report, which shares a low used-to-new ratio and a similarly platform-led channel structure.