Market Snapshot
Key Takeaways
Market Overview & Analysis
Report Summary
The Spain used car market comprises used passenger-car transactions recorded across the Spanish mainland, the Balearic and Canary Islands, and the autonomous cities, sold through manufacturer-franchised networks, independent dealers and professional retailers, digital operators, and direct private-party channels. This study segments demand by vehicle type, propulsion type, seller type, sales channel, vehicle age, vehicle mileage, price band, certification status, vehicle positioning, and brand, with a 2025 base year, historical coverage from 2021 to 2025, and forecasts to 2030. Sizing is presented in unit-volume terms and complemented by value analysis in United States dollars.
Two transaction bases circulate for Spain and readers should reconcile them before comparison. Trade association reporting placed the 2025 market above 2.21 million units on a transfer basis that includes certain dealer and inter-company operations. Marqstats sizes on a narrower 2.16 million base for consistency with the 2021 to 2025 historical series, a difference of roughly 2.5%. The two bases agree closely on structure, with diesel at 49% of transactions and vehicles over ten years old at 57.3% in both, so segment conclusions are unaffected. Electrified shares diverge more materially, as association reporting places used battery-electric penetration near 1.3% against 0.6% in this model, reflecting different treatment of hybrid categories.
Parc renewal is the market's structural problem and its principal commercial opportunity. Vehicles over ten years old represent 57.3% of transactions and grew 4.6% in 2025, while three-to-five-year models grew at double that rate from a far smaller base. Roughly one in four Spanish cars carries no environmental classification sticker, which restricts access to metropolitan low-emission zones and depresses residual values for the oldest cohorts. Both dealer associations have called for an effective scrappage incentive to accelerate removal of the oldest and most polluting vehicles, and a national renewal plan sits within the sustainable mobility legislation.
Supply carries a distinctly Spanish feature in rental de-fleeting. Spain operates one of the largest short-term rental fleets in Europe on the back of tourism across the Mediterranean coast and the islands, and buy-back cycles release large volumes of near-new vehicles into the secondary market on a seasonal rhythm. The dependence cuts both ways: when rental operations contracted about 11% in November 2025, total used sales fell 2.2% in the same month even as vehicles under five years old grew about 6%.
Market Dynamics
Key Drivers
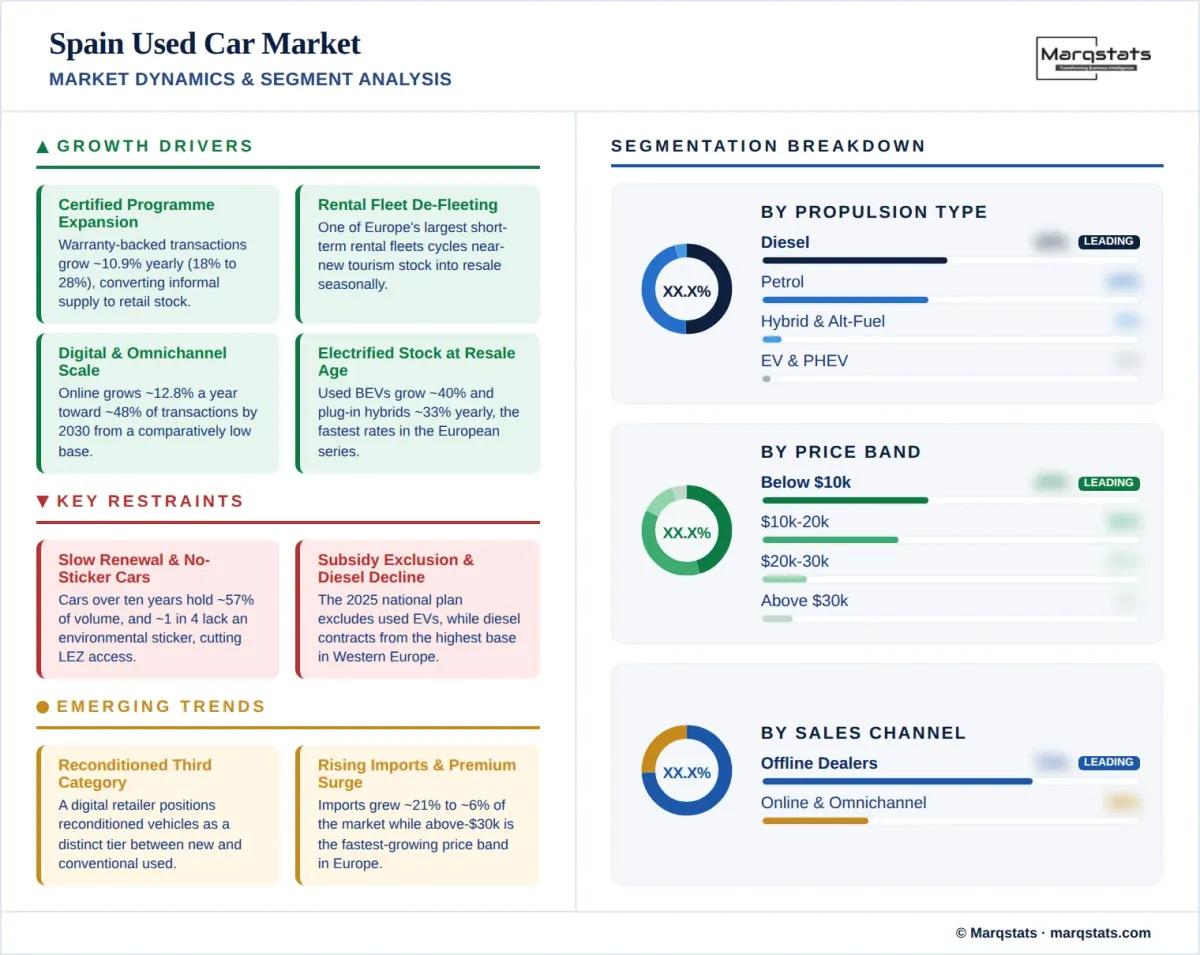
- Certified programme expansion grows at a 10.87% CAGR, lifting warranty-backed share from about 18% of volume to about 28% by 2030.
- Rental fleet de-fleeting releases near-new stock seasonally, as one of Europe's largest short-term rental fleets cycles vehicles back into the secondary market.
- Digital and omnichannel retail scales at a 12.80% CAGR, reaching about 48% of transactions by 2030 from a low base.
- Electrified stock reaches resale age from a very low base, with battery-electric transfers growing at 40.12% and plug-in hybrids at 33.48%, the fastest rates in the European series.
- Franchised networks grow fastest among seller types at a 5.23% CAGR, formalising supply through manufacturer-backed programmes.
Key Restraints
- The parc renews slowly, as vehicles over ten years old still represent about 57% of transactions and grew 4.6% in 2025.
- Roughly one in four Spanish cars carries no environmental classification sticker, restricting access to metropolitan low-emission zones and depressing residual values.
- Purchase incentives exclude used vehicles, as the national automotive plan announced in December 2025 restricted electric and plug-in hybrid support to new cars only.
- Diesel contracts at a negative 4.91% CAGR from the highest base in Western Europe, removing supply from roughly half the market.
Key Trends
- Reconditioned vehicles are being positioned as a distinct third category between new and conventional used stock.
- Imports are rising as a supply source, growing about 21% in 2025 to roughly 6% of the market.
- Premium transactions above USD 30,000 grow at 14.56% annually, the fastest price-band growth anywhere in the European series.
- Scrappage policy has moved to the centre of industry advocacy, with both dealer associations pressing for a national renewal scheme.
Market Segmentation
Hatchbacks account for about 42% of 2025 volume and grow marginally at 0.36% annually, easing to about 39% of share by 2030. The concentration reflects the dominance of superminis and lower-medium models in the Spanish parc, and the most-traded used models in the country are consistently from these segments. Sedans hold about 16% of volume, a higher share than in France or the United Kingdom, and contract slowly at 0.38% annually as the format retreats toward the premium tier.
SUV and crossover models hold about 24% of 2025 volume and grow at a 6.27% CAGR, the strongest of any body style, reaching about 29% by 2030. Penetration trails northern European levels because the Spanish parc renews slowly and crossover formats reached the domestic range later. MPV and minivan models retain about 10% of transfers, the highest share among the large European markets. Pickup trucks remain marginal at about 2% of volume while growing at 5.64% annually.
Diesel is the largest fuel type at about 49% of 2025 volume, the highest diesel concentration in Western Europe and above even the French equivalent. The segment contracts at a negative 4.91% CAGR to about 35% by 2030, a slower decline than in France or Italy because the Spanish parc is older and diesel stock remains in circulation longer. Petrol holds about 44% of volume and declines gently at 1.06% annually, overtaking diesel as the largest fuel type late in the forecast period. Alternative fuels retain about 2% of transfers.
Battery-electric transfers grow from roughly 13 thousand units in 2025 to roughly 143 thousand units by 2030, a 40.12% CAGR and the fastest growth rate of any segment across the European series, lifting share from about 0.6% to about 6%. Plug-in hybrids grow at 33.48% and hybrids at 27.12%. The starting base is the lowest in Western Europe because Spanish electric adoption began late, however new electrified registrations reached roughly 20% of the new market in 2025, which will feed the secondary market from 2027 onward. Association reporting places used battery-electric penetration somewhat higher than this model, and the difference reflects hybrid category treatment rather than a disagreement on direction.
Private sellers handle about 45% of 2025 transactions, the second-highest informal share in Western Europe after Italy. The concentration follows from the age profile, as the average vehicle sold privately in Spain exceeds fifteen years and rarely justifies professional reconditioning or warranty cover. The channel contracts at a negative 2.06% CAGR to about 37% by 2030, though it remains the largest single seller type until late in the forecast period, when independent professional retail overtakes it.
Independent dealers and professional retailers hold about 38% of 2025 volume and grow at a 4.44% CAGR to about 43% by 2030, becoming the largest seller channel during the forecast period. Franchised networks hold about 17% of volume and grow fastest among seller types at 5.23% annually to about 20% by 2030. Certified and warranty-backed transactions grow at 10.87% annually, rising from about 18% of the total market to about 28%, as manufacturer programmes and consolidated groups convert informal supply into warranted retail stock.
Offline transactions hold about 72% of 2025 volume and decline at a negative 4.69% CAGR to about 52% by 2030. As in Italy, online retail does not overtake offline within the forecast period. The persistence of physical transactions follows from the age and value profile of the traded fleet, as low-value older vehicles are more often inspected in person and transferred without financing, and from a dealer network that remains geographically dispersed across a large and unevenly populated territory.
Online and omnichannel transactions hold about 28% of 2025 volume and grow at a 12.80% CAGR, reaching about 48% of transfers by 2030. Spanish classifieds and marketplace platforms carry very large private-listing volumes that have historically generated leads rather than completed transactions, so the conversion opportunity is substantial. Operators combining reconditioning capacity with integrated financing and delivery have captured most of that conversion, and one has positioned reconditioned vehicles as a distinct commercial category between new and used.
Vehicles older than ten years account for about 57% of 2025 volume, the highest concentration in Western Europe, and contract only marginally at 0.73% annually to about 50% by 2030. The cohort grew 4.6% in 2025 in absolute terms, which illustrates how slowly the Spanish parc renews. Vehicles aged seven to ten years hold about 21% of volume. Together these cohorts represent roughly three-quarters of all transactions, which is the structural reason average transaction price sits below every comparable market.
Vehicles up to three years old account for about 9% of 2025 volume, the smallest near-new share among the large European markets, however they grow fastest of any age cohort at a 7.77% CAGR to about 12% by 2030. The four-to-six-year band holds about 13% and grows at 6.15%. Three-to-five-year models grew at roughly double the rate of the oldest cohort in 2025, and rental fleet buy-back cycles are the principal supply source for this segment, which makes near-new availability unusually sensitive to tourism demand.
Transfers below USD 10,000 account for about 44% of 2025 volume, the largest entry-tier concentration among the large European markets, and fall to about 36% by 2030 at a negative 2.16% CAGR. The USD 10,001 to USD 20,000 band holds about 36% of transactions and grows marginally at 0.76% annually. Together these bands represent about 80% of all transactions in 2025, a concentration that reflects both the age of the traded fleet and household purchasing power outside the largest metropolitan areas.
The USD 20,001 to USD 30,000 band grows at 6.47% annually from about 12% of volume to about 15%. Transfers above USD 30,000 grow at 14.56% annually, the fastest price-band growth anywhere in the European series, rising from about 8% of volume to about 15% and reaching USD 10.56 billion by 2030. Premium and luxury vehicles account for about 13% of transactions, the lowest premium share among the large European markets, so the expansion of the top price band is driven as much by inflation in near-new values as by a shift toward premium marques.
By Geography
Madrid & Central Spain
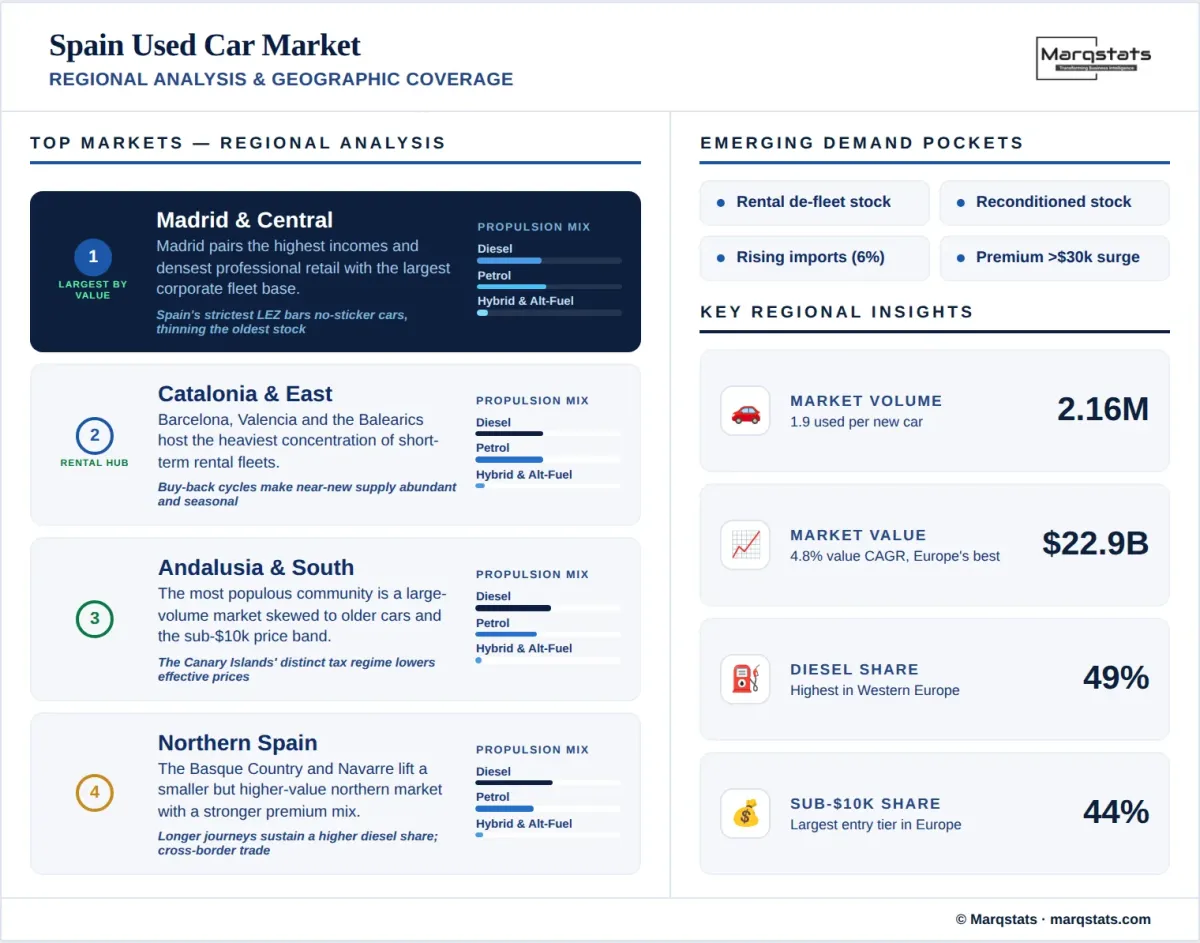
Madrid is the largest regional market by transaction value, combining the highest household incomes in the country with the densest professional retail network and the largest corporate fleet base. The metropolitan low-emission zone is the most restrictive in Spain and bars vehicles without an environmental classification sticker from central districts, which removes a disproportionate share of the oldest stock from local demand. Castile-La Mancha, Castile and Leon, and Extremadura complete the central regions with dispersed rural markets weighted toward older vehicles and private-party transactions.
Catalonia & the Mediterranean East
Catalonia is the second-largest regional market, anchored by Barcelona and its own restrictive low-emission zone. Together with Valencia, Murcia, Aragon, and the Balearic Islands, the eastern regions combine dense coastal population with the heaviest concentration of short-term rental fleets in mainland Spain. Rental buy-back cycles make near-new supply in this region more abundant and more seasonal than elsewhere, and the Balearics in particular show a pronounced autumn release of ex-rental stock.
Andalusia & the South
Andalusia is the most populous autonomous community and a substantial volume market, though transaction values run below the national average. The regional mix skews decisively toward vehicles over ten years old, the sub-USD 10,000 price band, and private-party transactions, reflecting lower household incomes and a thinner franchised network outside Seville and Malaga. The Canary Islands operate under a distinct indirect tax regime that lowers effective vehicle prices and sustains a large tourism-driven rental fleet, giving the islands pricing dynamics separate from the mainland.
Northern Spain
Galicia, Asturias, Cantabria, the Basque Country, Navarre, and La Rioja form a smaller yet higher-value northern market. Household incomes in the Basque Country and Navarre run above the national average, and the regional mix carries a higher premium and diesel share reflecting longer average journey distances and an industrial employment base. Proximity to the French border supports cross-border trade in the eastern Pyrenean provinces, and the region's dispersed settlement pattern gives digital channels above-average relevance.
How Competition Is Evolving
The Spain used car market is fragmented, and close to half of it operates outside professional retail. Private-party transactions accounted for about 45% of 2025 volume, and the remaining professional volume is distributed across franchised networks, regional dealer groups, digital-first retailers, and several thousand independent traders. No operator controls more than a low single-digit share. Concentration is increasing as certified programmes grow at 10.87% annually and consolidated groups acquire independent sites, however Spain remains among the most informal of the large European markets.
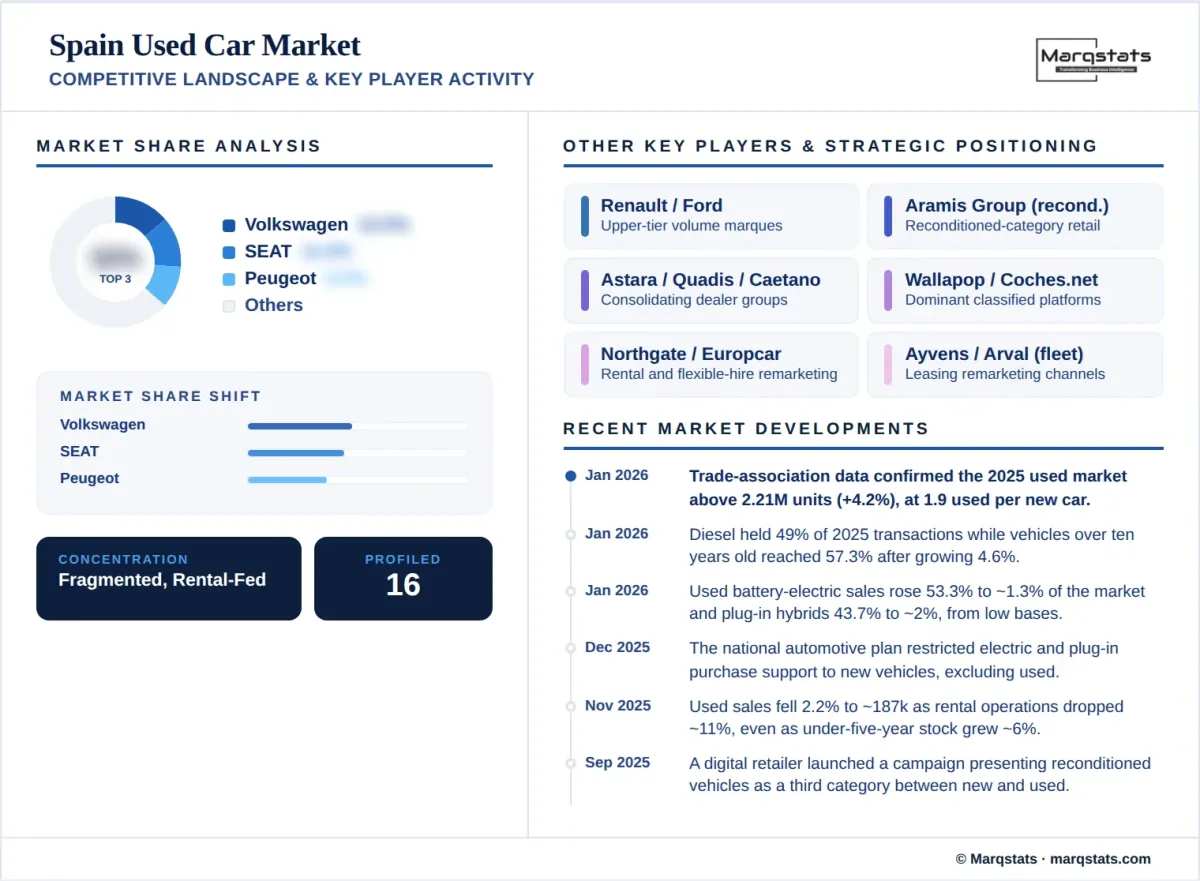
At brand level the market reflects both domestic manufacturing history and volume import brands. Volkswagen leads, closely followed by SEAT, the domestic marque whose long-running supermini and compact models are among the most-traded used cars in the country, and by Peugeot. Renault and Ford complete the upper tier. The ranking follows the composition of the ageing parc rather than current registration performance, and Chinese marques remain marginal in resale despite rapid gains in new registrations, lagging by a full ownership cycle.
A distinctly Spanish competitive layer sits in rental and flexible-hire remarketing. Operators serving tourism demand across the Mediterranean coast and the islands run some of the largest short-term fleets in Europe, and their buy-back and de-fleeting cycles supply a material share of near-new inventory. This gives rental groups and flexible-rental specialists direct influence over the availability and pricing of vehicles under three years old, a channel with no equivalent of comparable scale in Germany or the United Kingdom.
Competition otherwise centres on formalisation and reconditioning. Classifieds platforms already carry enormous private-listing volume, so professional operators compete on their ability to convert informal supply into warranted, financed retail stock. One digital retailer has gone further, positioning reconditioned vehicles as a distinct third category between new and used and campaigning publicly against the exclusion of used vehicles from national purchase incentives. Reconditioning throughput, warranty economics, and financing attachment determine profit per unit far more than vehicle margin alone.
Companies Covered
The report profiles 16+ companies with full strategy and financials analysis, including:
Recent Market Activity
Table of Contents
Coverage & Segmentation
This report provides a comprehensive assessment of the Spain used car market across a 2025 base year, historical data from 2021 to 2025, and forecasts spanning 2026 to 2030. Market sizing is presented in unit-volume terms and complemented by value analysis in United States dollars, with segmentation by vehicle type, propulsion type, seller type, sales channel, vehicle age, vehicle mileage, price band, certification status, vehicle positioning, and brand. The transaction layer counted is the used passenger-car transaction across the mainland, the Balearic and Canary Islands, and the autonomous cities, excluding commercial-vehicle and motorcycle transactions.
The scope covers demand drivers, restraints, and structural trends, with particular focus on the oldest traded fleet in Western Europe, the highest diesel concentration in the region, rental fleet de-fleeting as a near-new supply mechanism, environmental classification stickers and metropolitan low-emission zones, the exclusion of used vehicles from national purchase incentives, and the scrappage policy debate. Comparative benchmarking is drawn from adjacent Marqstats coverage, including the Italy used car market, the closest structural analogue to Spain in fleet age, informality, and channel maturity.
Further comparison is available against the France used car market, the other diesel-led market in the region. An extended forecast to 2035 is available under customization for subscribers requiring a longer planning horizon, alongside deeper cuts by autonomous community, brand, or channel on request.