Market Snapshot
Key Takeaways
Market Overview & Analysis
Report Summary
The Türkiye used car market comprises passenger-car ownership transfers recorded across all provinces in a calendar year, transacted through manufacturer-authorised networks, independent dealers and open galleries, digital platforms, and direct private-party channels. This study segments demand by vehicle type, propulsion type, seller type, sales channel, vehicle age, vehicle mileage, price band, certification status, vehicle positioning, and brand, with a 2025 base year, historical coverage from 2021 to 2025, and forecasts to 2030. Sizing is presented in unit-volume terms and complemented by value analysis in United States dollars.
One definitional point requires attention. This report counts passenger-car transfers only, at 7.57 million for 2025. Published commentary frequently cites a figure above 11 million, which includes vans, minibuses, motorcycles, trucks and other motor vehicle categories. The two are not comparable, and the wider figure should not be used as a passenger-car market size. A second caveat applies to the recent years: 2021 to 2023 are drawn from published transfer series while 2024 and 2025 are derived from national market totals, though the 2025 figure reconciles exactly with the published annual result.
Currency and inflation shape this market more than any other covered. Value figures are converted to United States dollars, and Turkish lira depreciation across the review period means dollar-denominated growth reflects exchange-rate movement alongside underlying price change. Unit volumes are unaffected, which is the principal reason this report is anchored on volume. In local terms, used prices rose about 15% during 2025 while transport inflation ran near 28%, so vehicles became cheaper in real terms and transaction volume rose accordingly.
The alternative-fuel segment is the market's most distinctive structural feature. Liquefied petroleum gas conversion is widespread across the Turkish parc, driven by fuel cost differentials, and these vehicles account for roughly a third of transfers. They also occupy the bottom of the price distribution, trading at roughly two-fifths of the average petrol vehicle price. The segment contracts at a negative 2.52% CAGR as newer stock arrives without conversion, and that decline is a significant contributor to rising average transaction price across the forecast period.
Market Dynamics
Key Drivers
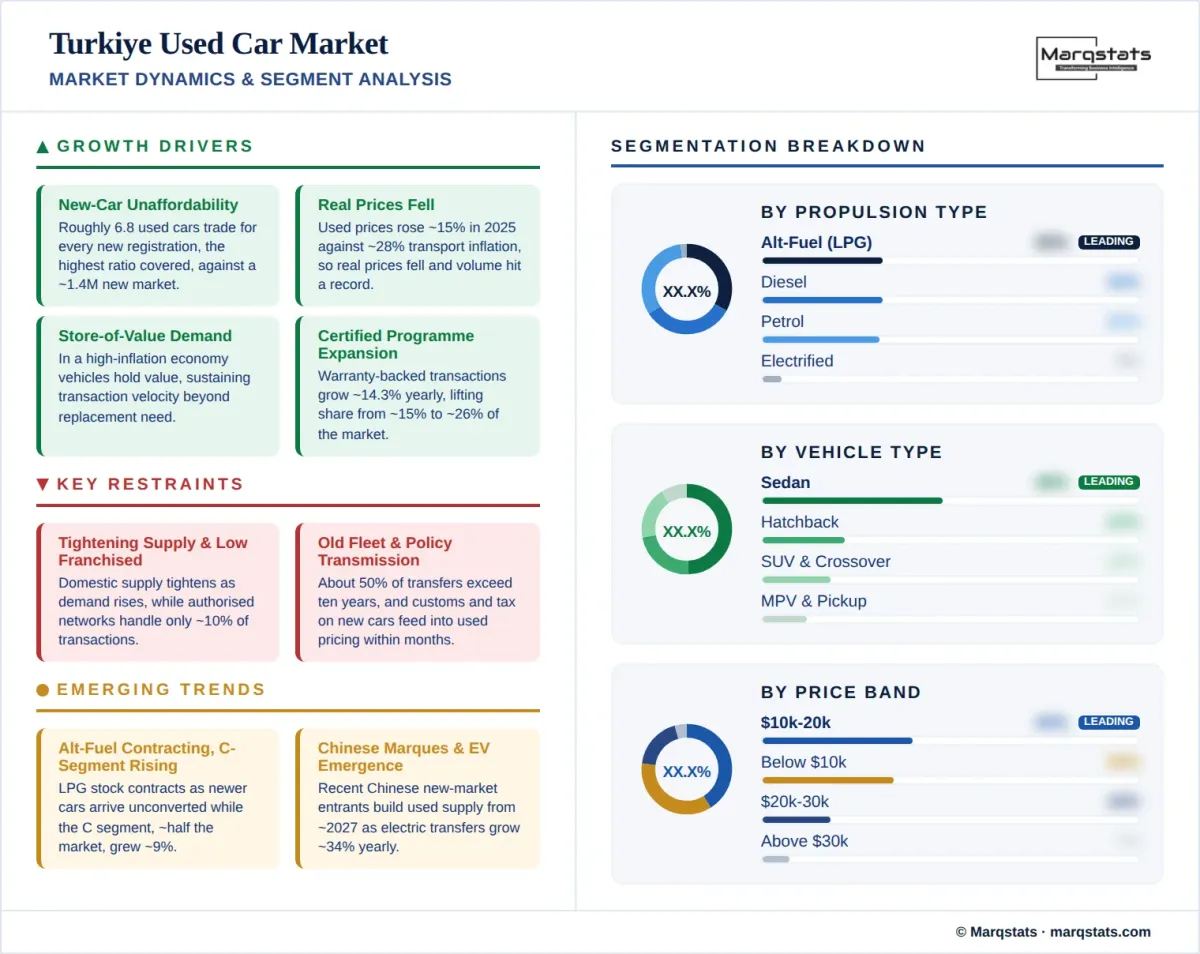
- New-car unaffordability redirects demand at scale, as roughly 6.8 used cars trade for every new registration against a new market of about 1.4 million units.
- Real used prices fell in 2025, rising about 15% against transport inflation near 28%, which lifted transaction volume to a record.
- Vehicles function as a store of value in a high-inflation economy, sustaining transaction velocity independently of replacement need.
- Certified programme expansion grows at a 14.29% CAGR, lifting warranty-backed share from about 15% of volume to about 26% by 2030.
- Digital and omnichannel retail scales at a 10.62% CAGR, reaching about 65% of transactions by 2030 from an already high base.
Key Restraints
- Domestic supply is tightening while demand rises, placing upward pressure on prices and constraining volume growth at the margin.
- Manufacturer-authorised networks handle only about 10% of transactions, leaving most of the market without warranty or structured financing.
- The traded fleet is old and high-mileage, with about 50% of transfers involving vehicles over ten years old and about 57% above 100 thousand kilometres.
- Customs and tax changes on new vehicles feed directly into used pricing, transmitting policy shifts into the secondary market within months.
Key Trends
- The alternative-fuel segment is contracting at a negative 2.52% CAGR as newer stock arrives without liquefied petroleum gas conversion.
- Chinese marques are expected to build substantial used supply over the forecast period as recent new-market entries reach resale age.
- Demand concentrates in the C segment, which accounts for roughly half the market and grew about 9% year on year in early 2026.
- Electrified stock is emerging from a very low base, with battery-electric transfers growing at a 34.01% CAGR.
Market Segmentation
Sedans account for about 48% of 2025 volume, the highest sedan concentration of any market in this series and more than double the German or British equivalent. The segment grows at a 2.20% CAGR and holds about 46% of volume by 2030. The dominance reflects domestic manufacturing, as the highest-volume models in the country are C-segment saloons produced in Türkiye, and the C segment alone accounts for roughly half of all used transactions. Consumer preference for saloon body styles has proved durable even as crossovers gained ground elsewhere in Europe.
Hatchbacks hold about 22% of 2025 volume and remain flat in unit terms while easing to about 19% of share by 2030, supported by B-segment models that dominate entry-level demand. SUV and crossover models account for about 18% of transactions, the lowest crossover share in this series, however they grow fastest of any body style at an 8.56% CAGR to about 24% by 2030 as the format finally reaches resale age in volume. Pickup trucks hold about 3% and grow at 6.25% annually.
Alternative fuels, principally liquefied petroleum gas, account for about 32% of 2025 volume, a concentration with no parallel in Europe and a direct consequence of widespread aftermarket conversion driven by fuel cost differentials. These vehicles occupy the bottom of the price distribution, trading at roughly two-fifths of the average petrol vehicle price. The segment contracts at a negative 2.52% CAGR to about 24% by 2030. Diesel holds about 32% of transfers and contracts at a negative 2.00% CAGR, while petrol holds about 31% and grows marginally at 0.98%.
Battery-electric transfers grow from roughly 114 thousand units in 2025 to roughly 704 thousand by 2030, a 34.01% CAGR that lifts share from about 2% to about 8%. Hybrids grow at 27.04% annually to about 12% of volume and plug-in hybrids at 35.65% to about 3%. All three start from among the smallest bases in this series. Electrified vehicles occupy the top of the price distribution, with electric models trading at roughly three times the average petrol price, so their expansion is a significant contributor to value growth even at modest volume shares.
Private sellers handle about 55% of 2025 transactions, the third-highest informal share in this series after Russia and Poland. Much of this volume moves through classified platforms and open galleries rather than professional premises. The channel contracts only marginally at a negative 0.16% CAGR to about 47% by 2030, remaining the dominant seller type throughout the forecast period. Its persistence reflects both the age profile of the traded fleet and the limited reach of manufacturer-authorised networks outside the largest cities.
Independent dealers and professional retailers hold about 35% of 2025 volume and grow at a 5.83% CAGR to about 40% by 2030. Manufacturer-authorised networks handle only about 10% of transactions, among the lowest franchised shares in this series, however they grow fastest of any seller type at an 8.47% CAGR to about 13% by 2030. Certified and warranty-backed transactions grow at 14.29% annually from about 15% of the total to about 26%, one of the faster formalisation rates covered.
Online and omnichannel transactions hold about 45% of 2025 volume and grow at a 10.62% CAGR to about 65% by 2030. Türkiye has among the highest digital penetration in this series despite a predominantly informal seller structure, because domestic classified platforms achieved very large scale early and handle the majority of private listings. Instant-valuation and direct-purchase services have extended from listing into transaction, and vehicle history verification has become central given the age and provenance profile of much of the stock.
Offline transactions hold about 55% of 2025 volume and decline at a negative 6.18% CAGR to about 35% by 2030. The offline channel spans a wide range of formats, from authorised showrooms through independent premises to open galleries that remain significant across smaller provinces. Consolidation is advancing among the larger dealer and rental groups, and manufacturer-backed used programmes are expanding their physical footprint from the metropolitan centres outward.
Vehicles older than ten years account for about 50% of 2025 transactions and grow at a 1.19% CAGR, easing to about 46% of share by 2030 while still rising in unit terms. Vehicles aged seven to ten years hold about 20% and grow at 3.47% annually. Together these cohorts represent about 70% of the market. Brand-level data underlines the point: more than 60% of transactions for the two most-traded marques involve vehicles over ten years old, confirming that the older fleet is the market's engine rather than its residual.
Vehicles up to three years old account for about 15% of 2025 volume and grow at a 5.64% CAGR to about 17% by 2030, with the four-to-six-year cohort holding an identical 15% and growing at the same rate. The symmetry between these cohorts is unusual and reflects a market where near-new supply is constrained by a small new-car base relative to transaction volume. Their expansion depends on new-car registrations recovering, and on Chinese marques that entered recently reaching resale age from around 2027.
Transactions below USD 10,000 account for about 35% of 2025 volume and ease to about 28% by 2030 at a negative 1.52% CAGR, a far gentler contraction than in Western European markets because the alternative-fuel and older-vehicle segments that populate this tier remain substantial. The USD 10,001 to USD 20,000 band is the volume core at about 40% of transactions and grows at 2.02% annually. Together these bands represent about 75% of all transactions in 2025.
The USD 20,001 to USD 30,000 band grows at 6.25% annually from about 18% of volume to about 21%. Transactions above USD 30,000 grow at 15.66% annually, the second fastest price-band growth in this series, rising from about 7% of volume to about 13% and reaching USD 37.35 billion by 2030. Growth is driven by electrified stock entering resale at the top of the price distribution and by the SUV segment reaching resale age, and premium and luxury vehicles rise from about 12% to about 14% of transfers.
By Geography
Marmara Region
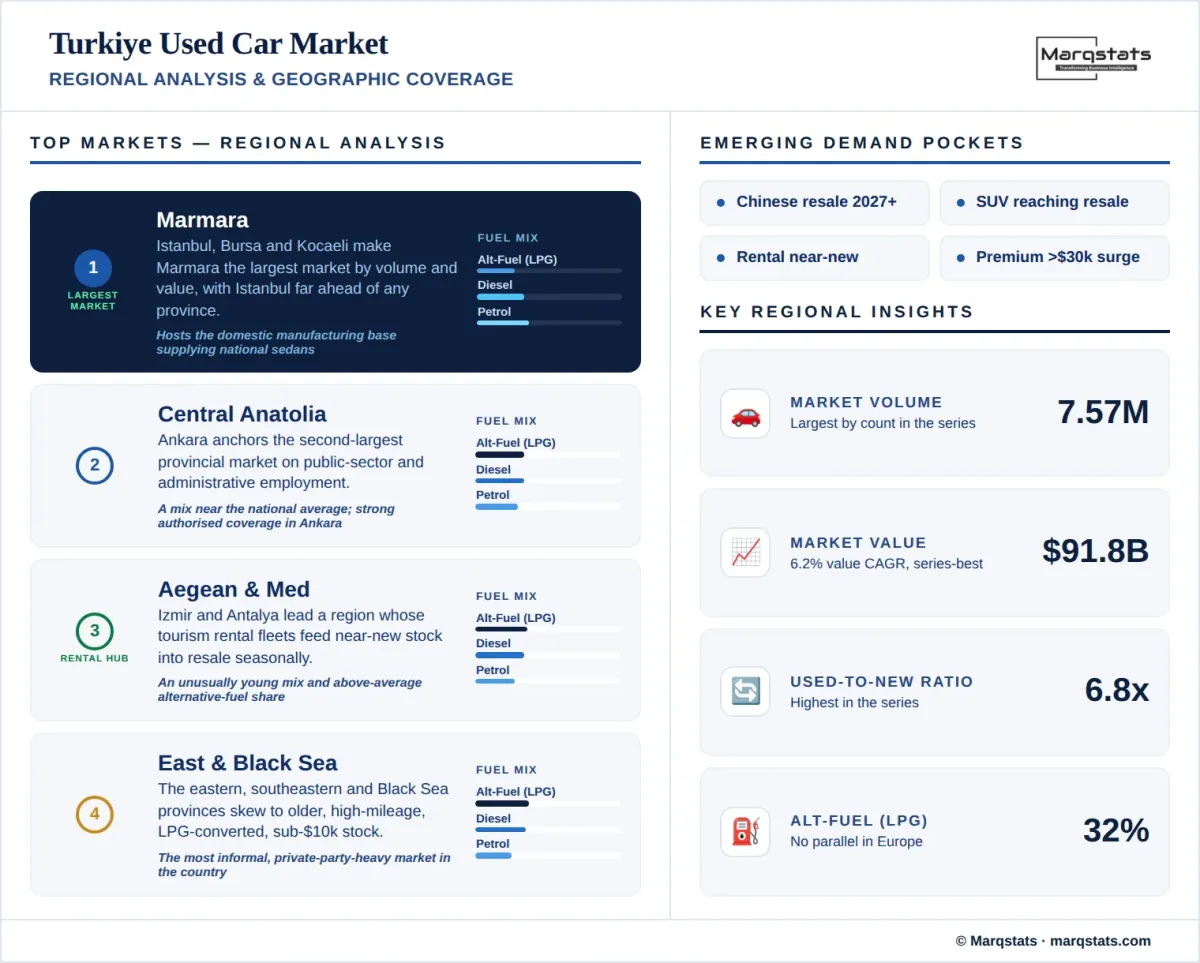
The Marmara region, containing İstanbul, Bursa, Kocaeli, and Tekirdağ, forms the largest regional market by both volume and value. İstanbul alone records more used car transfers than any other province by a wide margin. The region concentrates the highest household incomes, the densest authorised dealer networks, and the largest corporate fleet base, and it carries a disproportionate share of transactions above USD 20,000. Bursa and Kocaeli also host the domestic automotive manufacturing base that supplies the sedan models dominating national resale.
Central Anatolia
Ankara anchors central Anatolia and forms the second-largest single provincial market, supported by public sector employment and a substantial administrative economy. Konya and Kayseri add significant provincial volume with a mix weighted toward older vehicles and alternative-fuel conversions. The regional mix sits close to the national average across body type and price band, and authorised network coverage is strong in Ankara while thinning materially across the surrounding provinces.
Aegean & Mediterranean
İzmir and Antalya lead this region, with Adana and Mersin adding substantial volume. Antalya's tourism economy sustains a large rental fleet whose disposal cycles feed near-new stock into the secondary market on a seasonal rhythm, giving the region an unusually young mix relative to national norms. İzmir combines industrial employment with high vehicle ownership, and the Mediterranean provinces show above-average alternative-fuel penetration reflecting longer average journey distances.
Eastern, Southeastern & Black Sea Anatolia
The eastern, southeastern, and Black Sea provinces together account for a substantial share of national volume while contributing proportionally less value. The regional mix skews decisively toward vehicles over ten years old, higher mileage, alternative-fuel conversions, and the sub-USD 10,000 price band, reflecting lower household incomes and the thinnest professional retail coverage in the country. Private-party transactions are proportionally more significant here than anywhere else, and digital channels carry particular weight given the distances between provincial centres.
How Competition Is Evolving
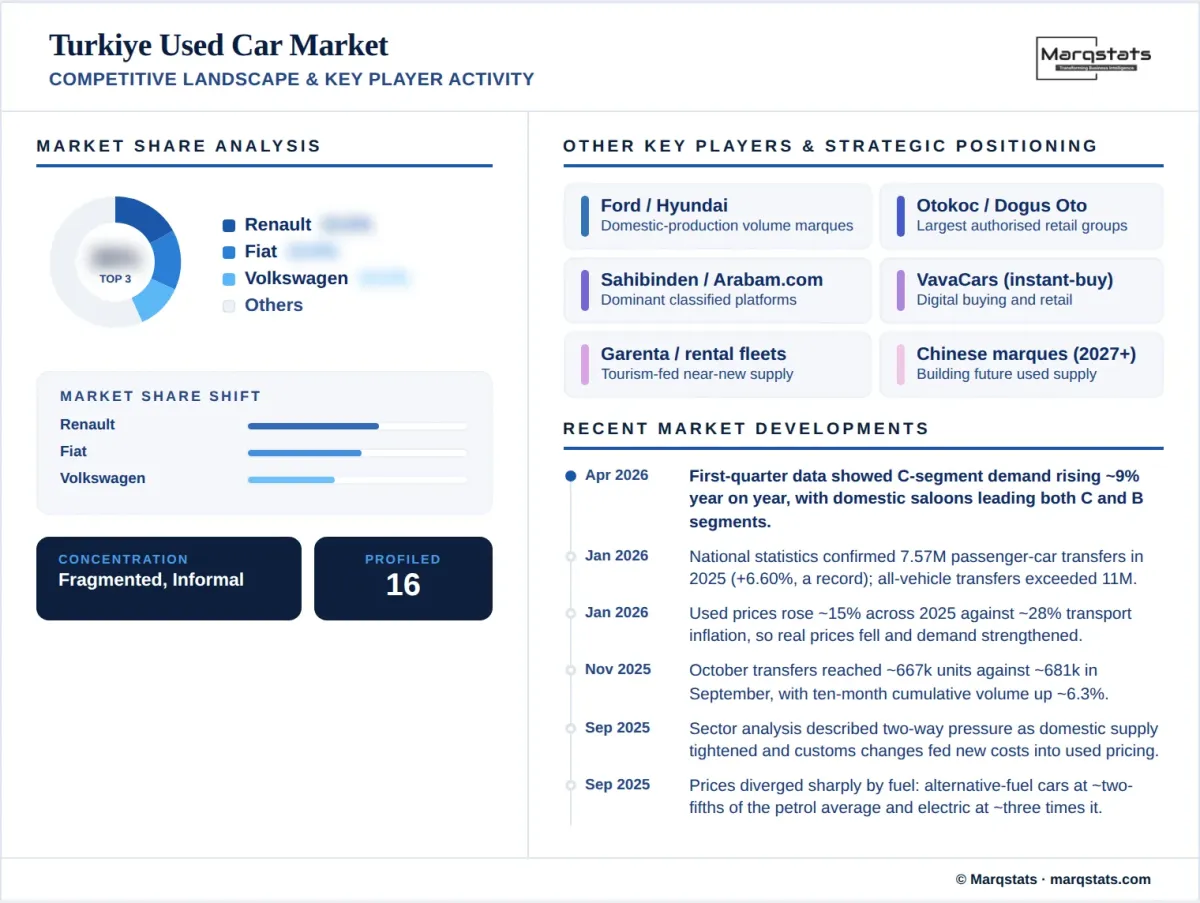
The Türkiye used car market is fragmented and predominantly informal. Private-party transactions account for about 55% of 2025 volume, independent dealers and open galleries for a further 35%, and manufacturer-authorised networks for only about 10%. No operator controls more than a low single-digit share. Formalisation is advancing at pace, with certified transactions growing at 14.29% annually and authorised networks at 8.47%, both among the faster rates in this series, though from among the lowest bases.
At brand level the ranking reflects domestic manufacturing history. Renault leads used transfers, followed by Fiat and Volkswagen, with Ford and Hyundai completing the upper tier. Renault and Fiat both maintain large domestic production operations in Türkiye, and their C-segment saloons have been the country's highest-volume models for years, which translates directly into resale dominance. The most-traded used models are consistently these domestically produced saloons alongside their B-segment stablemates.
The age profile of brand sales reveals how the market actually works. More than 60% of Renault's used transactions involve vehicles over ten years old, with the equivalent figure near 64% for Fiat and 56% for Volkswagen. These are not premium marques cycling three-year lease returns; they are volume brands whose decade-old cars form the backbone of national mobility. Any competitive assessment that focuses on near-new inventory misreads the majority of this market.
Two forward shifts are worth tracking. Chinese marques entered the new-car market recently and at scale, and sector commentary expects them to build substantial used supply over the coming years, which would be the first material change to the brand hierarchy in a decade. Separately, rental and fleet operators concentrated around the tourism regions form a distinct supply layer, and their disposal cycles determine much of the near-new inventory available to authorised and certified programmes.
Companies Covered
The report profiles 16+ companies with full strategy and financials analysis, including:
Recent Market Activity
Table of Contents
Coverage & Segmentation
This report provides a comprehensive assessment of the Türkiye used car market across a 2025 base year, historical data from 2021 to 2025, and forecasts spanning 2026 to 2030. Market sizing is presented in unit-volume terms and complemented by value analysis in United States dollars, with segmentation by vehicle type, propulsion type, seller type, sales channel, vehicle age, vehicle mileage, price band, certification status, vehicle positioning, and brand. The transaction layer counted is the passenger-car ownership transfer only, excluding vans, minibuses, motorcycles, and trucks, which together lift published all-vehicle transfer figures above 11 million units.
The scope covers demand drivers, restraints, and structural trends, with particular focus on the highest used-to-new ratio in this series, sedan dominance built on domestic manufacturing, the alternative-fuel segment and its effect on average transaction price, inflation and currency effects on real pricing, and the expected arrival of Chinese marques in resale. Comparative benchmarking is drawn from adjacent Marqstats coverage, including the Poland used car market, the closest analogue on fleet age, informality, and rapid formalisation among the markets covered.
Further comparison is available against the Germany used car market, the second-largest market in this series by transaction count and a useful benchmark for certified penetration and channel structure. An extended forecast to 2035 is available under customization for subscribers requiring a longer planning horizon, alongside deeper cuts by province, brand, or channel on request.