Market Snapshot
Key Takeaways
Market Overview & Analysis
Report Summary
The Russia used car market comprises used passenger-car purchases recorded across the Russian Federation in a calendar year, transacted through manufacturer-authorised networks, independent dealers and professional retailers, digital platforms, and direct private-party channels. This study segments demand by vehicle type, propulsion type, seller type, sales channel, vehicle age, vehicle mileage, price band, certification status, vehicle positioning, and brand, with a 2025 base year, historical coverage from 2021 to 2025, and forecasts to 2030. Sizing is presented in unit-volume terms and complemented by value analysis in United States dollars.
Readers should note two measurement caveats specific to this market. The historical series is compiled from annual agency totals, and the 2021 and 2023 figures are reported at rounded levels rather than exact counts, so year-on-year comparisons for those years carry a wider tolerance than elsewhere in this series. Second, all value figures are converted to United States dollars, and rouble volatility across the review period means dollar-denominated growth reflects exchange-rate movement alongside underlying price change. Unit volumes are unaffected by either issue, which is the principal reason this report is sized on volume.
The structural break of 2022 continues to govern supply. Most international manufacturers withdrew, new-car sales fell to a fraction of prior levels, and the pipeline that normally feeds three-to-five-year-old stock into the secondary market was interrupted. The consequence appears directly in the age distribution: vehicles up to three years old account for only about 9% of transactions, the smallest near-new share of any market in this series. Replacement supply now arrives through three channels, namely parallel and direct imports of used vehicles, locally assembled vehicles from a reconfigured manufacturer base, and residual stock of brands that formally exited, with roughly 130 thousand such vehicles sold new during 2025 and about half assembled at Chinese plants.
Import flows therefore determine the market's near-term shape. Japan remains the single largest source of used-vehicle imports, and shipments operate under restrictions covering engines above 1.9 litres and hybrid vehicles, which has pushed demand toward smaller-displacement petrol models and toward routing through third countries. Japanese shipments fell about 1.8% in January 2026 on a roughly 20% decline in volumes destined for Russia and Mongolia. Recycling-fee schedules applied at import are the principal domestic policy lever on this flow, and successive increases raise the landed cost of imported stock across every displacement class.
Market Dynamics
Key Drivers
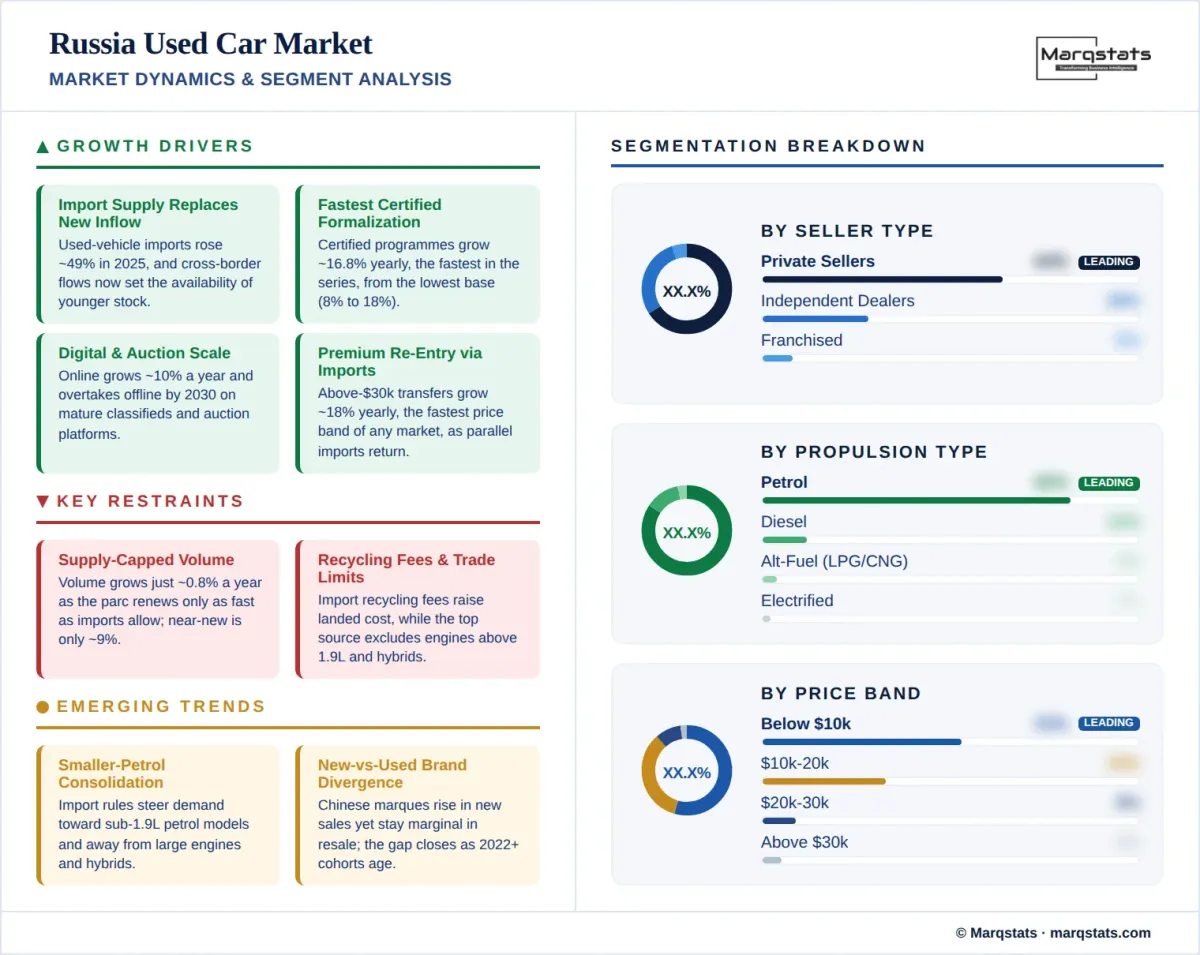
- Import supply replaces domestic new-car inflow, as used-vehicle imports rose about 49% in 2025 and now set the availability of younger stock.
- Certified programmes grow fastest of any segment in this series at a 16.75% CAGR, lifting warranty-backed share from about 8% of volume to about 18% by 2030.
- Digital and omnichannel retail scales at a 10.05% CAGR, overtaking offline in 2030, supported by mature domestic classifieds and auction platforms.
- Franchised networks grow at a 7.20% CAGR, the fastest seller-type growth in this series, formalising a market where nine in ten transactions carry no warranty.
- Premium transactions above USD 30,000 grow at 17.95% annually, the fastest price-band growth of any market covered, as imported premium stock re-enters through parallel channels.
Key Restraints
- Aggregate volume is capped at a 0.80% CAGR, the slowest growth in this series, because the parc renews only as fast as imports allow.
- Near-new stock is scarce, as vehicles up to three years old account for only about 9% of transactions following the 2022 interruption to new-car supply.
- Recycling-fee schedules raise the landed cost of imported vehicles, and successive increases compress margins across the import channel.
- Trade restrictions limit the source mix, as shipments from the largest supplying market exclude engines above 1.9 litres and hybrid vehicles.
Key Trends
- The market is consolidating toward smaller-displacement petrol models, as import restrictions steer demand away from larger engines and hybrids.
- Chinese marques are building parc presence through new sales yet remain marginal in resale, lagging registration share by a full ownership cycle.
- Sedans retain primacy at about 39% of transactions, a body-style structure found in no other market in this series.
- Electrified resale is emerging from a very low base, with battery-electric transfers growing at 38.57% annually from about 0.2% of volume.
Market Segmentation
Sedans account for about 39% of 2025 volume, the largest body type and a structure found in no other market in this series, where hatchbacks lead everywhere else. The concentration reflects the composition of the domestic parc, built on locally produced saloons and on imported budget sedans that dominated registrations through the 2010s. The segment holds flat in unit terms to about 38% of share by 2030. Hatchbacks account for about 20% of volume and contract fastest of any body style at a negative 2.55% CAGR to about 17% by 2030.
SUV and crossover models hold about 27% of 2025 volume and grow at a 4.22% CAGR, the strongest of any body style, reaching about 32% by 2030. Growth is supported by the crossover-weighted range of the manufacturers that now supply the domestic market and by road and climate conditions across much of the country. Pickup trucks hold about 3% of transfers and grow at 3.32% annually. MPV and minivan models remain marginal at about 4% and contract at 1.89%.
Petrol accounts for about 82% of 2025 volume, the highest petrol concentration of any market in this series, and declines gently at 1.00% annually to about 75% by 2030. Diesel holds only about 12% of transfers, roughly a third of the French or Spanish share, and grows marginally at 0.80% annually to hold that share through 2030. The inversion relative to Western Europe reflects fuel pricing, the composition of the domestic parc, and cold-weather operating preferences. Alternative fuels, principally liquefied petroleum gas and compressed natural gas, account for about 4% of transfers and grow at 4.79% annually.
Battery-electric transfers grow from roughly 12 thousand units in 2025 to roughly 127 thousand units by 2030, a 38.57% CAGR and the fastest of any propulsion segment, though from the smallest base in this series at about 0.2% of volume. Hybrids grow at 23.76% annually to about 5% of transfers by 2030 and plug-in hybrids at 30.13% to about 1%. Growth is constrained on both sides, as import restrictions cover hybrid vehicles and domestic electrified demand has been dampened by financing costs, customs duties, and recycling fees. Combined electrified share reaches about 8% by 2030, the lowest end-point in this series.
Private sellers handle about 64% of 2025 transactions, the highest informal share of any market in this series and well above the Italian and Spanish equivalents. The concentration follows from the age and value profile of the traded fleet, as vehicles averaging over ten years old and under USD 10,000 rarely justify professional reconditioning, warranty cover, or financing. The channel contracts at a negative 1.89% CAGR to about 56% by 2030, and it remains the dominant seller type throughout the forecast period by a wide margin.
Independent dealers and professional retailers hold about 28% of 2025 volume and grow at a 4.11% CAGR to about 33% by 2030. Franchised networks hold only about 8% of volume, less than half the Spanish share and the lowest in this series, however they grow fastest among seller types at a 7.20% CAGR to about 11% by 2030. Certified and warranty-backed transactions grow at 16.75% annually, the fastest structural segment across every market covered, rising from about 8% of the total to about 18% as dealer groups and platform operators extend inspection and guarantee products.
Online and omnichannel transactions hold about 34% of 2025 volume and grow at a 10.05% CAGR, overtaking offline retail in 2030 when they account for about 54% of transfers. Digital penetration is already higher than in Italy or Spain despite a far more informal seller structure, because domestic classifieds and online auction platforms achieved scale early and handle a large share of private-to-private listings. Instant-valuation and direct-purchase services have extended from listing into transaction, converting private supply into dealer inventory.
Offline transactions hold about 66% of 2025 volume and decline at a negative 6.45% CAGR to about 46% by 2030. Physical sites retain relevance for imported stock requiring inspection and customs documentation, and for the trade-in flows that support the small franchised segment. Regional dealer groups concentrated in the largest metropolitan areas account for most professional offline volume, while the long tail of independent traders operates with limited digital presence.
Vehicles older than ten years account for about 54% of 2025 volume and contract at a negative 2.00% CAGR to about 47% by 2030. Vehicles aged seven to ten years hold about 23% of transfers and grow at 1.66% annually. Together these cohorts represent more than three-quarters of the market, which is the structural reason average transaction price sits below every other market in this series. The oldest cohort is sustained by a parc that has renewed slowly since 2022 and by the high cost of imported replacement stock.
Vehicles up to three years old account for only about 9% of 2025 volume, the smallest near-new share of any market covered, and grow fastest of any age cohort at a 6.58% CAGR to about 12% by 2030. The four-to-six-year band holds about 14% and grows at 4.71%. Both cohorts depend directly on import volumes rather than on domestic fleet cycles, since the interruption to new-car supply after 2022 removed the domestic cohort that would now be reaching resale age. Recovery in this segment is therefore a function of trade conditions rather than of consumer demand.
Transfers below USD 10,000 account for about 53% of 2025 volume, the largest entry-tier concentration of any market in this series, and fall to about 45% by 2030 at a negative 2.50% CAGR. The USD 10,001 to USD 20,000 band holds about 33% of transactions and contracts marginally at 0.46% annually. Together these bands represent about 86% of all transactions in 2025, a concentration that reflects both the age of the traded fleet and household purchasing power outside the largest metropolitan centres.
The USD 20,001 to USD 30,000 band grows at 6.58% annually from about 9% of volume to about 12%. Transfers above USD 30,000 grow at 17.95% annually, the fastest price-band growth of any market in this series, rising from about 5% of volume to about 12% and reaching USD 19.21 billion by 2030. Expansion is driven by imported premium stock re-entering through parallel channels, and premium and luxury vehicles rise from about 12% to about 14% of transfers over the forecast period.
By Geography
Central Federal District
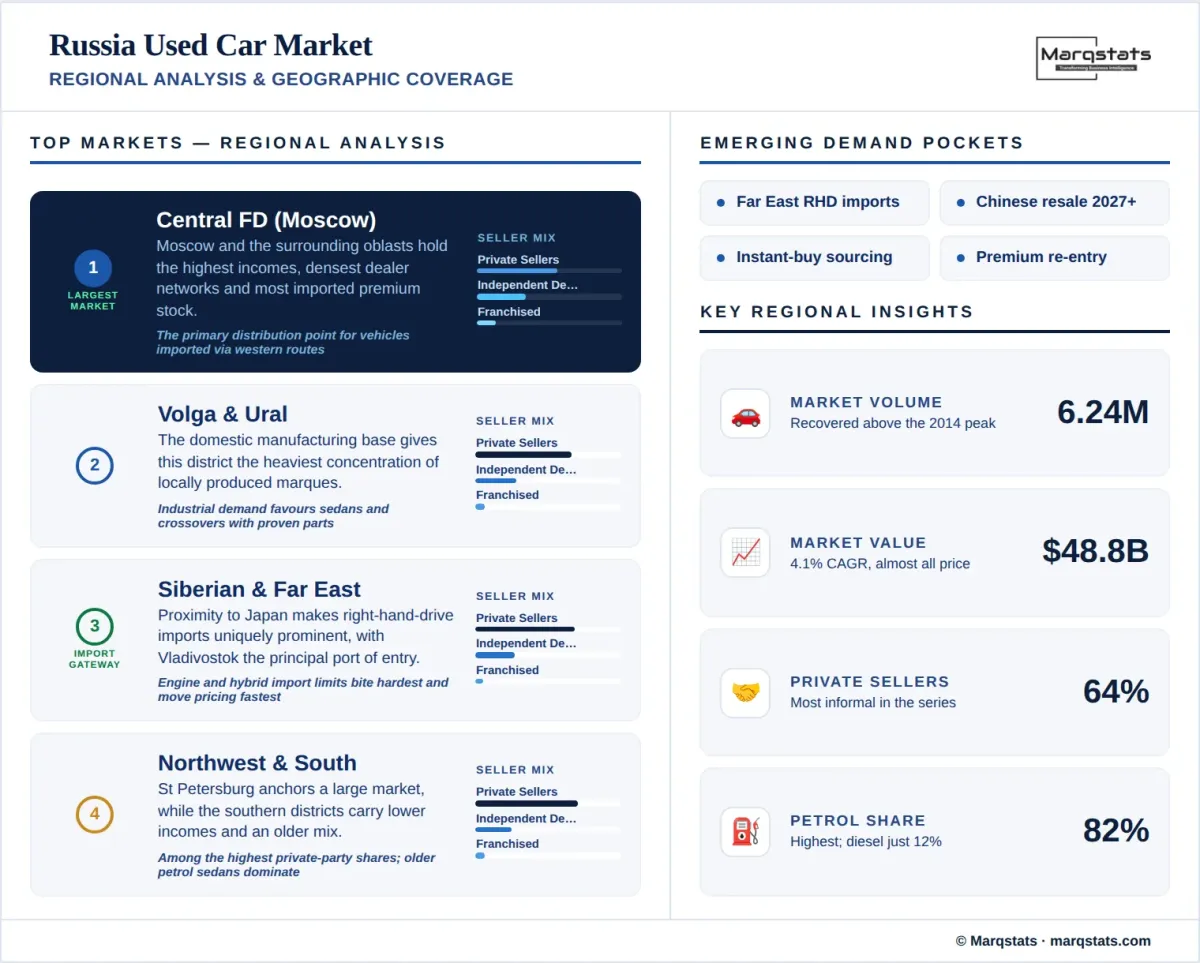
The Central Federal District, anchored by Moscow and the surrounding oblasts, forms the largest regional market by both volume and value. It concentrates the highest household incomes, the densest franchised and independent dealer networks, and the largest share of premium and imported stock. Moscow accounts for a disproportionate share of transactions above USD 30,000 and of the small certified segment, and the district functions as the primary distribution point for vehicles imported through western border crossings and Baltic routing.
Volga & Ural Federal Districts
The Volga district contains the country's domestic manufacturing base and shows the heaviest concentration of domestically produced vehicles in its used mix, with local marques taking a materially higher share than the national average. The Urals district combines industrial employment with substantial distances between population centres, sustaining demand for sedans and crossovers with proven parts availability. Both districts skew toward the sub-USD 10,000 band and toward private-party transactions.
Siberian & Far Eastern Federal Districts
The Far Eastern district operates as a distinct market shaped by proximity to the largest supplying country for used-vehicle imports. Right-hand-drive Japanese vehicles hold a share here that has no parallel elsewhere in the country, and Vladivostok functions as the principal port of entry for that flow before onward distribution westward. Import restrictions covering engines above 1.9 litres and hybrids therefore bite hardest in this district, and pricing responds faster to changes in shipping volumes and recycling-fee schedules than anywhere else.
Northwestern, Southern & North Caucasian Federal Districts
The Northwestern district, centred on St Petersburg, combines a large metropolitan market with border proximity that historically supported European import flows now substantially redirected. The Southern and North Caucasian districts carry lower average incomes, an older vehicle mix, and among the highest private-party shares in the country. Together these districts account for a substantial share of national volume while contributing proportionally less value, and demand concentrates in older petrol sedans below USD 10,000.
How Competition Is Evolving
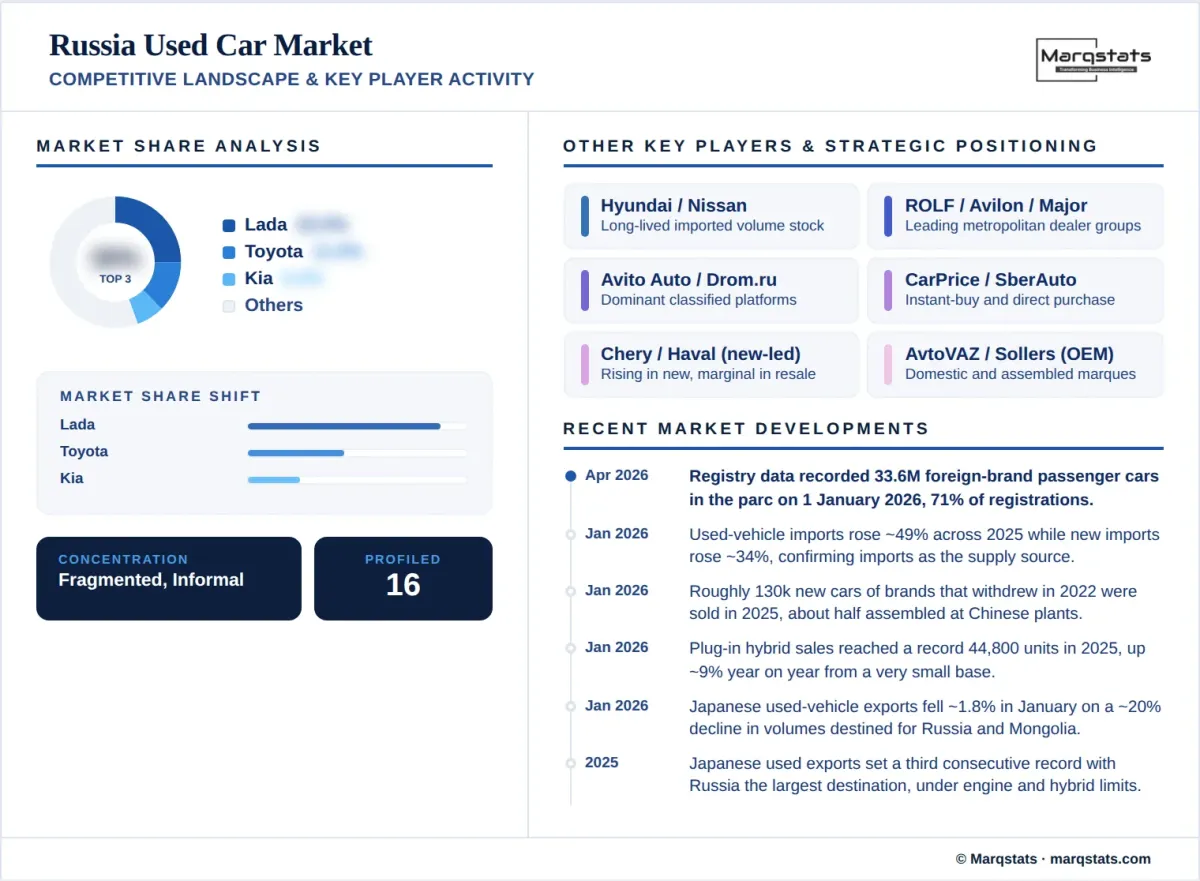
The Russia used car market is the most fragmented and least formalised of any market in this series. Private-party transactions account for about 64% of volume, independent traders for a further 28%, and manufacturer-authorised networks for only about 8%. No operator controls more than a low single-digit share of transactions. Concentration is nonetheless increasing at the margin, as certified programmes grow at 16.75% annually and franchised networks at 7.20%, both the fastest rates of formalisation across every market covered, from the lowest starting base.
At brand level the market is dominated by the domestic marque. Lada holds roughly 22% of used transactions, approximately twice the share of the next brand, and its entry-level models remain the most-traded vehicles in the country. Toyota follows at roughly 11% on the strength of imported and long-lived stock, then Kia at roughly 6%, Hyundai at roughly 5% and Nissan at roughly 5%. This ranking reflects the composition of a parc accumulated over two decades rather than current registration performance, and it is notably stable because the vehicles concerned continue to circulate far longer than in Western Europe.
The brand structure is diverging sharply between the new and used markets. Chinese marques now account for a substantial and rising share of new registrations, and locally assembled models from a reconfigured manufacturer base have displaced the international brands that withdrew. In resale, however, these marques remain marginal, with the fastest-growing among them expanding at a 39.51% CAGR from a base near 0.2% of transfers. The gap will close only as the post-2022 registration cohorts reach resale age from 2027 onward, and the composition of the used market will change more in the second half of the forecast period than in the first.
Competition centres on inventory sourcing rather than on retail differentiation. With nearly two-thirds of volume moving between private parties, professional operators compete primarily on their ability to intercept vehicles before they reach classified listings, and instant-valuation and direct-purchase services are the principal mechanism. Import specialists form a second competitive layer, sourcing, clearing, and distributing vehicles from abroad, with margins determined by recycling-fee schedules, currency movement, and shipping availability rather than by retail pricing power. Certification, warranty, and financing attachment are the emerging battleground for the small but rapidly growing formal segment.
Companies Covered
The report profiles 16+ companies with full strategy and financials analysis, including:
Recent Market Activity
Table of Contents
Coverage & Segmentation
This report provides a comprehensive assessment of the Russia used car market across a 2025 base year, historical data from 2021 to 2025, and forecasts spanning 2026 to 2030. Market sizing is presented in unit-volume terms and complemented by value analysis in United States dollars, with segmentation by vehicle type, propulsion type, seller type, sales channel, vehicle age, vehicle mileage, price band, certification status, vehicle positioning, and brand. The transaction layer counted is the used passenger-car purchase across the Russian Federation, excluding commercial-vehicle and motorcycle transactions. The 2021 and 2023 historical figures are reported at rounded agency levels rather than exact counts.
The scope covers demand drivers, restraints, and structural trends, with particular focus on the market's supply-determined character, import flows and the restrictions applying to them, recycling-fee schedules as the principal domestic policy lever, the scarcity of near-new stock following the 2022 interruption to new-car supply, the divergence between new and used brand structure, and the exceptional informality of the seller mix. Comparative benchmarking is drawn from adjacent Marqstats coverage, including the Italy used car market, the closest analogue on informality and fleet age among the Western European markets.
Further comparison is available against the Spain used car market, which shares a comparable age and price structure under entirely different supply conditions. An extended forecast to 2035 is available under customization for subscribers requiring a longer planning horizon, alongside deeper cuts by federal district, brand, or channel on request.