Market Snapshot
Key Takeaways
Market Overview & Analysis
Report Summary
The Belgium used car market comprises second-hand passenger-car registrations recorded across the Flemish, Walloon, and Brussels-Capital regions in a calendar year, transacted through manufacturer-franchised networks, independent dealers and professional retailers, digital platforms, and direct private-party channels. This study segments demand by vehicle type, propulsion type, seller type, sales channel, vehicle age, vehicle mileage, price band, certification status, vehicle positioning, and brand, with a 2025 base year, historical coverage from 2021 to 2025, and forecasts to 2030. Sizing is presented in unit-volume terms and complemented by value analysis in United States dollars.
Volume is anchored to the national administrative registration series, with the most recent years reconciled against federal statistics and sector federation reporting. Sector data placed 2025 second-hand registrations at approximately 734 thousand units, and this model sits within a fraction of a percent of that figure, so Belgian volumes carry unusually high confidence relative to several other markets in this collection. One measurement note applies throughout: the seller-type segmentation in this report describes who sells the vehicle, whereas the widely quoted 90% private figure describes who buys it. The two are distinct and should not be conflated.
The company-car system governs supply. Belgian fiscal treatment of employer-provided vehicles has made the company car a standard component of remuneration across white-collar employment, and professional buyers account for the majority of new registrations in a normal year. Those vehicles leave fleets after three to four years and enter the private secondary market, which is why the traded fleet is the youngest in this series and the average transaction price the highest. The median age of a used registration passed eight years for the first time during 2025, indicating that the fleet is nonetheless ageing at the margin.
Two policy forces are reshaping demand. Fiscal deductibility rules have pushed corporate fleets decisively toward electrified vehicles, and that cohort is beginning to reach resale age, though used battery-electric penetration remains modest at about 5% and concentrated in premium models rather than mainstream stock. Separately, the tightening of the Brussels low-emission zone is expected to accelerate replacement demand. The sector has cautioned that this will also strand a segment of owners whose vehicles no longer qualify and who cannot afford a compliant replacement, which is a genuine access constraint rather than simply a demand stimulus.
Market Dynamics
Key Drivers
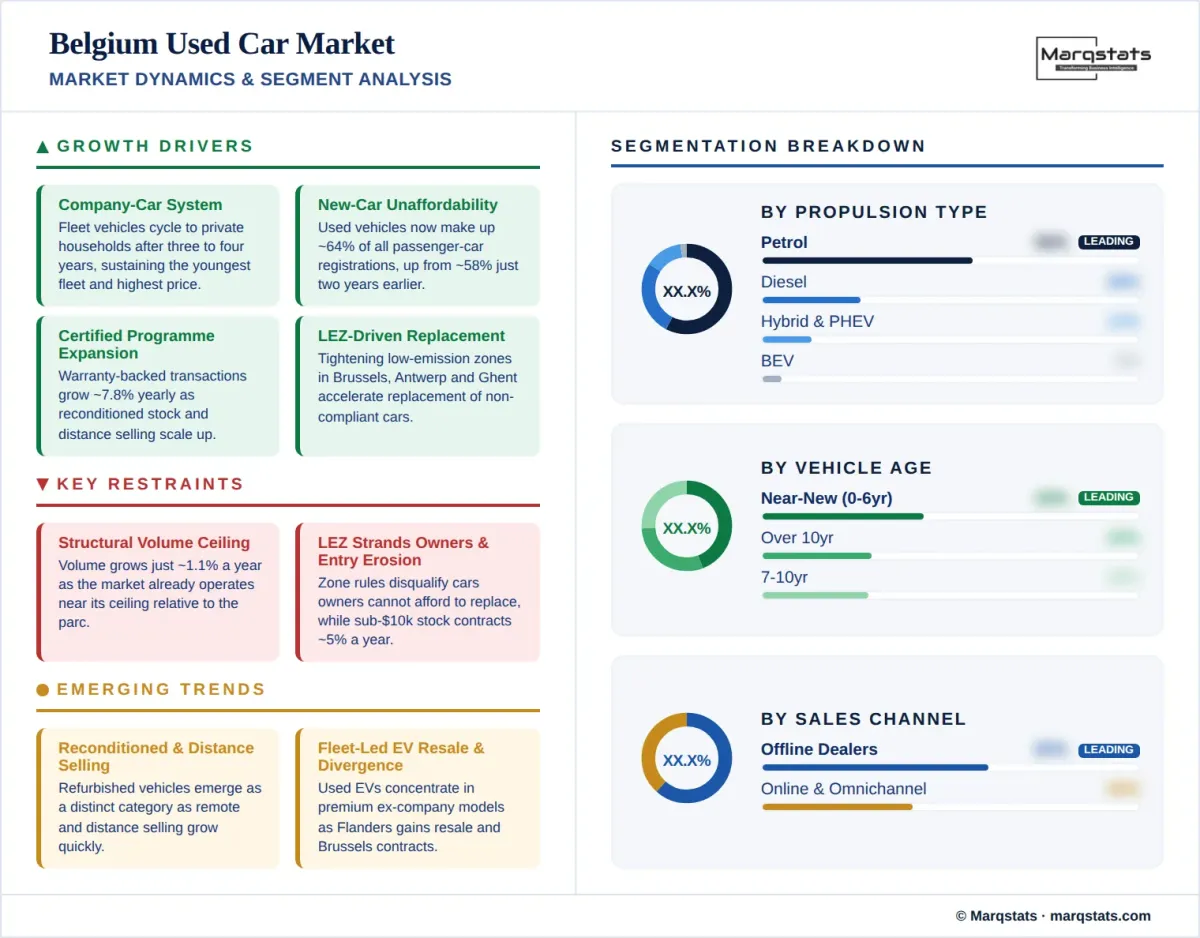
- The company-car system supplies the secondary market, as fleet vehicles cycle to private households after three to four years and sustain the youngest traded fleet in this series.
- New-car unaffordability redirects private demand, with used vehicles now about 64% of all passenger-car registrations against about 58% two years earlier.
- Certified programme expansion grows at a 7.80% CAGR, lifting warranty-backed share from about 28% of volume to about 39% by 2030.
- Digital and omnichannel retail scales at a 9.28% CAGR from an already high base, reaching about 60% of transactions by 2030.
- Low-emission zone tightening in Brussels is expected to accelerate replacement of non-compliant vehicles.
Key Restraints
- Aggregate volume growth is limited to a 1.12% CAGR, as the market is already operating near its structural ceiling relative to the size of the national parc.
- Low-emission zone rules strand owners of non-compliant vehicles who cannot afford a compliant replacement, constraining rather than converting part of the demand base.
- Entry-price inventory is contracting at a negative 5.20% CAGR, reducing the supply of vehicles below USD 10,000.
- Used battery-electric demand remains marginal at about 5% of transactions and concentrated in premium models, limiting mainstream electrified resale.
Key Trends
- Reconditioned and refurbished vehicles are emerging as a distinct commercial category, with remote and distance selling growing quickly.
- The traded fleet is ageing at the margin, as the median age of a used registration passed eight years for the first time during 2025.
- Used electric demand concentrates in premium ex-company models rather than mainstream stock, reflecting the composition of corporate fleets.
- Regional divergence is widening, as Flanders takes a growing share of electrified resale while Brussels contracts under zone restrictions.
Market Segmentation
Hatchbacks account for about 36% of 2025 volume and contract at 0.72% annually to about 33% by 2030. Compact city cars remain the mainstay of private purchasing, and consumer preference in the secondary market runs toward petrol and hybrid compacts alongside larger crossovers. Sedans hold about 15% of transactions and decline fastest of any body style at a negative 1.99% CAGR to about 13% by 2030, as the format continues to lose relevance outside the premium executive segment that company fleets historically supplied.
SUV and crossover models hold about 33% of 2025 volume, the second-highest crossover share in this series after Sweden, and grow at a 4.53% CAGR to about 38% by 2030. The high penetration reflects the composition of Belgian company-car fleets over the past decade, which shifted decisively toward crossover formats and are now supplying those vehicles into the secondary market. MPV and minivan models hold about 8% of transactions and pickups about 2%.
Petrol accounts for about 56% of 2025 volume and declines at a 4.06% CAGR to about 43% by 2030. Diesel holds about 26% of transactions and contracts at a negative 12.69% CAGR, the steepest decline of any segment in any market covered in this series, falling to about 13% by 2030. The collapse is driven jointly by fiscal treatment that turned company fleets away from diesel earlier and more completely than in neighbouring markets, and by low-emission zone enforcement across Brussels, Antwerp, and Ghent that removes older diesel stock from urban demand.
Hybrids are the largest electrified segment at about 10% of 2025 volume and grow at 15.83% annually to about 21% by 2030. Battery-electric transfers grow from roughly 34 thousand units in 2025 to roughly 116 thousand by 2030, a 23.79% CAGR lifting share from about 5% to about 15%. Plug-in hybrids grow at 16.02% to about 7%. Used electric demand is concentrated in premium models rather than mainstream stock, which reflects the composition of the corporate fleets now reaching resale age. Combined electrified share rises from about 18% to about 43% across the forecast period.
Independent dealers and professional retailers hold about 44% of 2025 volume, the largest seller channel, growing at a 3.30% CAGR to about 49% by 2030. Franchised networks hold about 21% and grow at 3.82% annually to about 24%. Certified and warranty-backed transactions grow at 7.80% annually from about 28% of the market to about 39% by 2030. Remote and distance selling has expanded quickly, and several operators now position reconditioned vehicles as a distinct category between new and conventional used stock.
Private sellers handle about 35% of 2025 transactions and contract at a negative 4.11% CAGR to about 27% by 2030. This measure describes who sells the vehicle and should be distinguished from the separate and widely quoted statistic that roughly 90% of used registrations are made by private individuals, which describes who buys. The gap between those two figures is the clearest single expression of the Belgian market's function: professional sellers, drawn largely from company fleet disposals, supplying private households.
Online and omnichannel transactions hold about 40% of 2025 volume, among the highest digital shares in this series, and grow at a 9.28% CAGR to about 60% by 2030. Belgium combines a compact geography that makes delivery economics favourable, high digital adoption across both language communities, and marketplace platforms operating in Dutch, French, and English. Distance selling of used vehicles has grown notably, and operators positioning themselves around refurbished stock have been the principal beneficiaries.
Offline transactions hold about 60% of 2025 volume and decline at a negative 7.03% CAGR to about 40% by 2030, among the steepest channel contractions in this series. Physical sites retain their role in trade-in appraisal, warranty servicing, and the handling of fleet disposal volumes that arrive in batches rather than individually. Consolidation continues among the larger dealer groups, and operators combining physical presence with distance-selling capability have gained ground fastest.
Vehicles up to three years old account for about 19% of 2025 volume and grow at a 3.62% CAGR to about 22% by 2030, while the four-to-six-year cohort holds about 24% and grows at 3.13% to about 27%. Together these cohorts represent about 43% of transactions, among the highest near-new concentrations in this series. Corporate fleet returns are the dominant supply source for both, and their volume and mix are therefore determined by fiscal policy on company vehicles rather than by private new-car buying.
Vehicles aged seven to ten years hold about 28% of volume and grow at 1.83% annually. Vehicles older than ten years account for about 29% of 2025 transactions, the lowest older-vehicle concentration in this series, and contract at a negative 3.56% CAGR to about 23% by 2030. Low-emission zone rules accelerate the removal of this cohort from urban demand, and export flows through Belgian ports draw further volume out of the domestic pool at the oldest end.
Transactions above USD 30,000 grow at an 8.31% CAGR from about 14% of 2025 volume to about 20% by 2030, reaching USD 5.53 billion. The USD 20,001 to USD 30,000 band grows at 3.71% annually from about 22% to about 25%. Together the upper bands account for about 36% of transactions in 2025 rising to about 45% by 2030. The concentration of value in these bands, combined with a young traded fleet, is what produces the highest average transaction price of any market in this series.
Transactions below USD 10,000 account for about 26% of 2025 volume and fall to about 19% by 2030 at a negative 5.20% CAGR. The USD 10,001 to USD 20,000 band is the volume core at about 38% of transactions and holds flat in unit terms while easing to about 36% of share. The contraction of the entry tier carries particular social weight in Belgium, since low-emission zone rules simultaneously disqualify many of the vehicles that occupy it, compressing supply and eligibility at the same time.
By Geography
Flanders
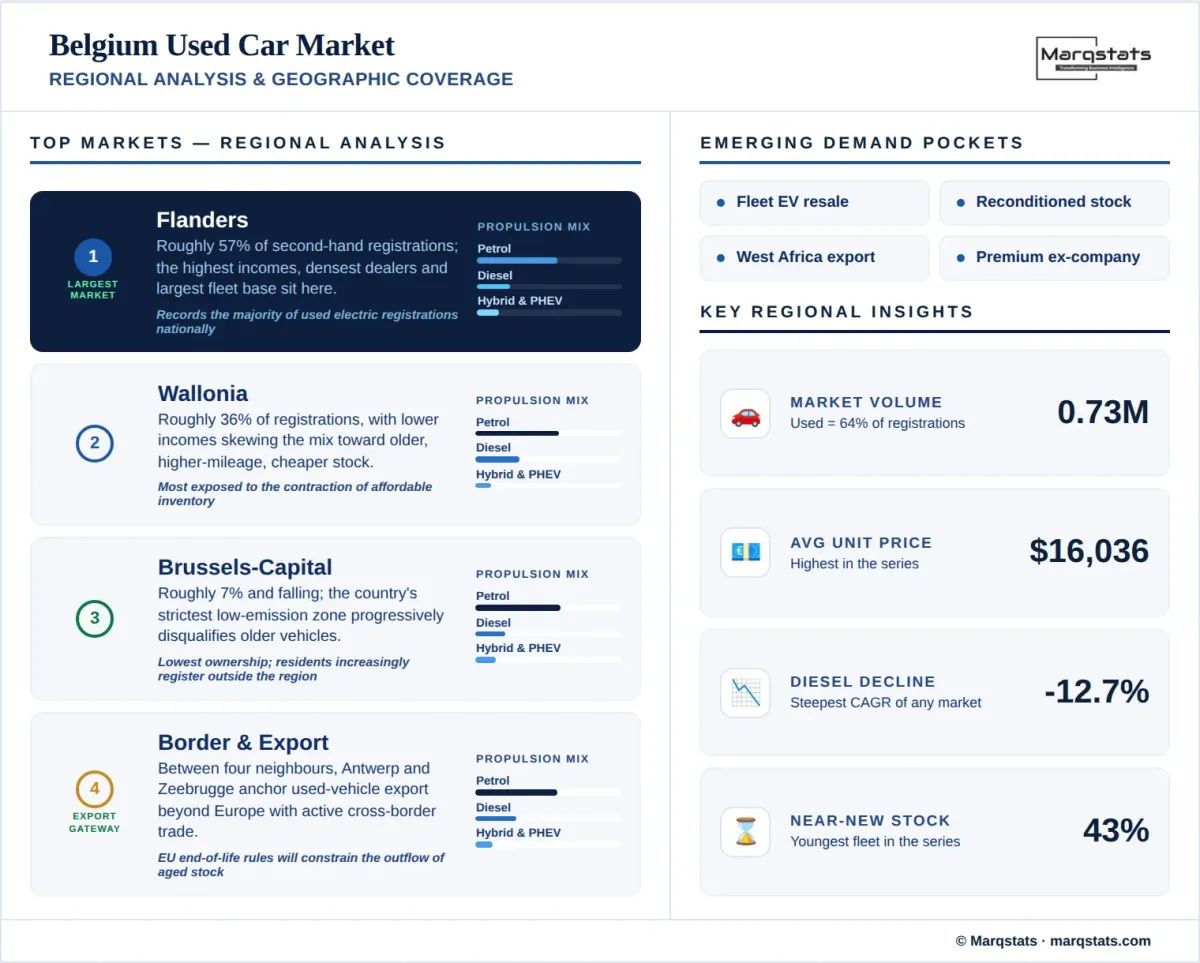
Flanders accounts for roughly 57% of second-hand passenger-car registrations, the dominant regional market by a wide margin. The region combines the highest household incomes in the country, the densest dealer network, and the largest concentration of corporate headquarters and fleet operators, which makes it the principal source of ex-company stock. Flanders also records the majority of used electric registrations, reflecting both regional purchasing power and the concentration of fleet-sourced electrified vehicles. Antwerp and Ghent operate low-emission zones that shape local propulsion mix.
Wallonia
Wallonia accounts for roughly 36% of second-hand registrations. Household incomes run below the Flemish average and the regional mix skews toward older vehicles, higher mileage, and the sub-USD 10,000 price band. Private-party transactions are proportionally more significant than in Flanders, and dealer networks are thinner outside the Liège, Charleroi, and Namur corridors. The region is therefore the most exposed to the contraction of affordable inventory across the forecast period.
Brussels-Capital Region
Brussels accounts for roughly 7% of second-hand registrations and its share has been falling. The capital operates the most restrictive low-emission zone in Belgium, and successive tightening progressively disqualifies older vehicles from circulation. The sector expects this to accelerate replacement demand while simultaneously stranding owners who cannot afford a compliant vehicle. Car ownership per household is the lowest in the country, and the registration base reflects a resident population that increasingly registers vehicles outside the region.
Border Provinces & Export Gateways
Belgium's position between the Netherlands, Germany, France, and Luxembourg creates active cross-border flows in both directions, with price, taxation, and registration differentials driving arbitrage across all four frontiers. The ports of Antwerp and Zeebrugge function as major gateways for used-vehicle export beyond Europe, drawing older stock out of the domestic pool and into West African and other destination markets. European end-of-life vehicle rules restricting the export of non-roadworthy vehicles will constrain this outflow and are likely to leave more aged stock in domestic circulation.
How Competition Is Evolving
The Belgium used car market is fragmented, with independent dealers and professional retailers holding about 44% of volume, private sellers about 35%, and manufacturer-franchised networks about 21%. No operator controls more than a low single-digit share of transactions. The market is nonetheless comparatively formalised, with certified transactions at about 28% and online channels at about 40%, and both are growing faster than the market as a whole. Consolidation among dealer groups has advanced steadily, and scale in reconditioning and distance-selling logistics increasingly separates the leaders from the independent tail.
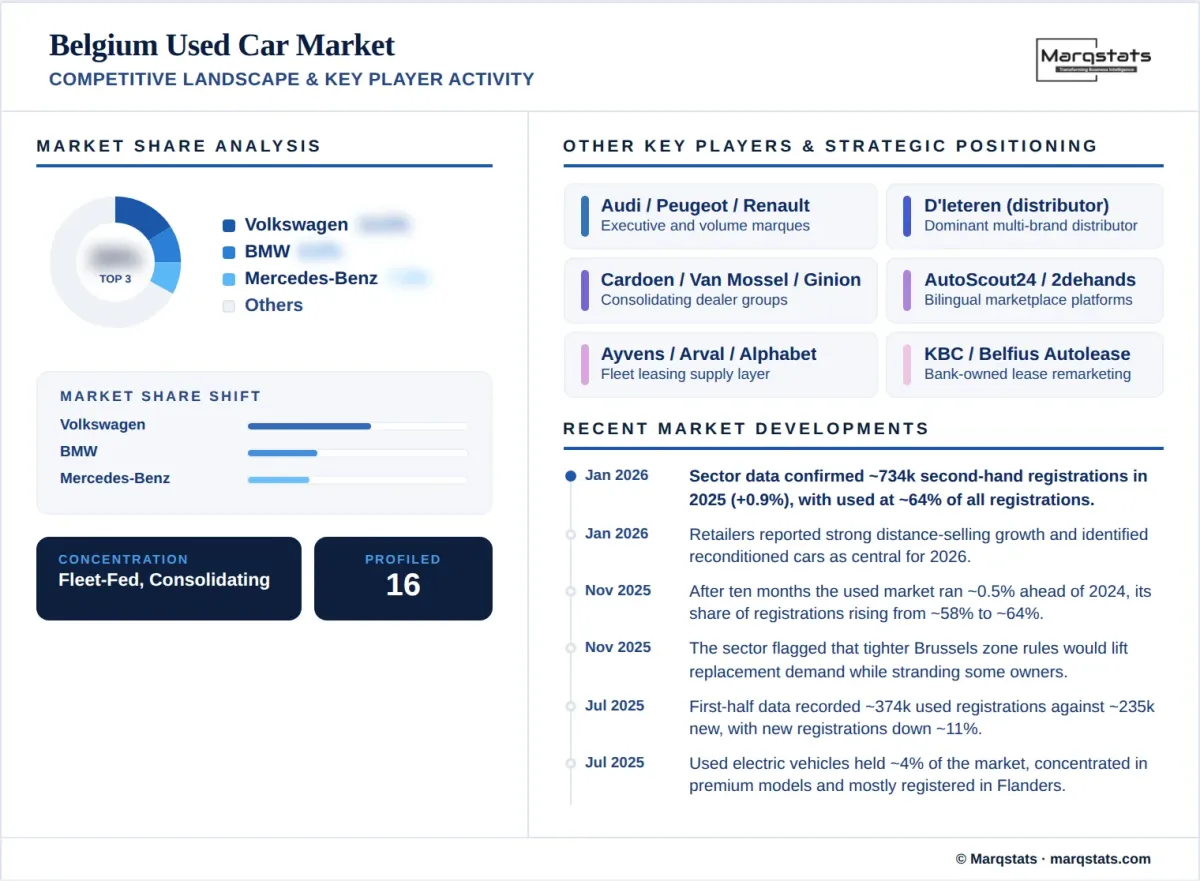
At brand level the ranking reflects the composition of Belgian company-car fleets rather than private new-car buying. Volkswagen leads with roughly 14% of transactions, and the German premium marques hold unusually strong positions for a market of this size, since executive and management fleet vehicles form a substantial share of the ex-company supply. French and Japanese volume brands occupy the tier below, supported by private new-car purchases in the years before the used cohort was formed. Chinese marques remain marginal in resale, lagging their new-registration progress by a full ownership cycle.
Fleet and leasing operators form a competitive layer of unusual importance. Because company vehicles supply the majority of near-new used stock, leasing companies and fleet managers effectively determine the volume, timing, mix, and propulsion profile of what reaches the secondary market. Their remarketing decisions, made on three to four-year cycles and shaped by fiscal policy on company cars, exert more influence over Belgian used supply than domestic private new-car purchasing does. Operators with direct access to these disposal channels hold a structural sourcing advantage.
Competition among retailers centres on reconditioning throughput and on electrified remarketing capability. With the youngest traded fleet in this series and rapid growth in electrified supply from fleets, professional operators compete on battery condition assessment, warranty structuring, and residual-risk management alongside conventional preparation. Distance selling has become a genuine differentiator rather than a supplementary channel, and several operators now market reconditioned vehicles as a defined category positioned between new and conventional used stock.
Companies Covered
The report profiles 16+ companies with full strategy and financials analysis, including:
Recent Market Activity
Table of Contents
Coverage & Segmentation
This report provides a comprehensive assessment of the Belgium used car market across a 2025 base year, historical data from 2021 to 2025, and forecasts spanning 2026 to 2030. Market sizing is presented in unit-volume terms and complemented by value analysis in United States dollars, with segmentation by vehicle type, propulsion type, seller type, sales channel, vehicle age, vehicle mileage, price band, certification status, vehicle positioning, and brand. The transaction layer counted is the second-hand passenger-car registration recorded in the national administrative series across all three regions, excluding commercial-vehicle and motorcycle registrations.
The scope covers demand drivers, restraints, and structural trends, with particular focus on the company-car system as the governing supply mechanism, the steepest diesel contraction recorded in any market covered, low-emission zone tightening and its dual effect on replacement demand and affordability, the youngest traded fleet in the series, and export flows through Belgian ports. Comparative benchmarking is drawn from adjacent Marqstats coverage, including the Netherlands used car market, the neighbouring market with which Belgium shares its closest structural parallels and its largest cross-border flows.
Readers examining Belgian vehicle demand more broadly may also refer to the Belgium two-wheeler market, which covers the same territory across a different vehicle class. An extended forecast to 2035 is available under customization for subscribers requiring a longer planning horizon, alongside deeper cuts by region, brand, or channel on request.