Market Snapshot
Key Takeaways
Market Overview & Analysis
Report Summary
The China used car market comprises used passenger vehicle transactions recorded across all provinces, autonomous regions and municipalities in a calendar year, transacted through manufacturer-authorised networks, independent dealers and used-car trading markets, online platforms, and direct private-party channels. This study segments demand by vehicle type, propulsion type, seller type, sales channel, vehicle age, vehicle mileage, price band, certification status, vehicle positioning, and brand, with a 2025 base year, historical coverage from 2021 to 2025, and forecasts to 2030.
Scope requires one clarification. This report counts passenger vehicles only, at 20.11 million transactions for 2025. Association reporting also covers commercial vehicles, which added a further 2.87 million transactions including 1.72 million trucks and 1.15 million buses. Readers comparing against all-vehicle totals should expect a figure near 23 million rather than 20 million, and the difference is a matter of vehicle scope rather than of disagreement about the passenger market.
Currency treatment matters more here than in most markets. Value figures are converted to United States dollars from a renminbi base, and dollar-denominated growth therefore reflects exchange-rate movement alongside underlying price change. Unit volumes are unaffected, which is why this report is anchored on volume throughout. In local terms the average transaction price stabilised at RMB 64,500 in December 2025, up RMB 1,400 year on year, which the association attributes to more balanced supply and demand following a period of aggressive new-vehicle discounting.
Inventory discipline has improved alongside pricing. Average dealer inventory cycles ran at 45 days in December 2025, unchanged from November, as operators moved toward tighter stock control to improve capital turnover and reduce exposure. That shift matters because the Chinese used market has historically been characterised by thin margins and high inventory risk, and a stabilising price environment combined with disciplined inventory is the precondition for the certified and warranty-backed segment to expand at the rates forecast here.
Market Dynamics
Key Drivers
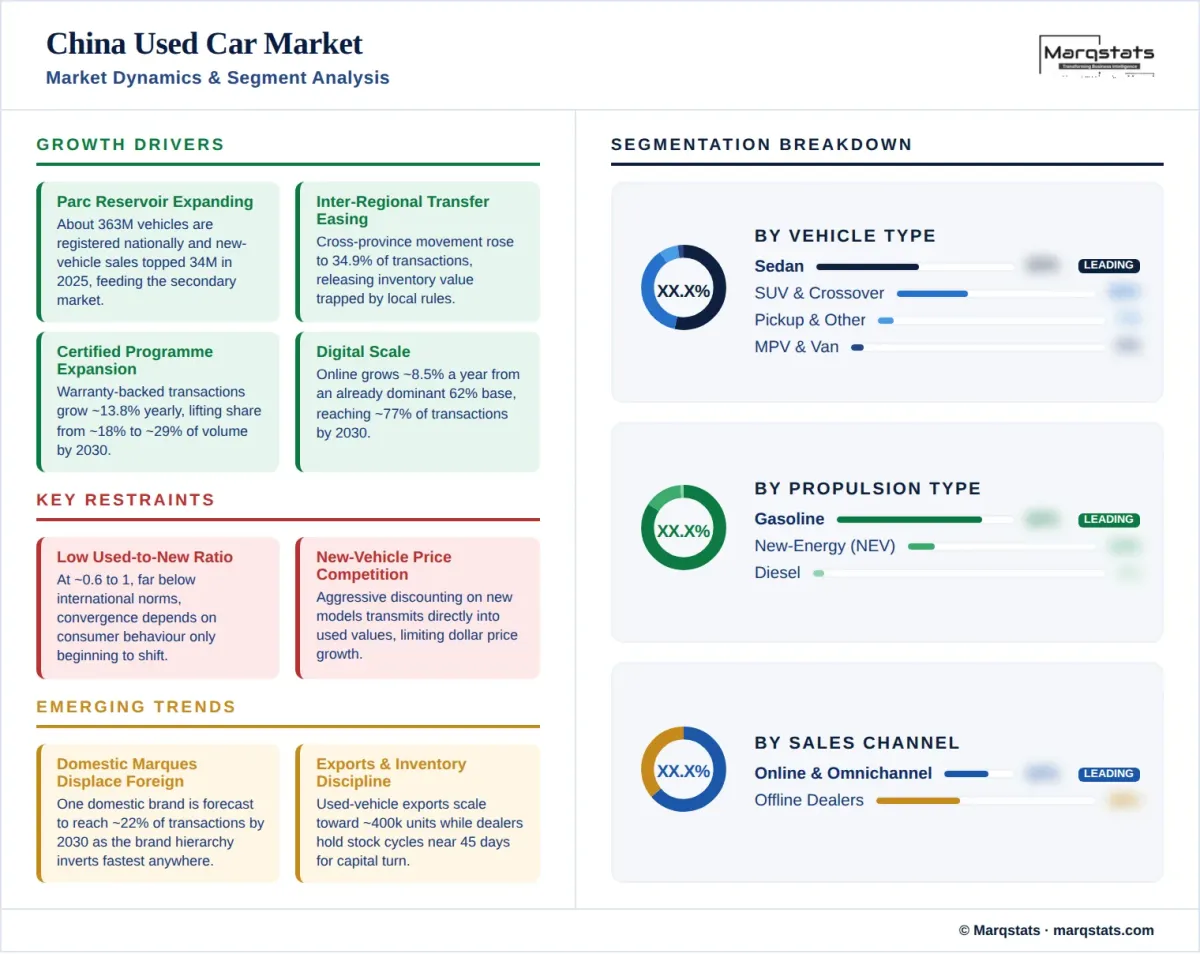
- The parc reservoir keeps expanding, with about 363 million vehicles registered nationally and new-vehicle sales above 34 million units in 2025.
- Inter-regional transfer restrictions have eased, lifting cross-province movement to 34.9% of transactions and releasing trapped inventory value.
- Certified programmes grow at a 13.79% CAGR, lifting warranty-backed share from about 18% of volume to about 29% by 2030.
- Online and omnichannel retail scales at an 8.45% CAGR from an already dominant 62% base, reaching about 77% of transactions by 2030.
- New-energy resale is compounding, with battery-electric transactions growing at a 26.64% CAGR from about 5% of volume to about 17%.
Key Restraints
- The used-to-new ratio remains near 0.6 to 1, far below international norms, and convergence depends on consumer behaviour that is only beginning to shift.
- New-vehicle price competition compresses used values, as aggressive discounting on new models transmits directly into the secondary market.
- Average transaction price growth is limited to a 1.73% CAGR in dollar terms, constraining value capture despite strong volume growth.
- Scrappage and replacement policy support moderated during 2025, removing part of the stimulus that had accelerated fleet turnover.
Key Trends
- Domestic marques are displacing foreign brands in resale, with one brand forecast to reach about 22% of transactions by 2030.
- Used-vehicle exports are scaling from roughly 160 thousand units in 2023 toward a projected 400 thousand.
- Dealer inventory discipline is tightening, with average stock cycles held at 45 days as operators prioritise capital turnover.
- Sedans are ceding leadership to SUVs and crossovers, which grow at a 7.65% CAGR against 0.49% for sedans.
Market Segmentation
Sedans account for about 52% of 2025 volume, the highest sedan concentration of any market in this study, and grow at only 0.49% annually while falling to about 44% of share by 2030. SUVs and crossovers hold about 36% of transactions and grow at a 7.65% CAGR to about 44%, overtaking sedans by the end of the forecast period. The crossover shift in Chinese new-vehicle purchasing began later than in Western markets and is now working through into resale with a lag of roughly five years.
MPV and minivan models hold about 5% of 2025 volume and grow at 3.96% annually, supported by family and commercial passenger demand across provincial markets. Pickup trucks account for about 3% of transactions and grow fastest of any body style at a 7.74% CAGR as usage restrictions in urban areas have eased. Hatchbacks hold only about 1% of volume, the lowest hatchback share of any market covered in this study, reflecting a parc built overwhelmingly around sedans and crossovers.
Gasoline accounts for about 82% of 2025 volume and contracts at a negative 1.51% CAGR to about 63% by 2030. Diesel holds only about 4% of transactions, among the lowest diesel shares in this study, and contracts at 2.01% annually. Diesel has never held a material position in the Chinese passenger parc, so the propulsion transition here runs directly from gasoline to new-energy vehicles without the diesel decline phase that characterises European markets.
Battery-electric transactions grow from roughly 1.09 million units in 2025 to roughly 4.14 million by 2030, a 26.64% CAGR that lifts share from about 5% to about 17%. Plug-in hybrids grow at 24.52% annually to about 7% of volume and conventional hybrids at 28.48% to about 7%. Association reporting places combined new-energy transactions at 1.60 million units in 2025, or 7.9% of the market, up 2.2 percentage points year on year, with growth above 40%. Combined new-energy share reaches about 31% of transactions by 2030, the highest end-point of any market outside Norway and Sweden.
Independent dealers and professional retailers hold about 57% of 2025 volume, the highest independent share of any market in this study, growing at a 5.02% CAGR to about 60% by 2030. Manufacturer-authorised networks hold about 22% and grow at 8.21% annually to about 27%. Certified and warranty-backed transactions grow at 13.79% annually from about 18% of the market to about 29%, supported by manufacturer programmes and by platform operators that combine inspection, warranty and financing within single ecosystems.
Private sellers account for only about 21% of 2025 transactions, the lowest informal share of any market in this study, and contract at a negative 5.94% CAGR to about 13% by 2030. The low base is structural rather than cyclical: China's used-car market developed alongside mobile commerce and organised trading markets rather than inheriting a private forecourt culture, and title transfer procedures have historically routed transactions through registered intermediaries.
Online and omnichannel transactions hold about 62% of 2025 volume, the highest digital penetration of any market in this study, and grow at an 8.45% CAGR to about 77% by 2030. Chinese platforms operate as integrated ecosystems combining listing, inspection, financing, warranty and logistics rather than as classified marketplaces, and one operator has recorded eight consecutive quarters of retail volume growth above 110%. The model has no close parallel in Western markets, where listing and transaction functions remain largely separate.
Offline transactions hold about 38% of 2025 volume and decline at a negative 6.40% CAGR to about 23% by 2030. Physical used-car trading markets remain significant across provincial cities, functioning as clustered venues where multiple independent dealers operate alongside inspection, title transfer and financing services. Their role is diminishing as platform ecosystems absorb both discovery and transaction, though they retain importance for inter-regional wholesale movement.
Vehicles up to three years old account for about 25% of 2025 volume and grow at a 5.56% CAGR to about 27% by 2030. The four-to-six-year cohort is the largest in the market at about 39% of transactions, growing at 2.86%. Together these cohorts represent about 64% of volume, the highest near-new concentration of any market in this study. The profile reflects a parc that is itself young, since much of it was purchased new within the past decade during China's period of most rapid motorisation.
Vehicles aged seven to ten years hold about 24% of volume and grow at 3.07% annually. Vehicles older than ten years account for only about 12% of 2025 transactions, the lowest older-vehicle concentration of any market covered in this study and roughly a quarter of the European share, though they grow fastest of any age cohort at 5.62%. That growth reflects the first large motorisation cohorts now passing the ten-year mark, and the share rises only marginally to about 13% by 2030.
Transactions below USD 10,000 account for about 52% of 2025 volume and grow marginally at 0.49% annually while falling to about 44% of share by 2030. The USD 10,001 to USD 20,000 band holds about 31% of transactions and grows at 4.62%. Together these bands carry about 83% of volume, which is why average transaction price sits well below Western levels despite the youth of the traded fleet. The average transaction price of RMB 64,500 translates to roughly USD 9,000 at prevailing rates.
The USD 20,001 to USD 30,000 band grows at 10.38% annually from about 11% of volume to about 15%. Transactions above USD 30,000 grow at 12.34% annually, rising from about 6% of volume to about 9%. Premium and luxury vehicles grow at 9.92% annually from about 12% of transactions to about 16%, concentrated in the tier-one municipalities and coastal provincial capitals where household incomes and premium new-vehicle penetration are both highest.
By Geography
East China
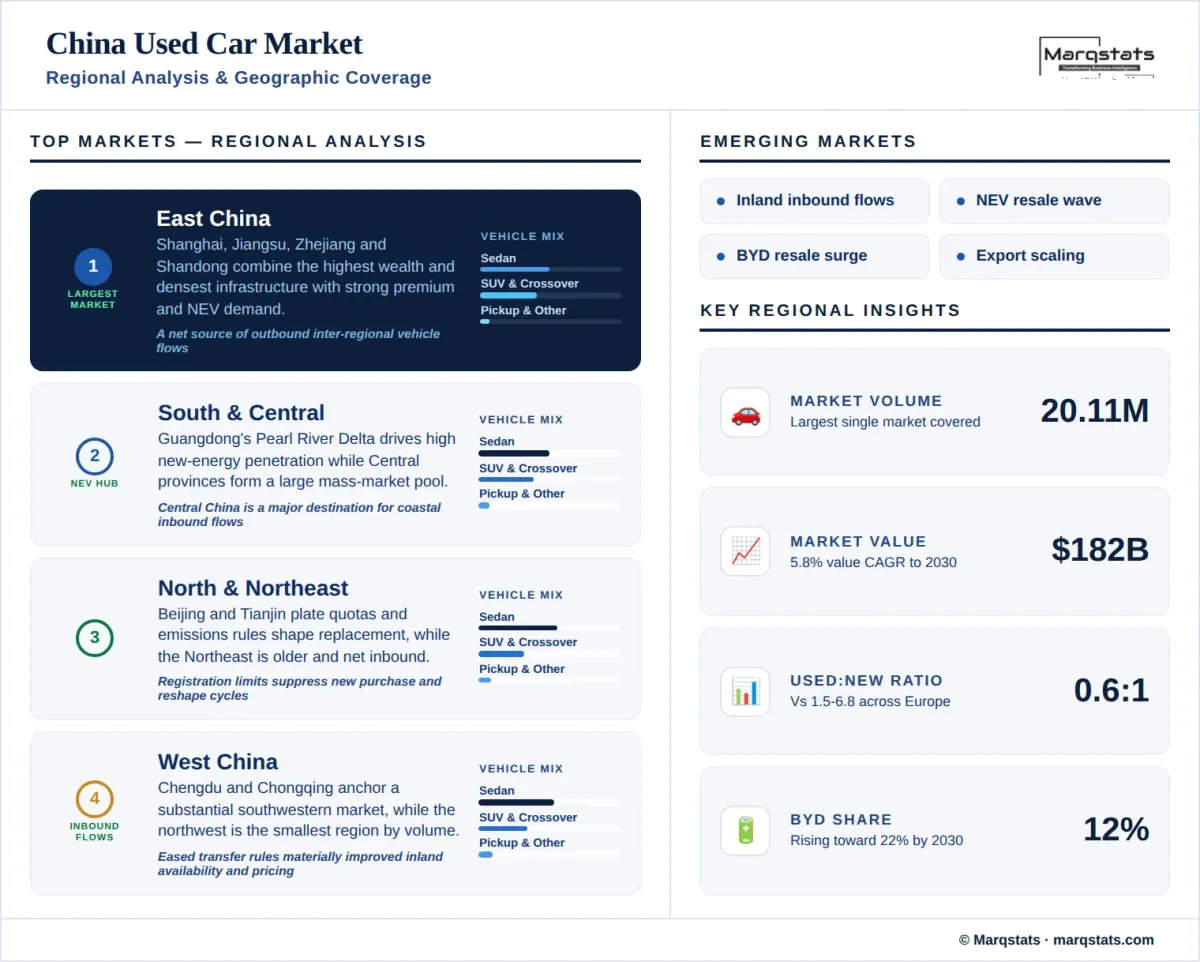
East China is the largest regional market, encompassing Shanghai, Jiangsu, Zhejiang, Shandong, Anhui, Fujian and Jiangxi. The region combines the highest concentration of household wealth outside the capital with the densest dealer and platform infrastructure, and it records the strongest premium and new-energy penetration in the country. Provincial capitals including Hangzhou, Nanjing and Jinan are among the most active individual city markets, and the region functions as a net source of inter-regional outbound vehicle flows.
North & Northeast China
North China, centred on Beijing, Tianjin, Hebei, Shanxi and Inner Mongolia, carries the country's most restrictive vehicle registration and emissions rules. Beijing and Tianjin operate licence plate quota systems that suppress new-vehicle purchase and shape replacement cycles, while emissions standards restrict the movement of older vehicles into the municipalities. Northeast China, covering Liaoning, Jilin and Heilongjiang, is a smaller and slower-growing market with an older vehicle mix and net inbound inter-regional flows.
South & Central China
South China, encompassing Guangdong, Guangxi and Hainan, is anchored by the Pearl River Delta and records high transaction volumes with strong new-energy penetration, reflecting Guangdong's position as a centre of domestic electric vehicle manufacturing. Central China, covering Henan, Hubei, Hunan and Jiangxi, forms a large volume market with a mass-market vehicle mix and functions as a major destination for inter-regional inbound flows from the coastal provinces.
West China
Southwest China, including Sichuan, Chongqing, Yunnan, Guizhou and Tibet, has grown into a substantial regional market with Chengdu and Chongqing among the most active provincial city markets in the country. Northwest China, covering Shaanxi, Gansu, Qinghai, Ningxia and Xinjiang, remains the smallest regional market by volume. Both western regions are net recipients of inter-regional vehicle flows, and the easing of transfer restrictions has materially improved vehicle availability and pricing across inland provinces.
How Competition Is Evolving
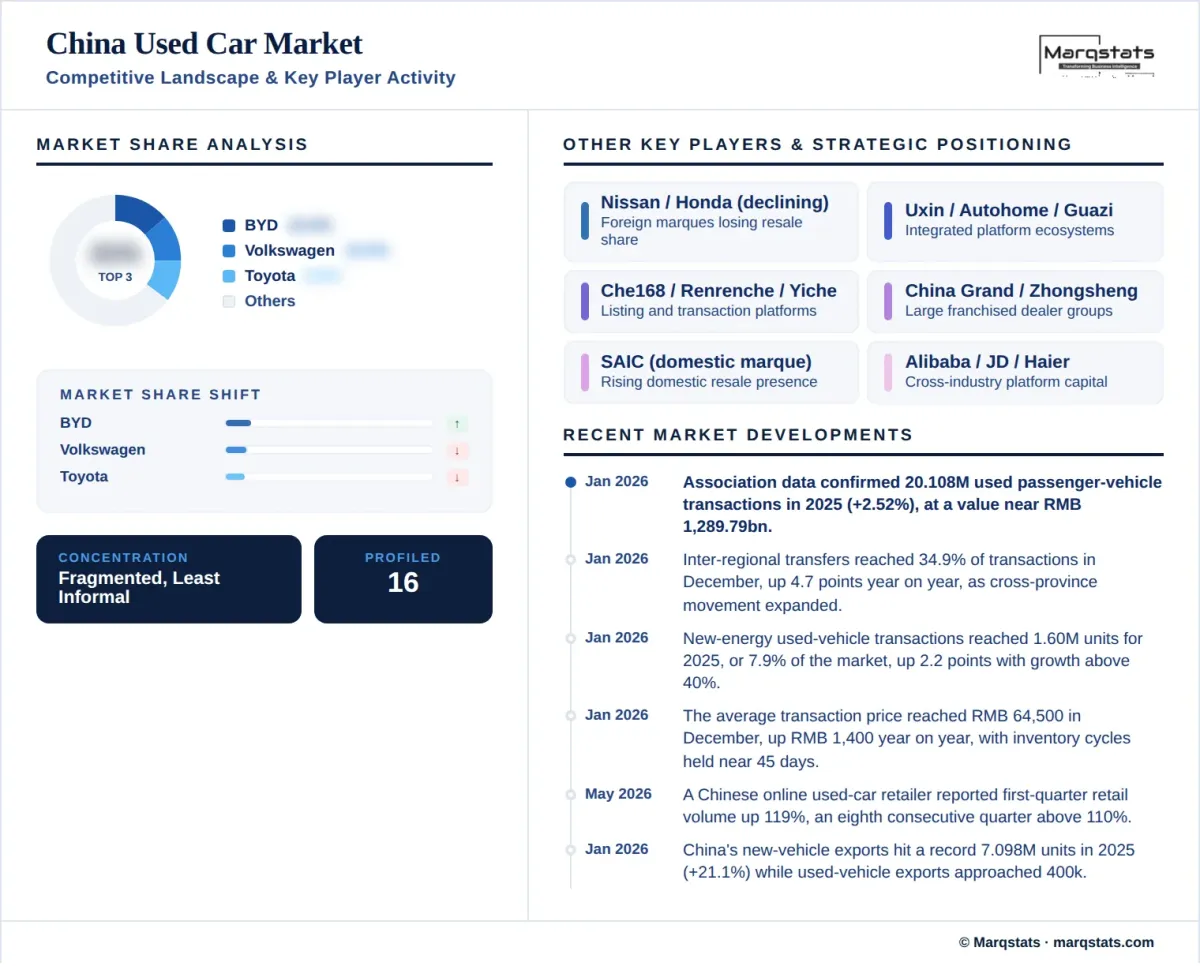
The China used car market is fragmented, with independent dealers and professional retailers holding about 57% of volume, manufacturer-authorised networks about 22% and private sellers about 21%. No operator controls more than a low single-digit share of transactions. The market is nonetheless the least informal of any covered in this study, and concentration is increasing as certified programmes grow at 13.79% annually and authorised networks at 8.21%, both faster than the market as a whole.
The most consequential competitive development is the displacement of foreign marques by domestic brands. BYD holds about 12% of used transactions in 2025 and is forecast to reach about 22% by 2030 at a 16.76% CAGR, which would make it the dominant used brand in the country by a wide margin. Volkswagen and Toyota, the historical leaders at about 10% and 9% respectively, both decline in absolute terms across the forecast period, as does Nissan at a negative 6.28% CAGR. No other market in this study shows a brand hierarchy inverting this quickly.
Platform operators occupy a structurally different position from their Western counterparts. Rather than functioning as classified marketplaces, the major Chinese platforms integrate listing, standardised inspection, warranty provision, consumer financing and logistics within single ecosystems, and several have extended into physical reconditioning capacity. One operator recorded eight consecutive quarters of retail volume growth above 110%, and cross-industry investment has brought consumer electronics capital into automotive transaction platforms.
Competition centres on inventory turn and inter-regional arbitrage rather than on retail margin. With average stock cycles at 45 days and thin per-unit margins, operators compete on capital efficiency, and the rise of inter-regional transfers to 34.9% of transactions has created a genuine arbitrage layer for operators able to source in surplus provinces and retail in deficit ones. Export capability is an emerging fourth dimension as Chinese used-vehicle exports scale toward a projected 400 thousand units.
Companies Covered
The report profiles 16+ companies with full strategy and financials analysis, including:
Recent Market Activity
Table of Contents
Coverage & Segmentation
This report provides a comprehensive assessment of the China used car market across a 2025 base year, historical data from 2021 to 2025, and forecasts spanning 2026 to 2030. Market sizing is presented in unit-volume terms and complemented by value analysis in United States dollars converted from a renminbi base. Segmentation covers ten dimensions. The transaction layer counted is the used passenger-vehicle transaction, excluding the commercial-vehicle transfers that association reporting covers separately and that would add roughly 2.87 million units to all-vehicle totals.
The scope covers demand drivers, restraints and structural trends, with particular focus on the used-to-new ratio and the headroom it implies, inter-regional transfer dynamics, new-energy vehicle resale, the displacement of foreign marques by domestic brands, platform ecosystem competition, and the scaling of used-vehicle exports. Regional context is available in the Asia-Pacific used car market report, within which China accounts for about 42% of transaction volume.
Comparative benchmarking against a mature market with a fully developed used-to-new ratio is available in the Germany used car market report. An extended forecast to 2035 is available under customization, alongside deeper cuts by province, brand or channel on request.