Market Snapshot
Key Takeaways
Market Overview & Analysis
Report Summary
The global used car market comprises used passenger vehicle transactions recorded worldwide in a calendar year, transacted through manufacturer-authorised networks, independent dealers and professional retailers, digital platforms, auction houses, and direct private-party channels. This study models twenty national markets individually and aggregates the remainder into six mutually exclusive regional groupings. Segmentation covers vehicle type, propulsion type, seller type, sales channel, vehicle age, vehicle mileage, price band, certification status, vehicle positioning, and brand, with a 2025 base year, historical coverage from 2021 to 2025, and forecasts to 2030.
Published estimates of this market range from under USD 0.5 trillion to above USD 2.6 trillion. That spread is not analytical disagreement. It follows from four definitional choices that most sources leave undisclosed. The first is transaction layer: whether wholesale and auction movements are counted alongside retail sales, and whether the same vehicle is counted twice as it passes from private seller to dealer to buyer. The second is vehicle scope: whether light commercial vehicles, motorcycles and heavy vehicles are included. The third is channel scope: whether private-party transactions are counted at all, since they are roughly 45% of global volume. The fourth is value basis: whether the figure represents gross transaction value or dealer gross margin.
This report states its choices explicitly. It counts used passenger vehicle transactions net of intermediate wholesale movements, includes private-party sales, excludes commercial vehicles and motorcycles, and reports gross transaction value. Readers reconciling against other sources should establish those four parameters before comparing any figure. Three national markets illustrate the scale of the problem directly: Italy's gross transfer series exceeds its net series by more than 70%, Türkiye's all-vehicle figure exceeds its passenger-car figure by nearly half, and Brazil publishes three totals ranging from 12.8 million to 18.5 million depending on vehicle scope.
Data confidence varies materially by market and is classified explicitly throughout the country reports. Germany, the United Kingdom, Italy, Spain, the Netherlands, Belgium, Türkiye, China and Japan are anchored to published national statistics and validate closely, in several cases to within a fraction of a percent. Sweden, Norway and several Southeast Asian, Gulf and Sub-Saharan markets publish no authoritative annual transaction series and are estimated from parc, registration and import indicators. Regional and global totals are weighted accordingly, and users should place greater confidence in the well-anchored components.
Market Dynamics
Key Drivers
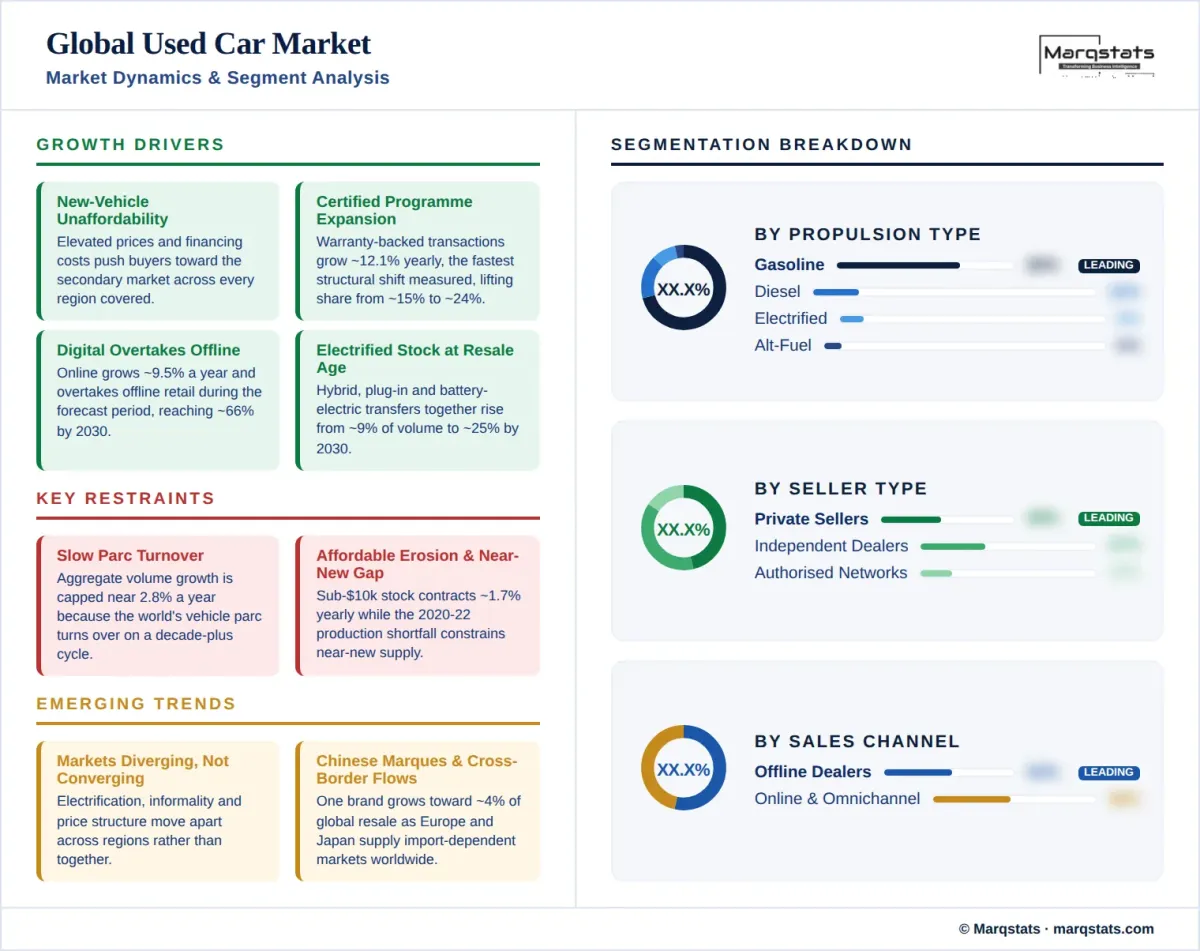
- New-vehicle unaffordability redirects demand worldwide, as elevated prices and financing costs push buyers toward the secondary market across every region covered.
- Certified programme expansion grows at a 12.09% CAGR, the fastest structural shift measured, lifting warranty-backed share from about 15% to about 24% by 2030.
- Digital and omnichannel retail scales at a 9.49% CAGR and overtakes offline during the forecast period.
- Electrified stock reaches resale age at scale, as hybrid, plug-in hybrid and battery-electric transfers together rise from about 9% of volume to about 25% by 2030.
- Emerging market motorisation adds volume, with India growing at 10.16% annually and the Middle East and Africa region at 4.70%.
Key Restraints
- Aggregate volume growth is capped at a 2.84% CAGR because the global vehicle parc turns over on a decade-plus cycle.
- Affordable inventory is contracting at a negative 1.69% CAGR, reducing supply below USD 10,000 that still carries about 36% of global volume.
- Weak new-vehicle production between 2020 and 2022 constrains near-new supply into the second half of the decade across developed markets.
- Regulatory divergence raises the cost of cross-border operation, as export rules, emissions zones and taxation differ by country and increasingly by city.
Key Trends
- Regional markets are diverging rather than converging, with electrification, informality and price structure moving apart rather than together.
- Chinese domestic marques are entering resale at scale, with one brand growing at a 22.71% CAGR to about 4% of global transactions by 2030.
- Cross-border flows are reshaping supply, with Europe and Japan supplying import-dependent markets across Africa, Central Asia and the Gulf.
- Battery state-of-health assessment is emerging as a competitive barrier wherever electrified resale has reached scale.
Market Segmentation
Sport-utility and crossover models account for about 33% of 2025 volume and grow at a 7.38% CAGR, the fastest body-style growth measured globally, reaching about 40% by 2030. Penetration ranges from about 48% in Norway to about 18% in Türkiye, tracking the point at which crossovers came to dominate each national new-vehicle market. Pickup trucks hold about 9% of transactions and grow at 3.82% annually, concentrated overwhelmingly in North America and Latin America, where they exceed 9% and 23% of respective regional volumes.
Sedans account for about 28% of 2025 volume and contract at 0.71% annually to about 24% by 2030. The global figure conceals extremes: sedans hold about 52% of Chinese transactions and about 48% in Türkiye against about 3% of hatchback share in North America. Hatchbacks hold about 20% of global volume and contract at 0.81% annually, ranging from about 46% in Japan and 49% in France to about 1% in China. MPV and minivan models hold about 6% of transactions.
Gasoline accounts for about 69% of 2025 volume and contracts at 1.07% annually to about 57% by 2030, remaining the dominant global propulsion throughout the forecast period. Diesel holds about 16% of transactions and contracts at a negative 4.24% CAGR to about 11%. The diesel spread is the widest of any segment: about 49% of transactions in Spain and 45% in France against about 4% in North America and China. Alternative fuels hold about 7% of global volume, concentrated in Brazilian flex-fuel and Turkish and Italian liquefied petroleum gas.
Battery-electric transfers grow from 4.29 million units in 2025 to 19.32 million by 2030, a 29.15% CAGR that lifts share from about 2.3% to about 9.2%. Hybrids grow at 20.98% annually to about 13% of volume and plug-in hybrids at 24.30% to about 4%. Combined electrified share reaches about 25% of global transactions by 2030. The national range is the widest in this study, from about 25% battery-electric share in Norway and 19% hybrid share in Japan to under 1% across most of South Asia and Sub-Saharan Africa.
Private sellers handle about 45% of 2025 transactions worldwide and contract at a negative 2.09% CAGR to about 35% by 2030. The global figure spans from about 64% in Russia, 55% in Türkiye and 54% across Latin America to about 21% in China and 30% in Japan. The pace of contraction is the clearest single indicator of formalisation, and it is fastest in the markets with the largest informal bases, which is why the global share falls almost ten percentage points across five years.
Independent dealers and professional retailers hold about 37% of 2025 volume and grow at a 5.50% CAGR to about 42% by 2030. Manufacturer-authorised networks hold about 18% and grow at 7.29% annually to about 23%. Certified and warranty-backed transactions grow at 12.09% annually from about 15% of the global market to about 24%, the fastest structural change measured in this study, and the principal mechanism by which value migrates from informal to professional channels.
Online and omnichannel transactions hold about 48% of 2025 volume and grow at a 9.49% CAGR, overtaking offline retail during the forecast period and reaching about 66% by 2030. Penetration is highest in China at about 62%, Japan at about 60%, India at about 55% and North America at about 53%, and lowest in Italy at about 24% and Spain at about 28%. The markets with the lowest current penetration record the fastest growth, indicating convergence in channel behaviour even as other structural measures diverge.
Offline transactions hold about 52% of 2025 volume and decline at a negative 6.08% CAGR to about 34% by 2030. Physical channels retain their role in trade-in appraisal, inspection, title transfer processing and financing attachment, and they remain dominant where vehicles are older, values lower and provenance harder to verify. Auction infrastructure remains structurally central in Japan, South Korea and North America, functioning as wholesale price discovery rather than as retail.
Vehicles older than ten years account for about 36% of 2025 transactions and contract at a negative 1.40% CAGR to about 29% by 2030. Vehicles aged seven to ten years hold about 25% and grow at 3.20% annually. Together these cohorts represent about 60% of global volume, ranging from about 81% in Poland and 70% in Türkiye to about 37% in China and 43% in North America. European end-of-life vehicle rules restricting export of non-roadworthy vehicles will slow removal of the oldest cohort from domestic circulation across supplying markets.
Vehicles up to three years old account for about 16% of 2025 volume and grow at a 6.64% CAGR to about 20% by 2030, while the four-to-six-year cohort holds about 23% and grows at 5.26% to about 26%. Both depend on new-vehicle sales made three to six years earlier, and the weak production years of 2020 to 2022 create a supply constraint that surfaces from 2026 across developed markets. Corporate leasing and rental de-fleeting are the dominant sources in Western Europe and North America.
Transactions below USD 10,000 account for about 36% of 2025 volume and contract at a negative 1.69% CAGR to about 29% by 2030. The band ranges from about 70% of transactions in India and 58% in Poland to about 12% in Switzerland and 14% in North America. The USD 10,001 to USD 20,000 band holds about 33% of global transactions and grows at 2.05% annually. Together these bands carry about 69% of global volume, which is why average transaction price sits at USD 12,121 despite the concentration of value in developed markets.
The USD 20,001 to USD 30,000 band grows at 6.02% annually from about 17% of volume to about 20%. Transactions above USD 30,000 grow at 9.73% annually, rising from about 14% of volume to about 19% and reaching USD 1.23 trillion by 2030, approximately 43% of total global market value from under a fifth of units. This concentration of value in the premium tier is the principal reason global value grows at 5.05% while volume grows at 2.84%.
By Geography
Europe
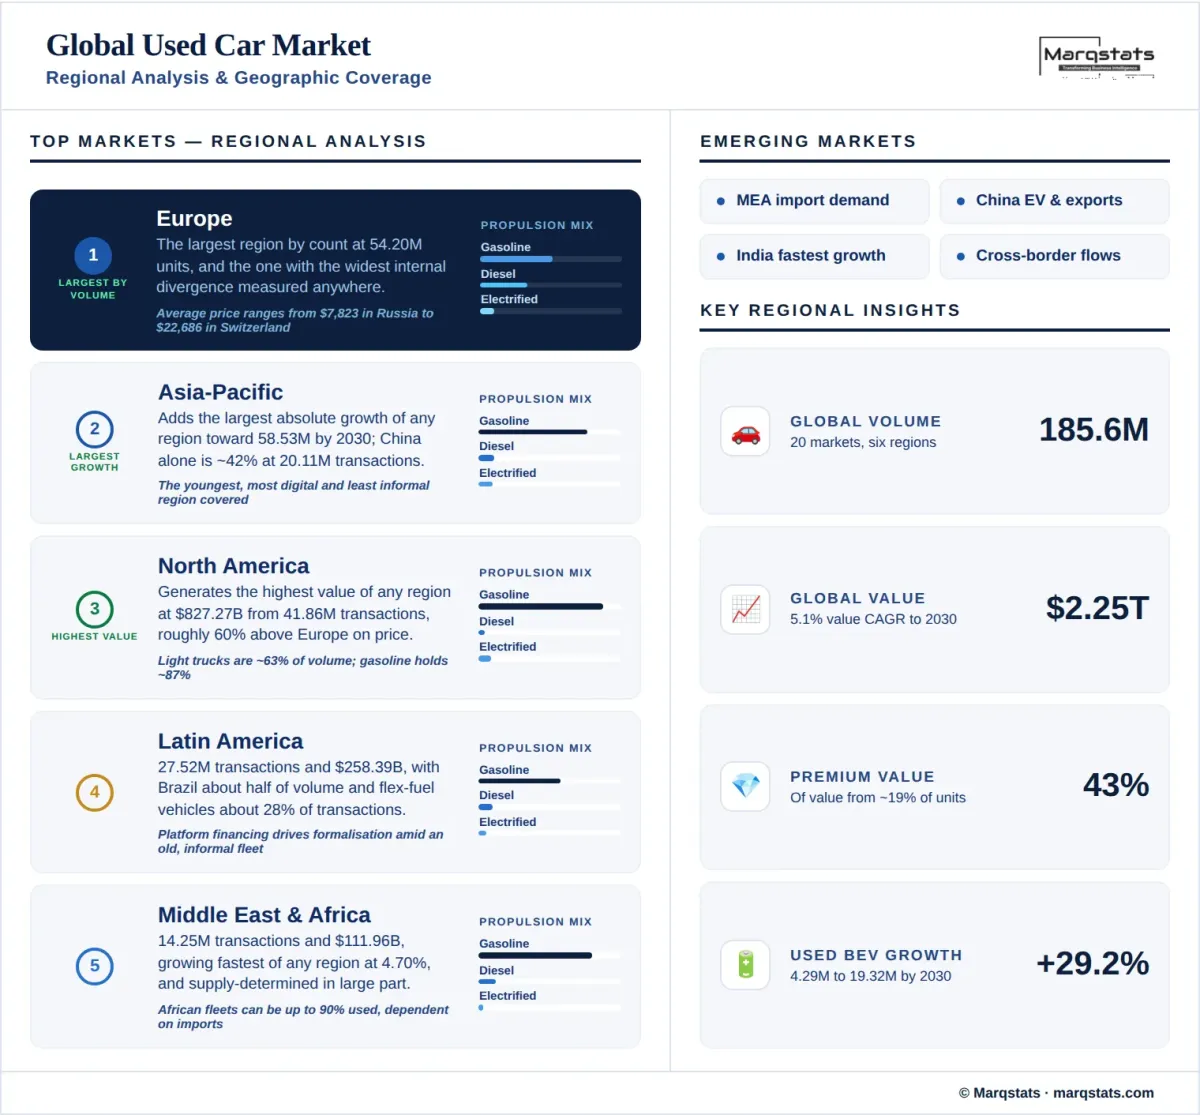
Europe is the largest region by transaction count at 54.20 million units in 2025, growing at a 1.64% CAGR to 58.36 million by 2030, with value rising from USD 669.26 billion to USD 819.48 billion. Thirteen national markets are modelled individually, covering about 86% of regional volume. The region contains the widest internal divergence measured anywhere: average transaction price ranges from USD 7,823 in Russia to USD 22,686 in Switzerland, private-seller share from 32% to 64%, and diesel share from 5.5% in the Netherlands to 49% in Spain.
North America
North America generates the highest value of any region at USD 827.27 billion from 41.86 million transactions, growing at a 1.55% volume CAGR and 3.88% in value. The United States accounts for about 92% of regional volume. Average transaction price of USD 19,763 is roughly 60% above the European average, driven by light trucks, which represent about 63% of transactions against about 28% in Europe. Gasoline holds about 87% of volume and diesel only 4%, so the region's propulsion transition runs directly from gasoline to electrified.
Asia-Pacific
Asia-Pacific adds the largest absolute growth of any region, rising from 47.80 million transactions to 58.53 million by 2030 at a 4.35% CAGR, with value growing from USD 383.12 billion to USD 522.54 billion. China alone accounts for about 42% of regional volume at 20.11 million transactions and crossed 20 million for the first time in 2025. The region is the youngest, most digital and least informal covered, with only about 25% of transactions involving vehicles over ten years old and private sellers at about 35%.
Latin America, Middle East & Africa
Latin America records 27.52 million transactions and USD 258.39 billion, growing at 3.27% annually, with Brazil about half of regional volume and flex-fuel vehicles about 28% of transactions. The Middle East and Africa together record 14.25 million transactions and USD 111.96 billion, growing fastest of any region at 4.70% volume and 8.69% value. Both regions are supply-determined in large part, with African markets dependent on imports where used vehicles constitute up to 90% of national fleets.
How Competition Is Evolving
The global used car market is highly fragmented, and no operator holds more than a fraction of one percent of worldwide transactions. About 45% of volume moves directly between private parties, and the remaining professional volume is distributed across manufacturer-franchised networks, national and regional dealer consolidators, digital-first retailers, auction operators and many tens of thousands of independent traders. Concentration is increasing at the margin as certified programmes grow at 12.09% annually and authorised networks at 7.29%, though from a base that leaves the sector among the least consolidated in automotive retail.
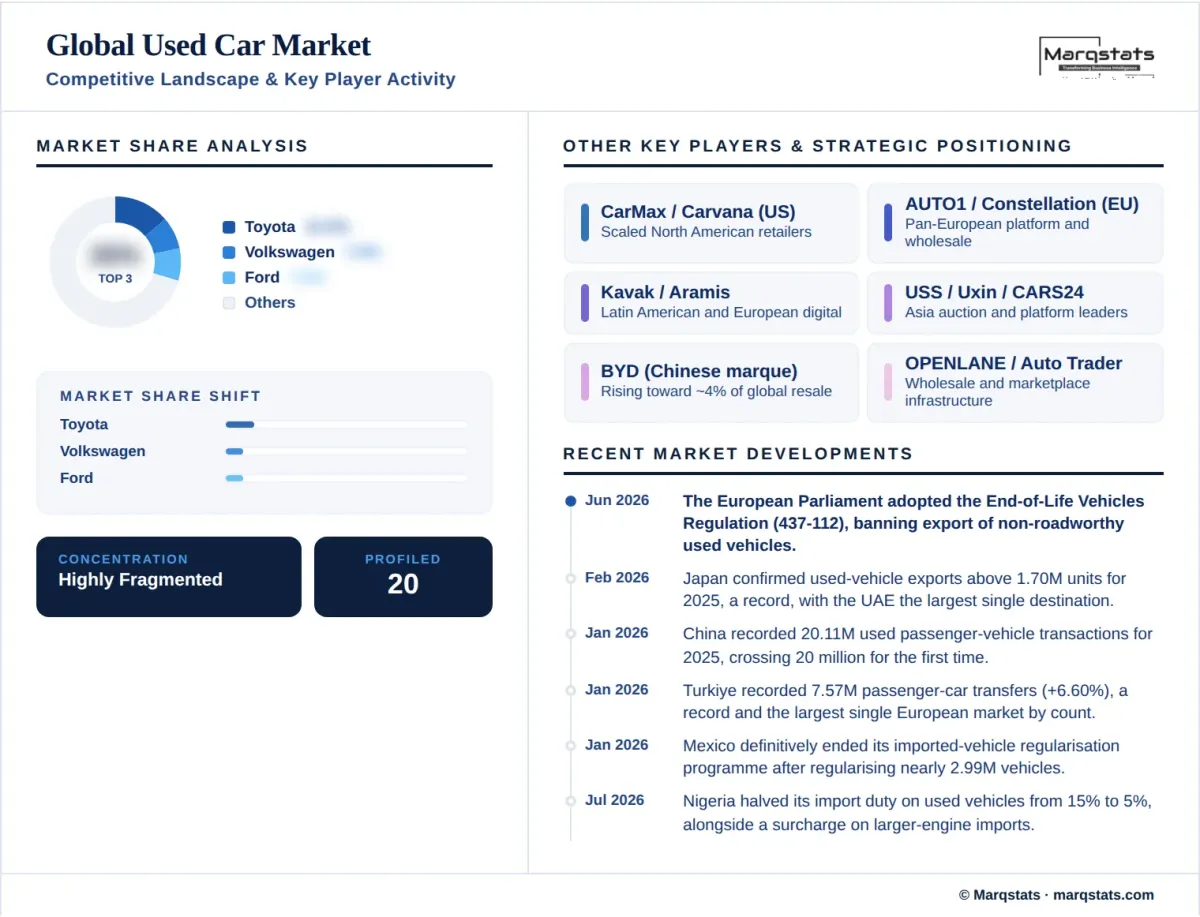
Brand structure at global level reflects volume manufacturing accumulated over decades. Toyota leads with about 12% of transactions, followed by Volkswagen at about 7%, Ford at about 7%, Hyundai at about 6% and Nissan at about 6%. The aggregate conceals substantial national variation: Toyota holds about 32% of Japanese and 21% of Middle Eastern and African transactions, Maruti Suzuki about 38% in India, Lada about 22% in Russia, Fiat about 22% in Italy and Volvo the lead position in Sweden. Country-level brand precision requires the individual national reports.
The most consequential competitive development is the arrival of Chinese domestic marques in resale. One brand grows at a 22.71% CAGR from about 1.5% of global transactions to about 4% by 2030, which would place it among the five largest used brands worldwide. Its position is concentrated in China, where it reaches about 22% of transactions, and in Asia-Pacific more broadly at about 10%. Chinese used-vehicle exports are scaling in parallel from roughly 160 thousand units in 2023 toward a projected 400 thousand, which will extend that presence into import-dependent markets.
Competitive differentiation is shifting from inventory sourcing toward technical capability and cost of capital. In electrified markets, battery state-of-health assessment and residual-risk management determine which operators can profitably hold stock, a materially higher barrier than conventional reconditioning. In the largest markets, financing attachment and access to securitised wholesale funding separate scaled operators from independents. In import-dependent markets, customs clearance, homologation and provenance verification form the competitive layer, and European export restrictions on non-roadworthy vehicles will reshape it directly.
Companies Covered
The report profiles 16+ companies with full strategy and financials analysis, including:
Recent Market Activity
Table of Contents
Coverage & Segmentation
This report provides a comprehensive assessment of the global used car market across a 2025 base year, historical data from 2021 to 2025, and forecasts spanning 2026 to 2030. Twenty national markets are modelled individually and aggregated into six mutually exclusive regions, namely Europe, North America, Asia-Pacific, Latin America, the Middle East and Africa. Market sizing is presented in unit-volume terms and complemented by value analysis in United States dollars, with segmentation across ten dimensions. The transaction layer counted is the used passenger vehicle transaction net of intermediate wholesale movements, including private-party sales and excluding commercial vehicles and motorcycles.
The scope covers global demand drivers, restraints and structural trends, with particular focus on the definitional divergence in published estimates, the inversion between volume and value leadership across regions, channel formalisation, electrified resale, cross-border supply flows and the regulatory framework following adoption of European end-of-life vehicle rules. Detailed treatment of the highest-value region is available in the North America used car market report, and of the fastest-growing large market in the Asia-Pacific coverage.
Users requiring country-level precision on price structure, channel mix, propulsion or brand should work from the individual national reports rather than from global averages, given the scale of divergence documented in this study. An extended forecast to 2035 is available under customization, alongside additional country breakouts and deeper cuts by brand or channel on request.