Market Snapshot
Key Takeaways
Market Overview & Analysis
Report Summary
The Poland used car market comprises passenger-car ownership transfers recorded across Poland in a calendar year, transacted through manufacturer-franchised networks, independent dealers and open-air markets, digital platforms, and direct private-party channels. This study segments demand by vehicle type, propulsion type, seller type, sales channel, vehicle age, vehicle mileage, price band, certification status, vehicle positioning, and brand, with a 2025 base year, historical coverage from 2021 to 2025, and forecasts to 2030. Sizing is presented in unit-volume terms and complemented by value analysis in United States dollars.
The 2024 and 2025 volumes carry a specific caveat. Historical figures for 2021 to 2023 are drawn from published transfer series, while 2024 and 2025 are independently estimated from recovery patterns and import inflows. That estimate revised the prior working figure upward substantially, and readers should treat the recent years as carrying wider tolerance than the verified early history. The direction is well supported by import data and by dealer network reporting, however the absolute level for the two most recent years is a Marqstats reconstruction rather than a published count.
Import dependence distinguishes Poland from every Western European market in this series. Roughly 856 thousand used passenger cars entered the country in 2025, alongside a further 93 thousand light commercials, and this inbound flow rather than domestic new-car registrations is the primary source of tradeable stock. Germany supplied about 52% of the volume, with France second and the United States third and growing rapidly at nearly 29% year on year. Inbound volume fell 2.0% overall in 2025 and is forecast to decline again toward 840 thousand units, so supply is tightening at the margin.
The composition of that inbound flow is improving even as the volume contracts. Imports of vehicles older than ten years fell about 12% in 2025 and were the principal driver of the overall decline, while vehicles aged six to ten years rose about 23% and those under two years rose about 14%. Electric imports remain small at under 6.5 thousand units, though they grew about 18%, while diesel imports fell about 8% to roughly 329 thousand. The market is therefore importing progressively younger and cleaner stock, which is the mechanism behind the rapid growth in the upper price bands.
Market Dynamics
Key Drivers
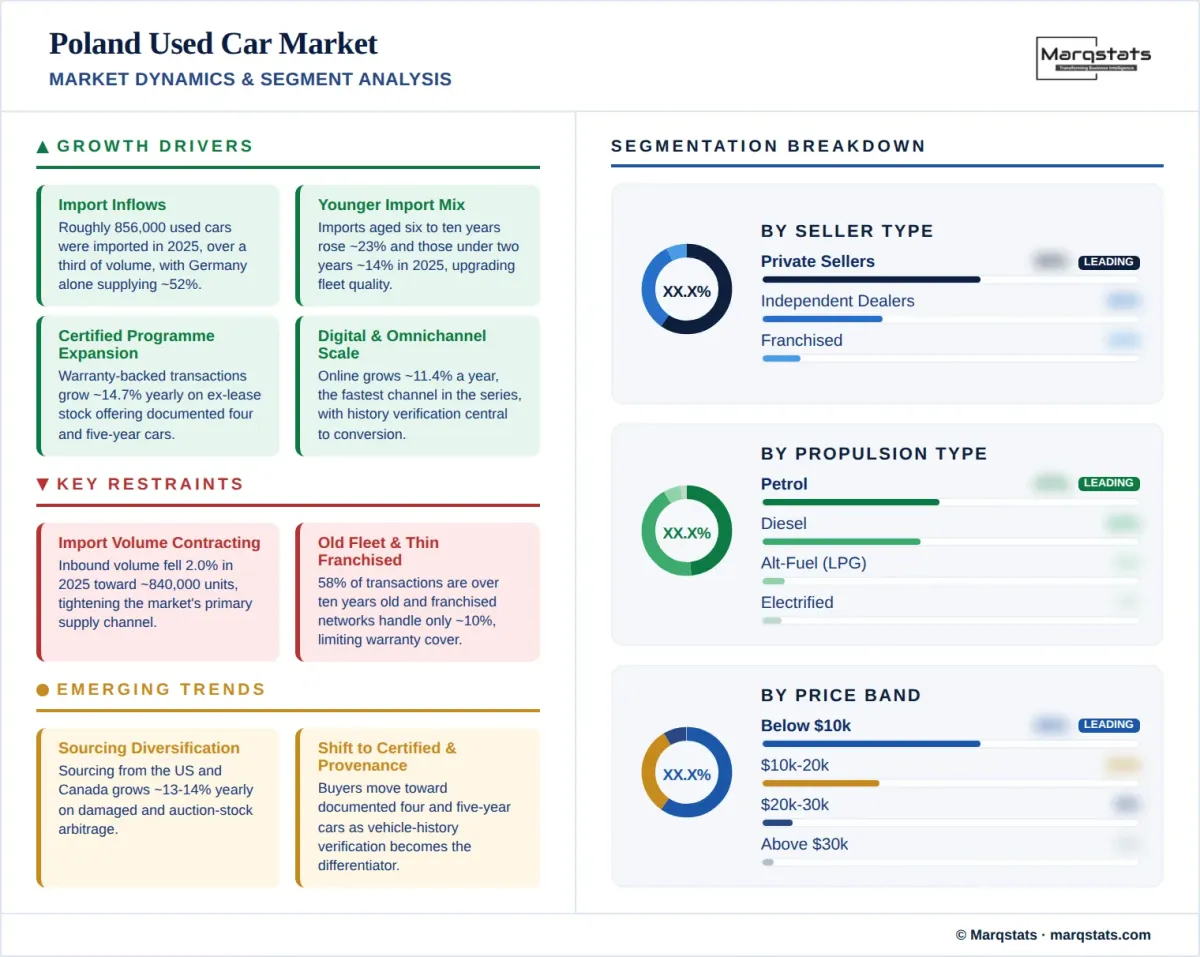
- Import inflows supply more than a third of transaction volume, with roughly 856 thousand used passenger cars entering the country in 2025.
- The imported fleet is getting younger, as vehicles aged six to ten years rose about 23% and those under two years about 14% during 2025.
- Certified programme expansion grows at a 14.71% CAGR, the second fastest in this series, lifting warranty-backed share from about 12% to about 22% by 2030.
- Ex-lease supply is expanding as corporate contracts mature, feeding certified dealer programmes with four and five-year-old vehicles.
- Digital and omnichannel retail scales at an 11.44% CAGR, the fastest channel growth in the European series, reaching about 56% of transactions by 2030.
Key Restraints
- Import volume is contracting, falling 2.0% in 2025 with a further decline forecast toward 840 thousand units, tightening the primary supply channel.
- The traded fleet remains old and high-mileage, with 58% of transactions involving vehicles over ten years old and 66% above 100 thousand kilometres.
- Manufacturer-franchised networks handle only about 10% of transactions, limiting warranty coverage and structured financing across most of the market.
- Transaction times are lengthening and price pressure is building at the young end, as ex-lease supply and new-market competition compress residual values.
Key Trends
- Import sourcing is diversifying beyond Western Europe, with volumes from the United States and Canada growing at roughly 13% to 14% annually.
- Buyers are shifting toward four and five-year-old vehicles offered through transparent certified dealer programmes.
- Price elasticity differs sharply by segment, as city and compact models respond faster to corrections while SUVs and premium models hold value.
- Electrification is beginning from a very low base, with battery-electric transfers growing at a 36.83% CAGR from about 1% of volume.
Market Segmentation
Hatchbacks account for about 40% of 2025 volume, easing to about 36% by 2030 while growing modestly in unit terms. Sedans hold about 23% of transactions, the second-highest sedan share in the European series after Russia, and reflect an imported fleet weighted toward the compact and lower-medium saloons that dominated Western European fleet registrations a decade ago. The most frequently imported models in the country are consistently compact hatchbacks and lower-medium saloons from German and French volume brands.
SUV and crossover models hold about 20% of 2025 volume, the lowest crossover share in the European series, and grow fastest of any body style at a 7.46% CAGR to about 25% by 2030. The low base reflects the age of the imported fleet, since crossover formats only came to dominate Western European registrations in the 2010s and are therefore only now reaching the age at which they enter the Polish import stream. MPV and minivan models hold about 9% and pickups about 2%.
Petrol accounts for about 47% of 2025 volume and declines gently at 0.98% annually to about 40% by 2030. Diesel holds about 42% of transactions, the third-highest diesel share in Europe after Spain and France, and contracts at a negative 4.23% CAGR to about 30%. The high diesel share is imported rather than domestic in origin, reflecting the composition of Western European fleets from which Poland sources, and diesel import volumes fell about 8% in 2025 to roughly 329 thousand units. Alternative fuels, principally liquefied petroleum gas, hold about 6% of transactions, one of the larger such segments in Europe.
Battery-electric transfers grow from roughly 23 thousand units in 2025 to roughly 179 thousand units by 2030, a 36.83% CAGR that lifts share from about 1% to about 7%. Hybrids grow at 29.07% annually to about 13% of volume and plug-in hybrids at 34.83% to about 3%. All three start from among the smallest bases in the European series. Electric imports remain minimal at under 6.5 thousand units despite growing about 18% in 2025, so domestic electrified resale will depend increasingly on the new-car market, where battery-electric share has recently passed 10% of registrations.
Private sellers handle about 58% of 2025 transactions, the second-highest informal share in this series after Russia. Much of this volume passes through open-air vehicle markets and classified platforms rather than professional premises, and a substantial share consists of imported vehicles resold directly by the individuals who brought them into the country. The channel contracts slowly at a negative 0.59% CAGR to about 50% by 2030, remaining the dominant seller type throughout the forecast period.
Independent dealers and professional retailers hold about 32% of 2025 volume and grow at a 5.42% CAGR to about 37% by 2030. Manufacturer-franchised networks handle only about 10% of transactions, the second-lowest franchised share in this series, however they grow fastest of any seller type at a 7.81% CAGR to about 13% by 2030. Certified and warranty-backed transactions grow at 14.71% annually from about 12% of the total to about 22%, driven by ex-lease programmes offering four and five-year-old vehicles with documented history.
Online and omnichannel transactions hold about 36% of 2025 volume and grow at an 11.44% CAGR, the fastest channel growth in the European series, reaching about 56% of transfers by 2030. Polish classified platforms achieved scale early and handle very large private-listing volumes, and the conversion opportunity lies in moving those listings from lead generation into completed, financed, and warranted transactions. Vehicle history verification services have become central to that conversion given the imported and often opaque provenance of much of the stock.
Offline transactions hold about 64% of 2025 volume and decline at a negative 5.19% CAGR to about 44% by 2030. The offline channel in Poland spans a wider range of formats than in Western Europe, from franchised showrooms through independent premises to open-air markets that remain significant in smaller cities and rural areas. Consolidation is advancing among the larger dealer groups, and cross-border import specialists occupy a distinct position sourcing directly from Western European auctions and trade channels.
Vehicles older than ten years account for about 58% of 2025 transactions and contract only marginally at a negative 0.18% CAGR to about 51% by 2030. Vehicles aged seven to ten years hold about 23% and grow at 3.32% annually. Together these cohorts represent about 81% of all transactions, the highest older-vehicle concentration in the European series. The imported fleet reinforces this structure, since the median vehicle entering the country is about 12.5 years old and roughly half of all imports are more than a decade old.
Vehicles up to three years old account for only about 7% of 2025 volume, the smallest near-new share in the European series, though they grow fastest of any age cohort at a 9.73% CAGR to about 10% by 2030. The four-to-six-year band holds about 12% and grows at 7.01%. Both cohorts depend on two sources that are now expanding: maturing domestic lease contracts, and a shift in the import mix toward younger vehicles, with imports under two years old rising about 14% during 2025.
Transactions below USD 10,000 account for about 58% of 2025 volume, the largest entry-tier concentration in the European series, and ease to about 50% by 2030 at a negative 0.59% CAGR. The USD 10,001 to USD 20,000 band holds about 31% of transactions and grows modestly at 1.08% annually. Together these bands represent about 89% of all transactions in 2025, which is the structural reason average transaction price sits at USD 8,214, second lowest of any market covered.
The USD 20,001 to USD 30,000 band grows at 8.95% annually from about 8% of volume to about 11%. Transactions above USD 30,000 grow at 25.79% annually, the fastest price-band growth recorded in any market in this series, rising from about 3% of volume to about 10% and reaching USD 7.14 billion by 2030. This expansion is driven jointly by the shift toward younger imports, by maturing ex-lease supply, and by rising Polish household incomes, and it is the principal reason value growth outpaces volume growth by more than two to one.
By Geography
Mazowieckie & Central Poland
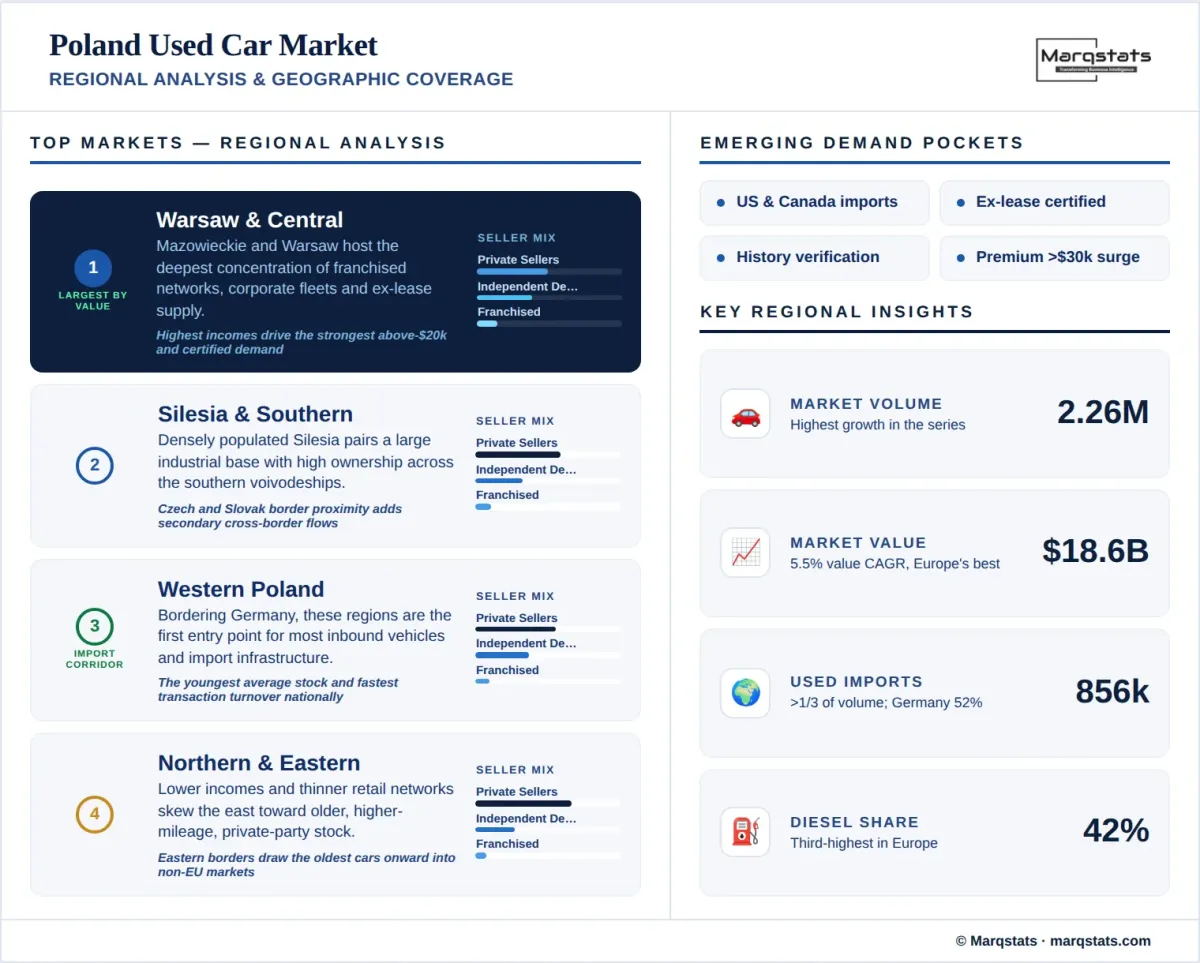
Mazowieckie, containing Warsaw, forms the largest regional market by value and hosts the deepest concentration of franchised networks, corporate fleets, and ex-lease supply in the country. Household incomes run well above the national average, giving the region the highest share of transactions above USD 20,000 and the strongest certified programme penetration. Łódzkie completes central Poland and functions as a national logistics hub, which supports vehicle distribution from the western import corridor toward eastern markets.
Silesia & Southern Poland
Śląskie forms the most densely populated region in Poland and combines a large industrial employment base with high vehicle ownership. Together with Małopolskie, Opolskie, Świętokrzyskie, and Podkarpackie, the southern regions account for a substantial share of national volume. Proximity to the Czech and Slovak borders supports secondary cross-border flows, and the regional mix skews toward older vehicles and the sub-USD 10,000 band outside the Kraków and Katowice metropolitan areas.
Western Poland
Wielkopolskie, Dolnośląskie, Lubuskie, and Zachodniopomorskie form the primary import corridor. Proximity to the German border makes these regions the first point of entry for the majority of inbound vehicles, and the concentration of import specialists, inspection facilities, and registration services here is far higher than the national average. Vehicles frequently enter, are prepared, and are sold within the region before moving eastward, giving western Poland both the youngest average stock and the fastest transaction turnover in the country.
Northern & Eastern Poland
Pomorskie, Kujawsko-Pomorskie, Warmińsko-Mazurskie, Podlaskie, and Lubelskie together account for a substantial share of national volume while contributing proportionally less value. The regional mix skews decisively toward older vehicles, higher mileage, and private-party transactions, reflecting lower household incomes and thinner professional retail networks outside Gdańsk. Eastern border proximity supports onward movement of older stock toward neighbouring non-European Union markets, which draws vehicles out of the domestic pool at the oldest end.
How Competition Is Evolving
The Poland used car market is fragmented and predominantly informal. Private-party transactions account for about 58% of 2025 volume, independent dealers and open-air markets for a further 32%, and manufacturer-franchised networks for only about 10%. No operator controls more than a low single-digit share. Formalisation is nonetheless advancing faster here than in most European markets, with certified transactions growing at 14.71% annually and franchised networks at 7.81%, both among the fastest rates covered, from among the lowest bases.
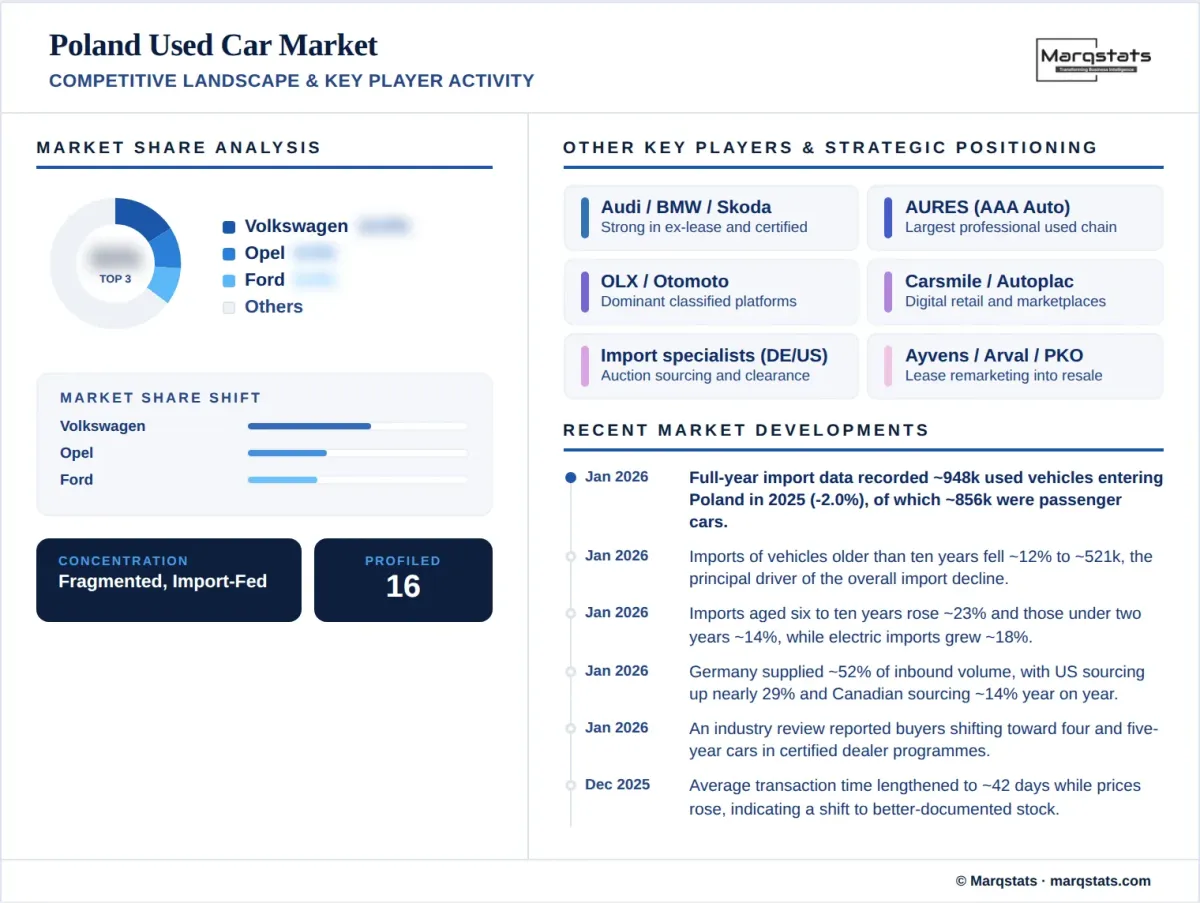
At brand level the ranking mirrors the import mix rather than domestic new-car registrations. Volkswagen leads, followed by Opel, Ford, Audi, and BMW, which together dominate inbound volume from Western Europe. The most frequently imported models are compact hatchbacks and lower-medium saloons from these marques. Škoda holds a strong position in the ex-lease and certified segments alongside Volkswagen, reflecting both domestic corporate fleet composition and regional manufacturing proximity. Brand share therefore reflects what Western European fleets were buying a decade ago, transmitted into Poland with a lag.
Import specialists form a competitive layer with no equivalent in the Western European markets. These operators source directly from German, French, Belgian, and increasingly North American auction and trade channels, manage transport, customs where applicable, technical inspection, and registration, and either sell directly or supply domestic dealers. Their margins depend on currency movement, source-market pricing, and regulatory friction rather than on domestic retail dynamics, and the recent growth in United States and Canadian sourcing reflects arbitrage opportunities in damaged and auction stock.
Competition among domestic retailers centres on provenance and trust. With a majority of stock imported and often carrying incomplete or foreign service history, vehicle history verification has become the principal differentiator rather than reconditioning or financing alone. Larger dealer chains draw on state registries, financial institution records, and central vehicle databases to document history, and this capability is what allows them to command a premium over the private and open-air channels. Average time to sale has lengthened and average prices have risen, indicating a market shifting toward higher-quality, better-documented stock.
Companies Covered
The report profiles 16+ companies with full strategy and financials analysis, including:
Recent Market Activity
Table of Contents
Coverage & Segmentation
This report provides a comprehensive assessment of the Poland used car market across a 2025 base year, historical data from 2021 to 2025, and forecasts spanning 2026 to 2030. Market sizing is presented in unit-volume terms and complemented by value analysis in United States dollars, with segmentation by vehicle type, propulsion type, seller type, sales channel, vehicle age, vehicle mileage, price band, certification status, vehicle positioning, and brand. The transaction layer counted is the passenger-car ownership transfer recorded domestically. Figures for 2021 to 2023 draw on published transfer series while 2024 and 2025 are independently estimated, and this is disclosed in the Report Summary.
The scope covers demand drivers, restraints, and structural trends, with particular focus on import dependence and the changing composition of inbound supply, the age and mileage profile of the traded fleet, the exceptional informality of the seller mix, rapid formalisation through certified and ex-lease programmes, and the role of vehicle history verification in a market dominated by imported stock. Readers examining Polish vehicle demand more broadly may also refer to the Poland two-wheeler market, which covers the same territory across a different vehicle class. An extended forecast to 2035 is available under customization for subscribers requiring a longer planning horizon, alongside deeper cuts by voivodeship, brand, or channel on request.