Market Snapshot
Key Takeaways
Market Overview & Analysis
Report Summary
The Mexico used car market comprises used passenger vehicle transactions recorded across all thirty-two federal entities in a calendar year, transacted through manufacturer-authorised networks, independent dealers and lots, digital platforms, and direct private-party sales. This study segments demand by vehicle type, propulsion type, seller type, sales channel, vehicle age, vehicle mileage, price band, certification status, vehicle positioning, and brand, with a 2025 base year, historical coverage from 2021 to 2025, and forecasts to 2030.
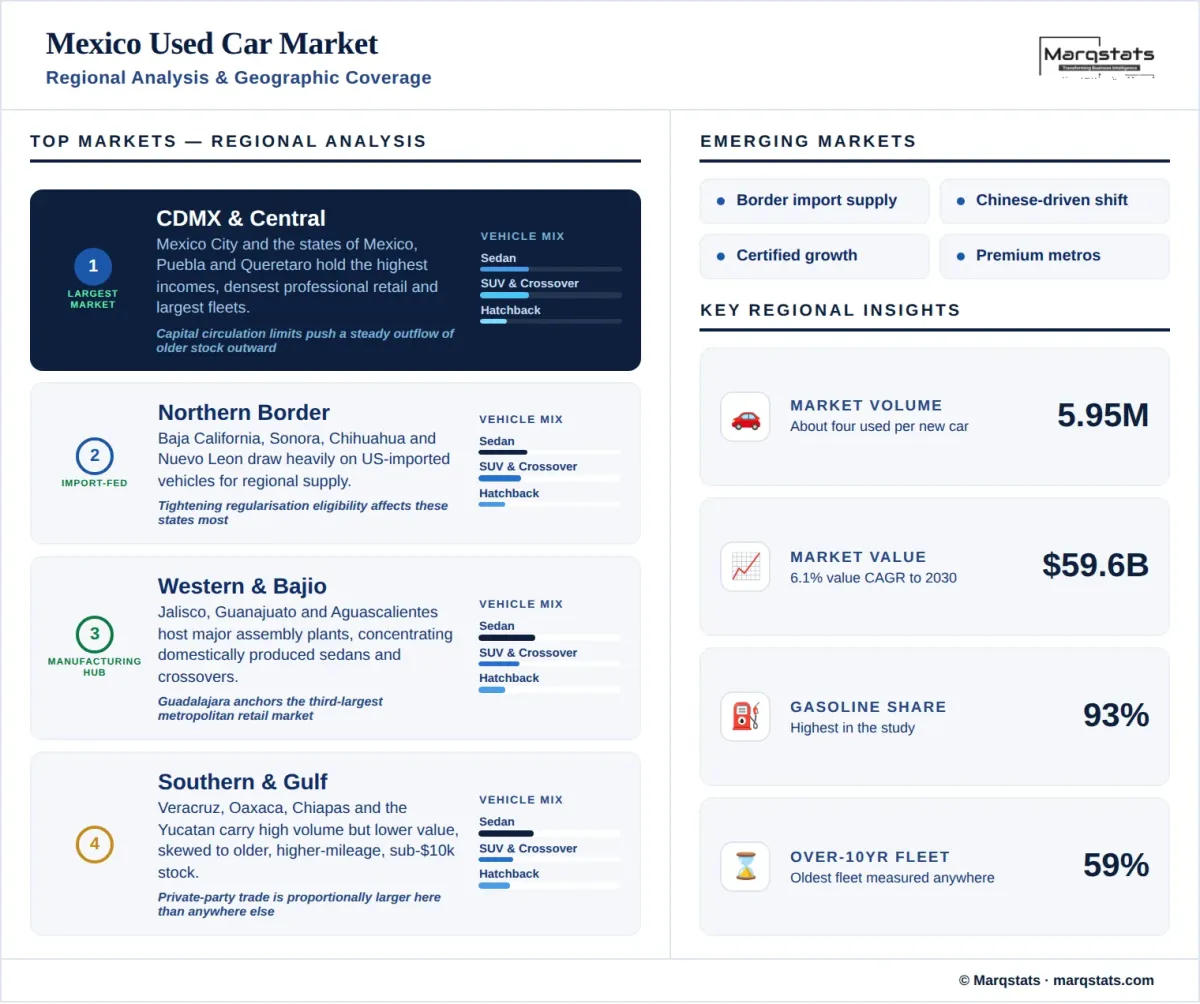
The used-to-new ratio is the clearest indicator of how this market functions. New light-vehicle sales reached about 1.52 million units in 2025, against 5.95 million used transactions, giving a ratio close to four to one. Dealer association reporting places the same measure at about 3.6 to one in 2024 rising to four to one in 2025, with the gap expected to widen further. New-vehicle sales fell about 6.4% across the first three quarters of 2025 while used transactions rose about 2.5%, and that divergence is the central dynamic of the market.
Import regularisation requires careful handling because the public record is not consistent. A decree originally issued in 2022 allowed legalisation of irregularly imported used vehicles, and cumulative regularisations reached more than 2.5 million by late 2024 and roughly 2.99 million by late 2025. Some reporting describes the programme as definitively ended in January 2026 with future imports required to follow trade-agreement rules. Other reporting describes an extension through November 2026 under substantially narrowed criteria, with luxury, sports, armoured and convertible vehicles excluded and the scheme refocused on basic mobility. Both accounts agree that the broad amnesty closed and eligibility tightened.
Chinese brands have had an indirect effect worth noting. Their entry into the new-vehicle market brought attractive headline prices, however concerns over after-sales service coverage, technician availability and parts lead times have pushed a portion of buyers toward established used models instead. That dynamic reinforces the market's existing preference for domestically produced Nissan, Chevrolet and Volkswagen models with deep parts availability and service networks.
Market Dynamics
Key Drivers
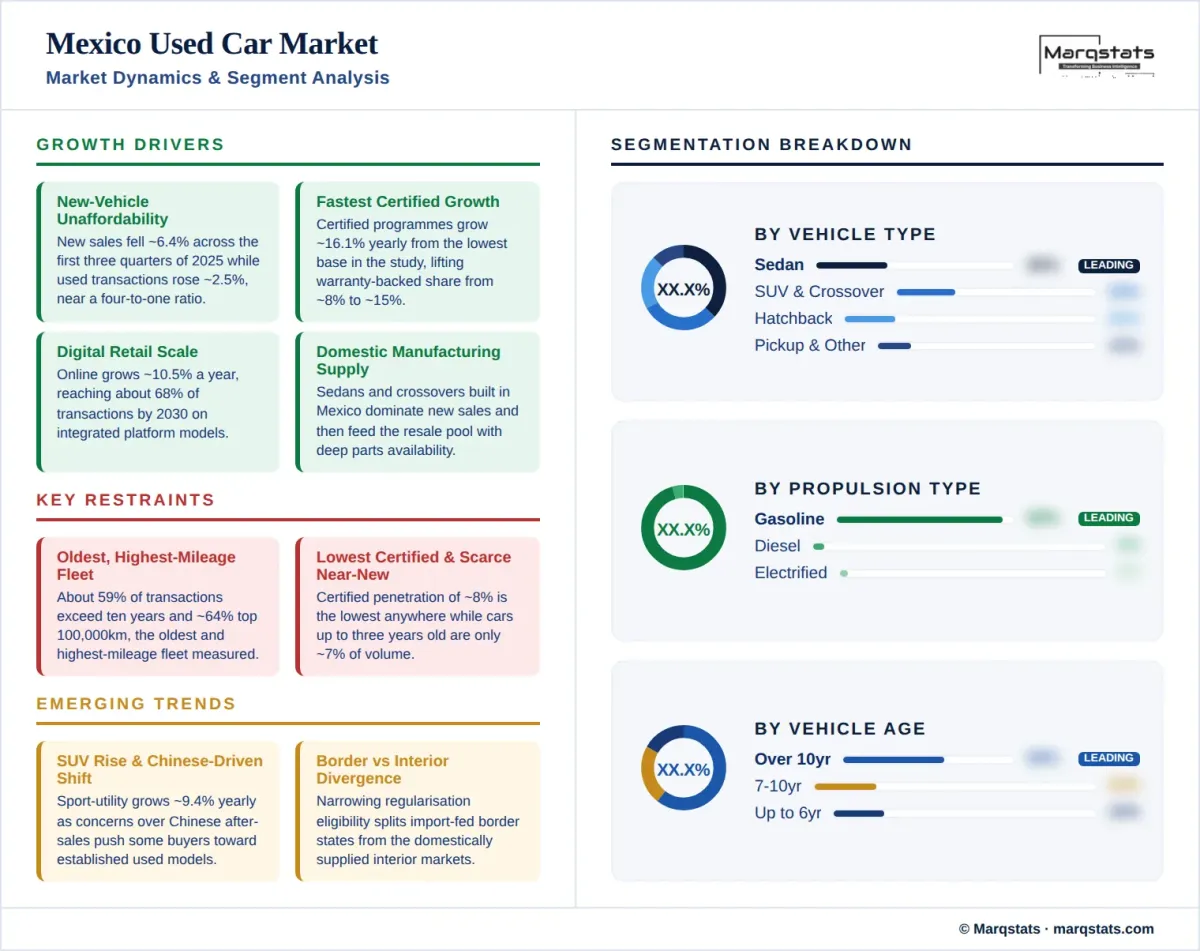
- New-vehicle unaffordability redirects demand, with new sales falling about 6.4% across the first three quarters of 2025 while used transactions rose about 2.5%.
- Certified programmes grow at a 16.13% CAGR from the lowest base in this study, lifting warranty-backed share from about 8% to about 15% by 2030.
- Digital and omnichannel retail scales at a 10.49% CAGR, reaching about 68% of transactions by 2030.
- Manufacturer-authorised networks grow at a 12.39% CAGR as original-equipment manufacturers formalise used operations from a small base.
- Domestic manufacturing supplies the resale pool, as sedans and crossovers built in Mexico dominate both new sales and subsequent used supply.
Key Restraints
- The traded fleet is the oldest in this study, with about 59% of transactions involving vehicles over ten years old and about 64% above 100 thousand kilometres.
- Certified penetration of about 8% is the lowest measured anywhere, leaving most transactions without warranty or structured finance.
- Near-new supply is scarce, with vehicles up to three years old accounting for only about 7% of volume.
- Regularisation policy changes create uncertainty in border-state markets where imported vehicles form a substantial share of supply.
Key Trends
- Sport-utility and crossover share grows at a 9.43% CAGR, the fastest body-style growth in the market, reaching about 39% of transactions by 2030.
- Chinese new-vehicle entry has redirected some demand toward established used models on after-sales and parts availability concerns.
- Border-state and interior markets are diverging as regularisation eligibility narrows.
- Regional platform operators headquartered in Mexico have extended across Latin America while retaining the domestic market as their largest.
Market Segmentation
Sedans account for about 36% of 2025 volume, the largest body type and a share exceeded only in China, Türkiye and Russia among the markets covered. The concentration follows directly from domestic manufacturing, as compact and mid-size sedans produced in central Mexico have dominated new-vehicle sales for years and now supply the resale pool with deep parts availability and low maintenance costs. The segment contracts marginally at 0.44% annually to about 30% by 2030. Hatchbacks hold about 20% of transactions and contract at 1.28%.
Sport-utility and crossover models account for about 29% of 2025 volume and grow at a 9.43% CAGR, the fastest body-style growth in the market, reaching about 39% by 2030. Crossovers assembled domestically have gained share in new sales over the past decade and are now working through into resale. Pickup trucks hold about 10% of transactions, a share exceeded only in North America and Brazil, and grow at 4.33% annually, supported by agricultural and small-business demand across the northern and central states.
Gasoline accounts for about 93% of 2025 volume, the highest concentration of any market in this study, and grows at 1.33% annually in absolute terms while falling to about 84% of share by 2030. Diesel holds only about 3.5% of transactions, concentrated in pickups and commercial-adjacent vehicles rather than passenger cars. The near-absence of diesel means Mexico's propulsion transition runs directly from gasoline to electrified without the diesel decline phase that characterises European markets.
Battery-electric transfers grow from roughly 30 thousand units in 2025 to roughly 173 thousand by 2030, a 33.39% CAGR that lifts share from about 0.5% to about 2.5%. Hybrids grow at 27.60% annually to about 8% of volume and plug-in hybrids at 25.01% to about 1.2%. All electrified segments start from among the smallest bases in this study, and their expansion depends on recent new-vehicle electrification reaching resale age from 2028. Combined electrified share reaches about 12% of transactions by 2030.
Private sellers handle about 62% of 2025 transactions, the second-highest informal share of any market in this study after Russia, and contract at a negative 1.11% CAGR to about 50% by 2030. The concentration follows from the age and value profile of the traded fleet, since vehicles averaging well over a decade old rarely justify professional reconditioning or warranty cover. Digital classified platforms carry much of this volume and have extended into valuation and inspection services.
Independent dealers and professional retailers hold about 29% of 2025 volume and grow at a 7.79% CAGR to about 36% by 2030. Manufacturer-authorised networks hold only about 9% of transactions and grow at a 12.39% CAGR to about 14%. Certified and warranty-backed transactions grow at 16.13% annually from about 8% of the market to about 15%, the fastest certification growth rate measured in this study though from the smallest base of any market covered.
Online and omnichannel transactions hold about 48% of 2025 volume and grow at a 10.49% CAGR to about 68% by 2030. Mexico hosts the headquarters of the largest pan-regional used-vehicle platform in Latin America, which combines inspection, reconditioning, financing and delivery within an integrated model and has expanded across six national markets while retaining Mexico as its largest. Established classified platforms provide the broader discovery layer for private and professional sellers alike.
Offline transactions hold about 52% of 2025 volume and decline at a negative 6.63% CAGR to about 32% by 2030. Physical channels retain importance for older and lower-value stock, for in-person inspection where documentation is incomplete, and for the registration and transfer processing that Mexican ownership change requires. Border-state lots handling imported vehicles form a distinct sub-channel whose supply depends directly on regularisation eligibility.
Vehicles older than ten years account for about 59% of 2025 transactions, the highest older-vehicle concentration of any market in this study, and hold broadly flat in absolute terms at a negative 0.09% CAGR while falling to about 50% of share by 2030. Vehicles aged seven to ten years hold about 22% and grow at 5.12% annually. Together these cohorts represent about 81% of national volume. Vehicles above 100 thousand kilometres account for about 64% of transactions, also the highest mileage profile measured anywhere.
Vehicles up to three years old account for only about 7% of 2025 volume, the smallest near-new share of any market covered, though they grow fastest of any age cohort at a 10.66% CAGR to about 10% by 2030. The four-to-six-year cohort holds about 12% and grows at 9.25% to about 16%. Both cohorts depend on new-vehicle sales recovering and on rental and corporate fleet disposals, which remain a smaller organised supply channel here than in Brazil.
Transactions below USD 10,000 account for about 36% of 2025 volume and contract at a negative 2.60% CAGR to about 27% by 2030. The USD 10,001 to USD 20,000 band is the volume core at about 42% of transactions, the largest single price band share of any market in this study, and grows at 2.32% annually. Together these bands carry about 78% of national volume, and average transaction price sits at USD 10,013, slightly above the Latin American regional average.
The USD 20,001 to USD 30,000 band grows at 10.25% annually from about 15% of volume to about 21%. Transactions above USD 30,000 grow at 14.35% annually, rising from about 7% of volume to about 12% and reaching USD 21.50 billion by 2030. Premium and luxury vehicles grow at 8.30% annually from about 11% of transactions to about 14%, concentrated in Mexico City, Monterrey and Guadalajara where household incomes and certified retail are most developed.
By Geography
Mexico City & Central Mexico
The Mexico City metropolitan area and the surrounding states of México, Puebla, Querétaro and Hidalgo form the largest regional market by both volume and value. The region concentrates the highest household incomes, the densest professional retail and certified programme coverage, and the largest corporate fleet base. Vehicle circulation restrictions in the capital, which limit older and higher-emitting vehicles on designated days, shape local replacement cycles and push a steady outflow of older stock into surrounding states.
Northern Border States
Baja California, Sonora, Chihuahua, Coahuila, Nuevo León and Tamaulipas form a market shaped directly by proximity to the United States. Imported used vehicles have historically supplied a substantial share of regional volume, and the tightening of regularisation eligibility at the turn of 2026 affects these states more than any others. Monterrey provides a high-income metropolitan counterweight with stronger certified and premium penetration than the border average.
Western & Bajío Mexico
Jalisco, Guanajuato, Aguascalientes, Michoacán and San Luis Potosí form the country's automotive manufacturing heartland, hosting assembly plants for several of the highest-volume domestic models. The region shows an unusually high concentration of locally produced sedans and crossovers in its used mix, alongside strong pickup demand from agricultural districts. Guadalajara supports the third-largest metropolitan retail market in the country.
Southern & Gulf Mexico
Veracruz, Oaxaca, Chiapas, Guerrero, Tabasco and the Yucatán peninsula account for a substantial share of national volume while contributing proportionally less value. The regional mix skews decisively toward vehicles over ten years old, higher mileage and the sub-USD 10,000 price band, reflecting lower household incomes and the thinnest professional retail coverage in the country. Private-party transactions are proportionally more significant here than in any other region.
How Competition Is Evolving
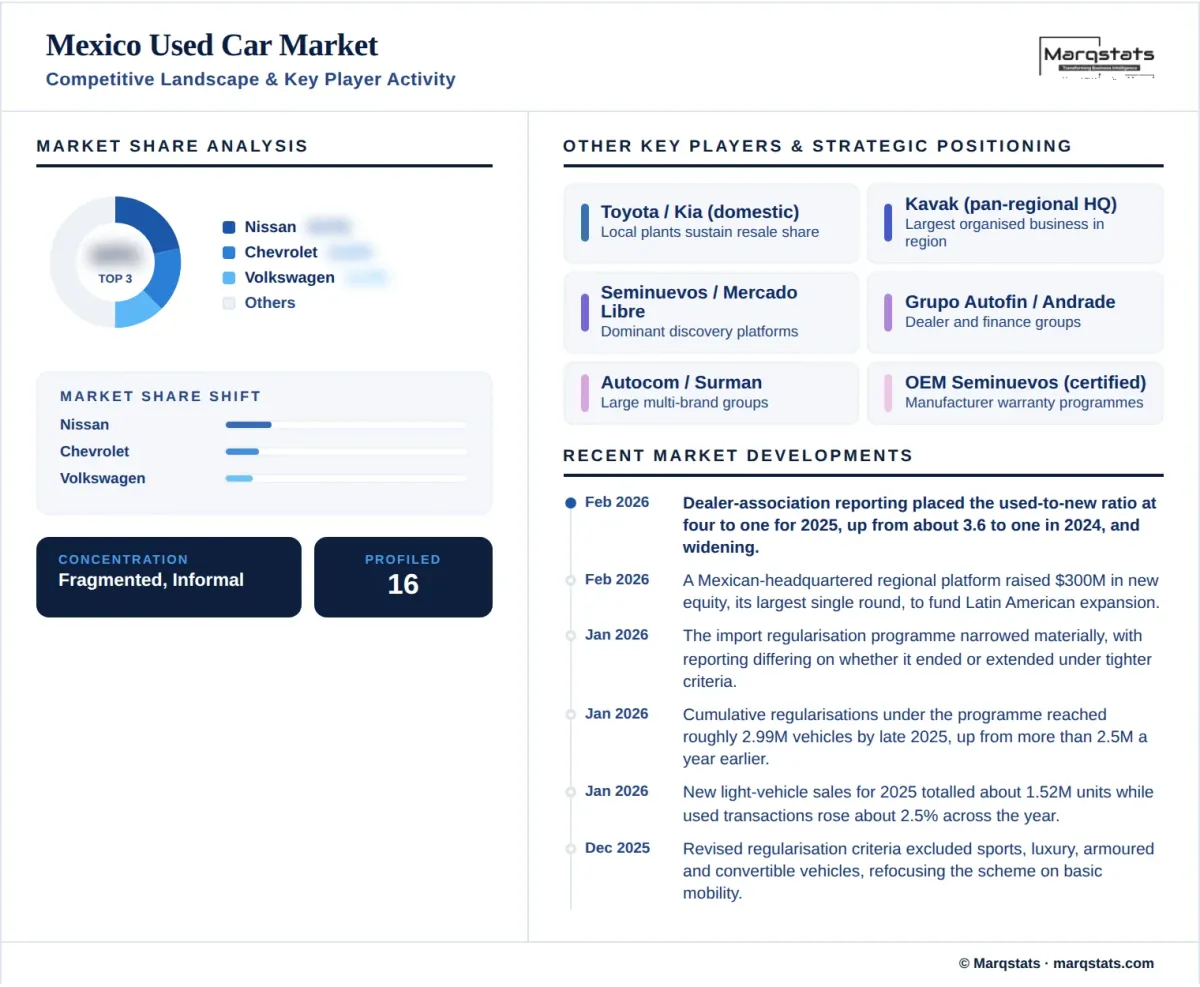
The Mexico used car market is fragmented and predominantly informal. Private-party transactions account for about 62% of 2025 volume, independent dealers and lots for about 29%, and manufacturer-authorised networks for only about 9%. No operator holds more than a low single-digit share of national transactions. Certified penetration of about 8% is the lowest of any market in this study, which makes the 16.13% certification growth rate both the fastest measured and the one operating from the smallest base.
Brand structure reflects domestic manufacturing more directly than in most markets. Nissan leads with about 19% of used transactions, the highest single-brand share in Latin America, supported by compact and mid-size sedans produced in central Mexico that have dominated new sales for years. Chevrolet follows at about 14% and Volkswagen at about 11%, both also with substantial domestic assembly. Kia holds about 6.5%, reflecting its Mexican plant, and Toyota about 8%.
The most significant competitive development is the emergence of a Mexican-headquartered platform operator that has become the largest organised used-vehicle business in Latin America. It combines inspection, reconditioning, financing and delivery within a single model, operates across six regional markets while retaining Mexico as its largest, reached its first month of consolidated global profitability in December 2025, and finances more than half of its own platform transactions through an in-house lending arm.
Competition centres on financing and provenance rather than on inventory. With formal credit penetration limited and the traded fleet averaging well over a decade old, operators able to underwrite their own transactions and verify vehicle history capture volume that would otherwise remain informal. Border-state operators handling imported vehicles form a distinct competitive layer whose economics depend on regularisation eligibility and cross-border price differentials rather than on domestic retail dynamics.
Companies Covered
The report profiles 16+ companies with full strategy and financials analysis, including:
Recent Market Activity
Table of Contents
Coverage & Segmentation
This report provides a comprehensive assessment of the Mexico used car market across a 2025 base year, historical data from 2021 to 2025, and forecasts spanning 2026 to 2030. Market sizing is presented in unit-volume terms and complemented by value analysis in United States dollars converted from a Mexican peso base. Segmentation covers ten dimensions. The transaction layer counted is the total used passenger vehicle transaction including private-party sales, which is materially wider than organised retail volume given that roughly 62% of the market moves outside professional channels.
The scope covers demand drivers, restraints and structural trends, with particular focus on the used-to-new ratio, the age and mileage profile of the traded fleet, import regularisation policy and its border-state effects, the lowest certified penetration in this study, and the pan-regional platform model headquartered in Mexico. Comparative benchmarking against the region's largest market is available in the Brazil used car market report. An extended forecast to 2035 is available under customization, alongside state-level breakouts on request.