Market Snapshot
Middle bar: base-year value × (1 + CAGR), rounded to two decimals. This is a calculated illustration, not a separately researched annual estimate.
Market Size (2025, Base Year): USD 6.75 Million
Estimated Value (2026): USD 11.63 Million
Forecast Value (2030): USD 33.97 Million
CAGR: 38.17% | Forecast Period: 2026 – 2030
Growth — Absolute: USD 27.22 Million
Largest Market: Gauteng (46.47% of 2025 maintenance spend)
Fastest Growing: Independent Service Providers (15.95% to 25.00% share, 2025-2030)
Dominant Segment: Franchised OEM Dealerships (74.04% channel share, 2025)
Market Concentration: Moderately Fragmented
Base Year: 2025 | Historical Period: 2021 – 2025 | Forecast Period: 2026 – 2030
Units Considered: Value (USD Million)
Segments Covered: 3 | Regions Covered: 5 | Companies Profiled: 14
Report Pages: 240 | Deliverables: PDF, Excel, PPT
Key Takeaways
Market Overview & Analysis
Report Summary
This analysis reads South Africa's own fully worked sizing chain, provincial distribution data, and named-scenario fiscal framework together as a single coherent picture rather than isolated data points, since the underlying research itself was structured to support exactly that kind of integrated reading.
South Africa's EV maintenance market is measured across mechanical wear components, high-voltage battery and powertrain servicing, and diagnostics/calibration, valued at USD 6.75 million (ZAR 124.80 million) in 2025. This figure is taken directly from the underlying research's own fully worked sizing chain, anchored to naamsa sales data and eNaTIS registration records covering 9,250 active plug-in vehicles.
Structurally, this is a market shaped by a genuine fiscal policy reversal -- an EV import tariff higher than the ICE baseline -- alongside a severe certified-technician shortage the national Electromobility Occupational Skills Programme is only beginning to close, and a commercial transit sector (electric buses, minibus taxis, last-mile logistics) demonstrating concrete total-cost-of-ownership advantages ahead of private passenger adoption.
The analysis is built for four reader types making different decisions: an independent workshop operator weighing Competition Commission Right-to-Repair protections against high-voltage certification investment, a transit operator like Golden Arrow Bus Services scaling depot-based fleet maintenance, a franchised dealer group defending warranty-anchored revenue, and an investor tracking how the 25% EV tariff resolution shapes this market's Policy-Accelerated-to-Constrained scenario range.
A Tariff Structure That Actively Works Against the Market It's Supposedly Building
Most governments trying to grow domestic EV adoption lower the cost of importing electric vehicles relative to combustion ones. South Africa's current policy does the opposite, and it's worth understanding just how directly that shapes this market's entire forecast range.
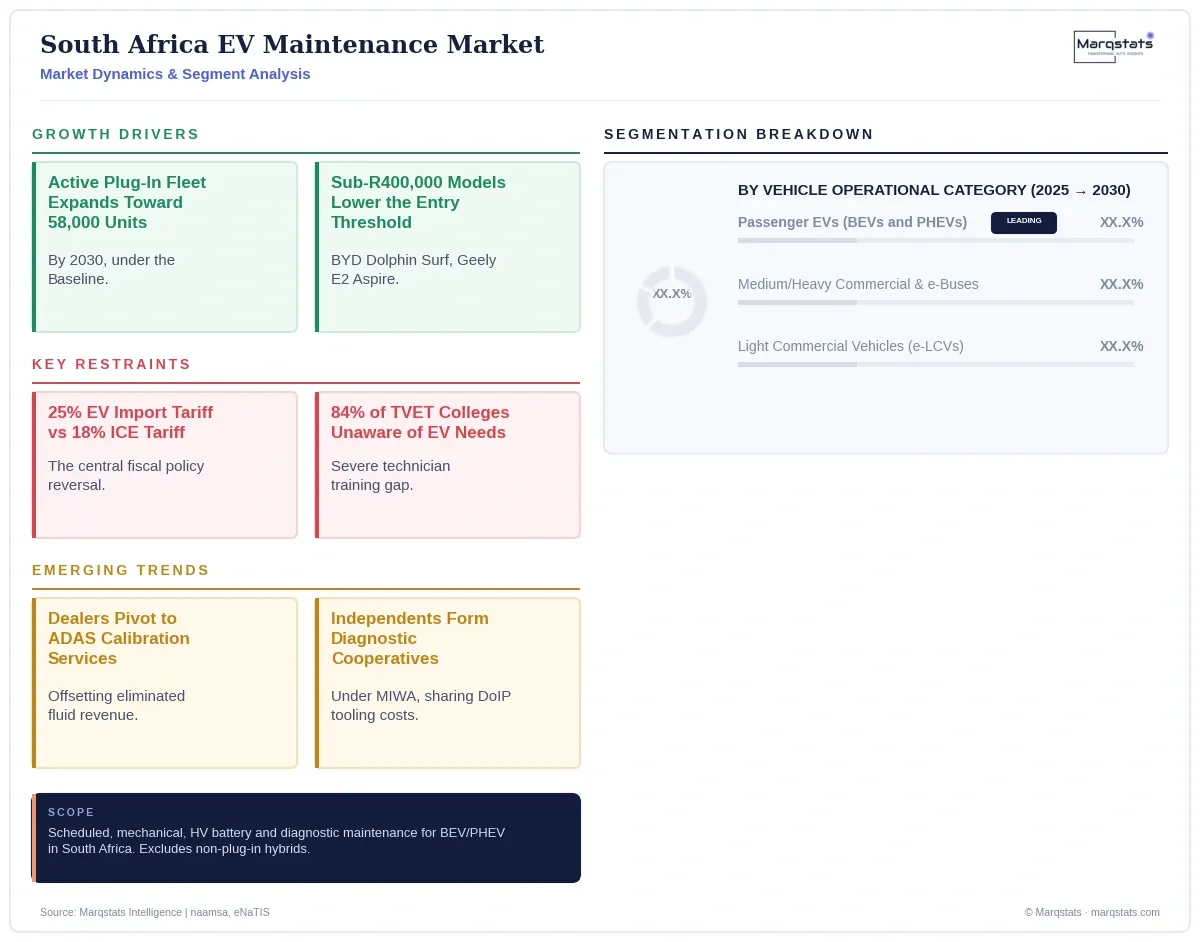
Electric vehicles carry a 25% import tariff. Internal combustion vehicles carry 18%. That's not a rounding difference -- it's a structural cost penalty on the exact vehicle category the country's own Electric Vehicle White Paper is trying to grow. The underlying research doesn't treat this as a footnote either: it's the single named trigger separating a R845.0 million 2030 outcome from a R430.0 million one, nearly a two-fold swing in market size resting on one fiscal policy decision the National Treasury has not yet made.
Why South Africa's Real EV Cost Story Might Be About Minibus Taxis, Not Sedans
Passenger EV adoption in South Africa is still constrained by affordability and tariff disparities. But the underlying research surfaces a genuinely different angle on where electrification's cost case is strongest, and it's not where most coverage focuses.
An electric minibus taxi alternative runs at roughly R1.20 per kilometer, against R6.07 for a diesel equivalent -- combining fuel and maintenance costs into a single operating figure that's nearly 80% lower. Minibus taxis are South Africa's dominant public transit mode by passenger volume, meaning the strongest total-cost-of-ownership case for electrification in this country may not be in the premium passenger segment garnering most attention, but in the informal transit sector that moves the majority of South African commuters daily.
Market Dynamics
Key Drivers
- South Africa's Eskom electricity tariff structure, despite April 2026's 8.76% commercial supply adjustment, still leaves overnight depot AC charging at roughly R4.50/kWh well below public DC fast-charging rates exceeding R8.00/kWh, directly reinforcing the economic case for depot-based commercial fleet charging and maintenance infrastructure.
- South Africa's own regional data shows a meaningful gap between where corporate fleet vehicles are registered and where they actually circulate, since leasing fleets registered under Gauteng head offices disperse a documented share of real-world commercial bus and delivery operating activity into the Western Cape and coastal logistics corridors, sustaining service demand pure registration data alone would understate.
- South Africa's own fully worked sizing chain shows mechanical wear components already the single largest technical category at 50.48% of total value, a structural signal that specialized EV-rated tire inventory and suspension repair capability represent the most immediate revenue opportunity for workshops entering this market.
- South Africa's active plug-in fleet is expanding rapidly, from 9,250 units in 2025 toward a projected 58,000 units by 2030 under the Baseline Managed Case, directly growing the addressable base for recurring EV aftermarket maintenance demand.
- Commercial introduction of accessible models priced below R400,000, including the BYD Dolphin Surf and Geely E2 Aspire, is directly accelerating private passenger adoption ahead of prior-year trajectories.
- Golden Arrow Bus Services' documented lifetime savings exceeding R650,000 per bus annually, and Takealot's verified 12.75% average monthly TCO reduction with JAC N75 electric trucks, are demonstrating concrete commercial fleet electrification returns.
- The APDP Phase II's 150% tax deduction on qualifying electric and hydrogen vehicle production capital investments, effective March 1, 2026, is directly stimulating local assembly and the domestic supply chain for high-voltage replacement parts.
- The Competition Commission's Automotive Aftermarket Guidelines, effective July 1, 2021, mandating OEM technical data access for accredited independent workshops, are directly supporting independent aftermarket capacity expansion.
Key Restraints
- South Africa's lack of any commercial-scale battery recycling or remanufacturing facility means degraded traction battery packs are typically exported back to overseas parent factories or diverted into private stationary solar storage applications, restricting transparent domestic cost and volume data for end-of-life battery processing.
- South Africa's persistent shortage of certified high-voltage technicians genuinely constrains near-term independent workshop capacity, since QCTO Level 2 through Level 4 certification requires meaningful training investment beyond standard automotive vocational curricula, a gap the national Electromobility Occupational Skills Programme is only beginning to close at scale.
- This market's own three-scenario framework spans a genuinely wide 2030 range, from USD 23.24 million under the Constrained Infrastructure and Tariff Lag Scenario to USD 45.68 million under the Policy-Accelerated Scenario -- a disclosed spread reflecting real uncertainty in a single fiscal policy decision the National Treasury has not yet made, not a narrow band around a single central estimate.
- South Africa's 25% import tariff on electric vehicles versus 18% on internal combustion platforms structurally elevates EV retail prices, directly constraining private passenger adoption relative to markets with EV-favorable tariff structures.
- RMI industry surveys found 84% of TVET colleges unaware of the specific technical proficiencies electric drivetrains require, and nearly 90% of technical lecturers lacking formal high-voltage training, a severe labor pipeline constraint the national skills programme is only beginning to address.
- Vehicle manufacturers increasingly protect diagnostic networks using proprietary cryptographic security gateways, meaning independent workshops cannot fully track component failure rates without expensive, recurring brand-specific cloud subscriptions despite Competition Commission data-access mandates.
- Under the Constrained Tariff Lag Scenario, continued National Treasury retention of the 25% import tariff through 2028 alongside municipal grid capacity delays could reduce the 2030 fleet to just 39,000 units, a genuinely material reduction from the Baseline Managed Case's 58,000 units.
Key Trends
- Regional service capacity is beginning to diverge sharply between Gauteng's premium dealership network and the Western Cape's commercial transit depot ecosystem, raising genuine open questions about whether that provincial specialization will persist or converge as the passenger EV segment scales toward 2030.
- Fleet operators managing high-mileage commercial delivery vans from brands like JAC and Maxus are increasingly negotiating dedicated maintenance contracts directly with fleet-focused service providers, given the documented intense stop-and-go wear patterns these last-mile logistics platforms experience under Takealot-style urban delivery cycles.
- Franchised dealers are pivoting workshop revenue models toward ADAS sensor calibrations, structural battery enclosure repairs, and high-voltage thermal loop maintenance as eliminated conventional fluid services erode traditional service-bay revenue.
- Independent repairers represented by MIWA are forming diagnostic cooperatives to share multi-brand DoIP scan tool costs, dedicated de-energization bays, and professional liability insurance required under Competition Commission guidelines.
- Fleet operators are establishing direct technical partnerships with manufacturers, enabling in-house depot mechanics to attain accredited high-voltage certifications while preserving OEM warranty coverage on core battery packs.
- Commercial fleets are shifting toward smart AC depot charging with dynamic load balancing over uncontrolled DC fast charging, directly reducing battery cell degradation and thermal management strain.
Strategic Implications
- Component suppliers should also weight EV-specific tire and thermal coolant inventory planning heavily nationwide, given how directly both categories anchor this market's largest documented service revenue drivers.
- Independent workshop operators should prioritize QCTO/merSETA Level 2 through Level 4 electromobility certification investment specifically, positioning ahead of the wave of Asian and European plug-in vehicles exiting factory warranty periods.
- Franchised dealership networks should introduce competitive unbundled service and maintenance contracts at the point of sale specifically, given how directly Competition Commission guidelines now allow customers to choose independent service providers without voiding warranty coverage.
- Commercial fleet operators and transit agencies should prioritize smart AC depot charging with dynamic load balancing specifically, given how directly uncontrolled DC fast charging accelerates battery degradation and increases maintenance strain.
- Investors and analysts should track Phase Two Electric Vehicle White Paper gazetting timing across the country and merSETA/QCTO certified technician graduation rates as the two clearest variables separating this market's Policy-Accelerated and Constrained Tariff Lag scenarios.
Outlook
The underlying research presents three genuinely distinct trajectories diverging on named fiscal and regulatory trigger conditions. This market's own forecast horizon reaches 2030 directly, requiring no Marqstats extrapolation.
Under the Baseline Managed Case, gradual Chinese model entry, structured commercial bus adoption, and steady training rollout proceed without a major tariff policy shift; the active plug-in fleet reaches 58,000 units by 2030, generating USD 33.97 million (ZAR 628.50 million) in total market value at a 38.17% CAGR.
Under the Policy-Accelerated Scenario, the Department of Trade, Industry and Competition gazettes Phase Two of the Electric Vehicle White Paper by late 2026, equalizing import duties on electric vehicles from 25% down to the 18% ICE baseline, combined with the APDP's 150% investment allowance stimulating local assembly across at least three OEM plants by 2027 and merSETA/QCTO graduating more than 1,500 certified electromobility technicians by early 2028; the active fleet expands to 78,000 units by 2030, lifting total market value to USD 45.68 million (ZAR 845.00 million).
Under the Constrained Infrastructure and Tariff Lag Scenario, the National Treasury retains the 25% ad valorem import tariff on electric vehicles through 2028 to protect fiscal customs revenues, OEM diagnostic gateways remain tightly locked behind proprietary firewalls, and localized distribution grid capacity constraints delay high-power commercial charging depot installations; the active fleet reaches only 39,000 units by 2030, with total market value reaching only USD 23.24 million (ZAR 430.00 million).
Market Segmentation
USD 4.22 million (62.50% share) in 2025, growing to USD 18.68 million (55.00% share) by 2030. Anchored by Volvo EX30, BMW iX/X1, BYD Dolphin and Chery Tiggo PHEVs.
USD 1.18 million (17.50% share) in 2025, growing to USD 7.47 million (22.00% share) by 2030. The fastest-growing category, anchored by JAC N75 EV and Takealot logistics.
USD 1.35 million (20.00% share) in 2025, growing to USD 7.81 million (23.00% share) by 2030. Anchored by Golden Arrow's BYD K9/B12 fleet and MAN Lion's Explorer eBus.
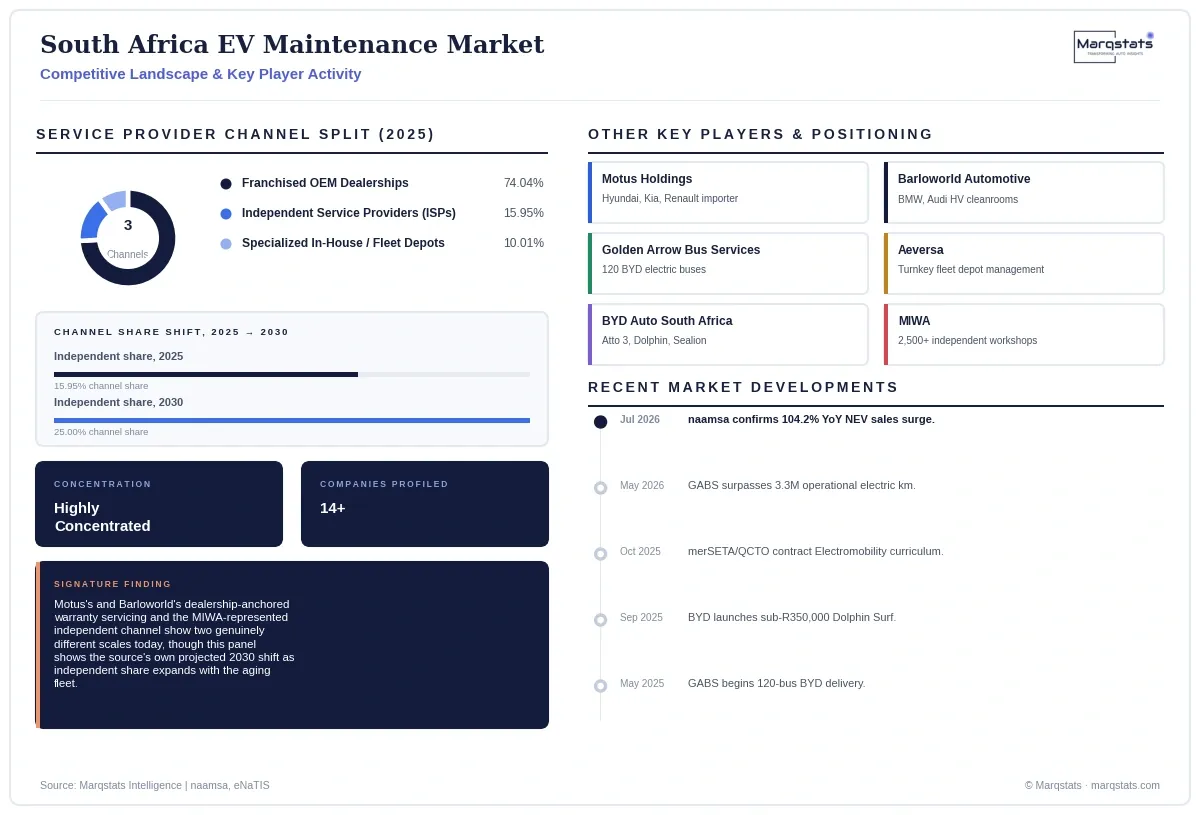
USD 5.00 million (74.04% share) in 2025, growing to USD 19.70 million (58.00% share) by 2030. Anchored by Motus, Barloworld, Super Group and CMH, sustained by 8-year warranties.
USD 1.08 million (15.95% share) in 2025, growing to USD 8.49 million (25.00% share) by 2030. The fastest-growing channel, protected by Competition Commission Right-to-Repair guidelines.
USD 0.68 million (10.01% share) in 2025, growing to USD 5.77 million (17.00% share) by 2030. Anchored by Golden Arrow Bus Services and Takealot delivery hubs.
USD 3.41 million (50.48% share) in 2025, growing to USD 14.61 million (43.00% share) by 2030. The largest category, driven by EV-rated tire replacement and suspension overhauls.
USD 1.85 million (27.48% share) in 2025, growing to USD 10.53 million (31.00% share) by 2030. Anchored by dielectric coolant purges, module balancing and inverter inspections.
USD 1.49 million (22.04% share) in 2025, growing to USD 8.83 million (26.00% share) by 2030. The fastest-growing category, anchored by ADAS calibration and DoIP network scans.
By Geography
Gauteng
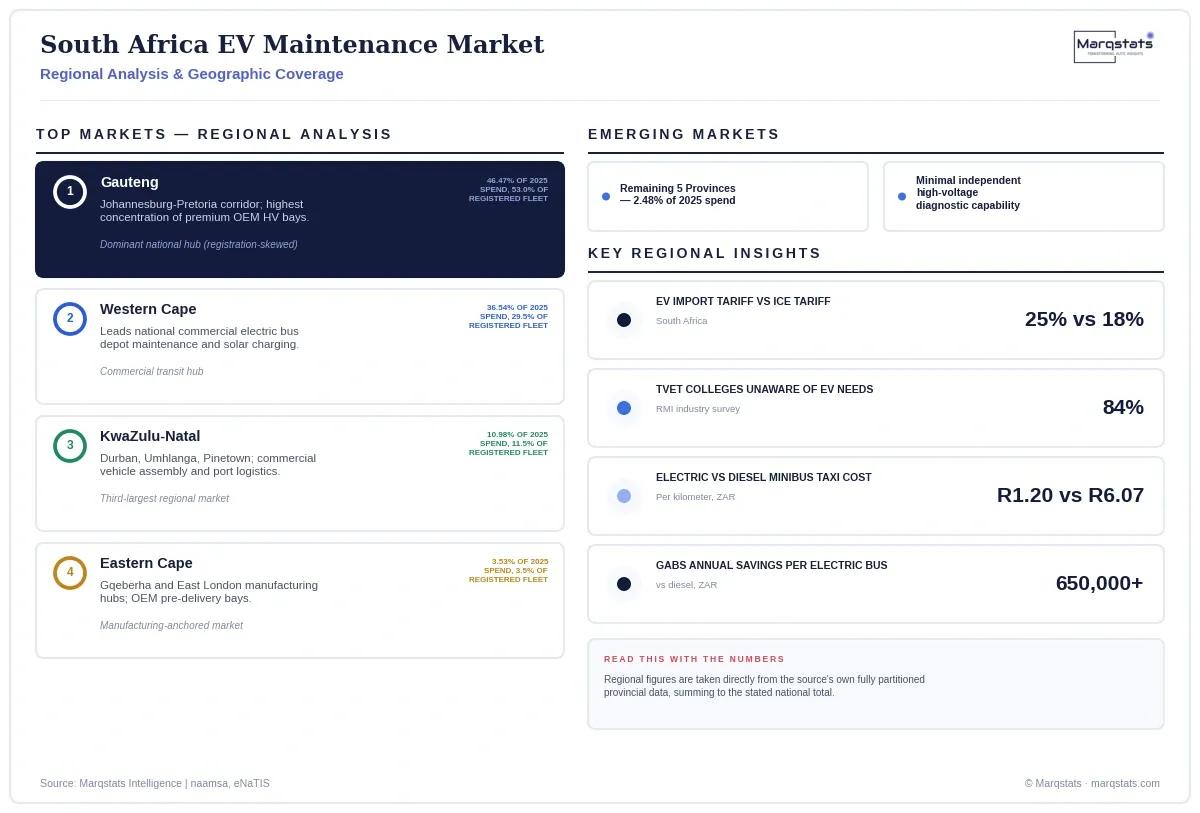
46.47% of 2025 maintenance spend (53.0% of registered fleet), centered on the Johannesburg-Pretoria corridor with the highest concentration of premium OEM high-voltage workshop bays, though a registration clustering effect inflates the region's apparent share since corporate leasing companies register fleets at Gauteng head offices.
Western Cape
36.54% of 2025 maintenance spend (29.5% of registered fleet), leading national expenditure in commercial electric bus depot maintenance and solar charging integration across Greater Cape Town.
KwaZulu-Natal
10.98% of 2025 maintenance spend (11.5% of registered fleet), anchored by commercial vehicle assembly and localized port logistics maintenance in Durban, Umhlanga and Pinetown.
Eastern Cape
3.53% of 2025 maintenance spend (3.5% of registered fleet), with service capacity largely limited to OEM pre-delivery inspection bays around the Gqeberha and East London manufacturing hubs.
Remaining 5 Provinces
2.48% of 2025 maintenance spend (2.5% of registered fleet), spanning sparse transit corridor support across the Free State, Mpumalanga, Limpopo, North West and Northern Cape with minimal independent high-voltage diagnostic capability.
How Competition Is Evolving
Overall market concentration is genuinely expected to shift somewhat by 2030.
No single company in this market spans franchised warranty-anchored dealership servicing, specialized commercial fleet depot operation, and independent multi-brand workshop capability simultaneously, leaving genuine competitive white space for any group capable of bridging Motus's and Barloworld's dealership-anchored warranty servicing with the independent channels this market's own scenario framework shows expanding sharply by 2030.
Competition spans listed franchised dealer conglomerates, specialized fleet management providers, and independent trade associations. Motus Holdings operates South Africa's largest automotive retail network as exclusive importer of Hyundai, Kia and Renault. Barloworld Automotive maintains certified high-voltage cleanrooms for BMW and Audi. Super Group and Combined Motor Holdings (CMH) are expanding into Chinese EV franchises including BYD and GWM. Golden Arrow Bus Services operates the largest commercial high-voltage fleet workshop in Southern Africa, managing 120 BYD electric buses with solar-tied charging. Aeversa provides turnkey commercial EV depot maintenance and predictive charging infrastructure for corporate logistics fleets.
On the independent side, the Motor Industry Workshop Association (MIWA) represents over 2,500 independent workshop owners lobbying for OEM technical data access, supported by Right to Repair South Africa (R2RSA), which monitors Competition Commission Aftermarket Guidelines compliance. The Automobile Association of South Africa (AA) delivers QCTO-registered auto-electrician certifications incorporating EV safety. Regulatory oversight rests with the Competition Commission (aftermarket guidelines), QCTO/merSETA (technician certification), and the dtic (industrial policy and tariff structure).
Companies Covered
Companies covered in the report include:
Recent Market Activity
Table of Contents
Coverage & Segmentation
The analysis measures scheduled servicing, diagnostic software calibration, high-voltage battery health monitoring, electric powertrain upkeep, and mechanical wear-and-tear repair for BEV and PHEV vehicles across passenger cars, light commercial vehicles, and heavy commercial buses and trucks in South Africa, across a 2025 base year and a 2026 to 2030 forecast period, denominated in United States dollars at the pack's own stated constant baseline rate of 18.50 ZAR per USD. It excludes conventional non-plug-in hybrids, whose servicing architecture relies almost entirely on internal combustion protocols.
The analysis spans three segmentation dimensions — vehicle operational category, service provider channel and technical service scope — five provincial groupings, and 14 profiled entities across dealer conglomerates, fleet operators and regulatory bodies. Fleet figures trace to naamsa and eNaTIS; market value and all three segmentation dimensions trace directly to the underlying research's own fully worked sizing model, with both 2025 and 2030 figures directly source-stated throughout.